T H E U S E O F X - R A Y M E T H O D S I N C H E M I C A L A N A L Y S I S
CY R I L L BR O S S E T
Chalmers University of Technology, Institute of Inorganic Chemistry, Gothenburg, Sweden
In the introduction to a book on analytical chemistry from 1853 the famous analytical chemist Fresenius expresses his great satisfaction with the equip- ment his science was provided with at that time. This equipment consisted mainly of platinum, glass and porcelain vessels of very good quality. But even if this equipment had made it possible to perform most analyses with great accuracy, Fresenius still admits, perhaps with some pride, that patience and skill were the fundamentals of the art of analysis. And I think that all of us who have carried out chemical analyses in the classical way under- stand what Fresenius means by patience.
A n important step in the direction of more rapid analytical methods was taken when the use of electromagnetic radiation was introduced in chemical analysis. In 1859, only six years after Fresenius had written the book men- tioned above, Kirschoff and Bunsen constructed the first spectroscope that could be used in practical work. Nevertheless it is only 20-30 years since we got really useful instruments for optical analyses.
The application of the region of electromagnetic radiation, which we call X-rays, to chemical analysis is still more recent, commercial instruments in this field being available only during the last few years.
The application of X-rays to chemical analysis is consequently quite a young science, but the methods are in a state of rapid development. The number of different instruments in the market is also rapidly increasing. It seems therefore hardly possible to describe or even enumerate the respective instruments in a short survey. W e have to limit ourselves to the underlying principles and to the different types of methods.
I think it would be reasonable to start with just a brief description of the four main methods.
7. The specimen is bombarded with electrons of suitable energy. The lines of the characteristic X-ray spectra produced in this way are identified by wavelength and intensity measurement. This identification is equivalent to the identification of the elements present in the specimen. A special technique and accurate intensity measurement may give quantitative results.
W e will describe this method as X-ray spectrography, qualitative and quanti- tative.
2. X-rays with suitable energies are produced. A specimen is exposed to these X-rays with the excitation of the characteristic X-ray spectra as a result. These spectra are identified in the same way as in the spectrographic method. W e will describe this method as fluorescent X-ray spectrography, qualitative and quantitative.
3. X-rays with a suitable energy distribution are generated and the trans- mission of a beam through the specimen is measured. If the measurements are performed so as to give the transmission as a function of the wavelength, identification of the elements present in the specimen may be obtained.
Usually the measurements are performed to give the contents of one or several elements in the specimen. W e will describe this method as X-ray absorption analysis.
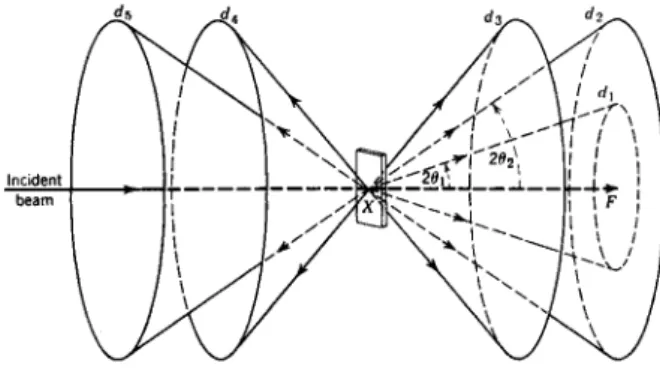
4. A crystalline powdered specimen is exposed to a beam of X-rays of suitable energy. Diffraction occurs. The angles of deviation and the relative intensities of the deviated beams are measured. These measurements may give the phase composition of the specimen. With special methods and accurate intensity measurement quantitative or semi-quantitative results may be obtained. This method will be described as the powder method.
If we study these different types of chemical analysis by means of X-rays, we soon find that each method is complex, but the different component methods are in many cases common to several of the analytical processes.
The description will therefore gain in simplicity if, for further discussion, we first recognize the different components methods.
I think the following scheme will cover most of the field.
1. Generation of X-rays with a suitable energy distribution;
(a) Generation of white radiation;
(b) Excitation of the characteristic X-ray spectrum;
(c) Generation of monochromatic radiation.
2. Measurement of X-ray intensities;
(a) Measurement of zones of maximum or minimum intensity;
(b) Quantitative measurements of relative intensities.
3. Measurement of X-ray frequencies.
4. Measurement of lattice spacings.
I think we will get the basis of all these component methods if we analyze the following problems
1. What happens when electrons of a certain speed impinge on matter?
2. What happens when Arrays interact with matter?
ο 025 0-5 075 10 Wavelength *-
U L OS 10
I.O I.5 2 . 0
Wavelength in A
2.5 0 10 IS
Wavelength • {%)
Fig. 1. Fig. 2. Fig. 3.
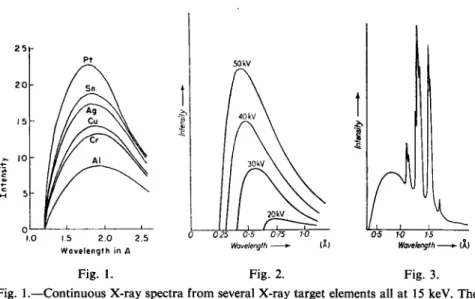
Fig. 1.—Continuous X-ray spectra from several X-ray target elements all at 15 keV. The intensity of the spectrum depends on atomic number, but the minimum wavelength depends on X-ray tube voltage. (From L. S. Birks, X-ray Spectrochemical Analysis, p. 4, Vol. XI in Chemical Analysis, a series of monographs on analytical chemistry and its applications. Interscience Publishers, 1959.)
Fig. 2.—The continuous X-ray spectrum emitted by a tungsten target tube operated at a series of voltages.
Fig. 3.—Part of the characteristic spectrum of tungsten superimposed on the continuous spectrum. (From A. A. Smales and L. R. Wager, Methods in Geochemistry. Interscience Publ., New York 1960. Fig. 2, p. 113; Fig. 3, p. 114.)
I N T E R A C T I O N O F A C C E L E R A T E D E L E C T R O N S W I T H M A T T E R
If electrons strike a material, preferably a metal of high melting point and with a great, although not too great speed, they may lose their kinetic energy by deceleration. By a rather complicated mechanism the lost kinetic energy is partly transformed into X-rays.
Fig. 1 shows the photon energy distribution observed when electrons accelerated to 15 kV impinge on six different metals. W e see that the photon energy as expressed here in terms of wavelengths is, under a certain limit, continuous. X-rays of this kind are usually called "white X-radiation".
The limiting maximum photon energy or minimum wavelength correspond to the total loss of kinetic energy of the electron. The diagram gives us still more information. W e see that the overall intensity of the spectrum depends on the atomic number Z.
Fig. 2 shows the dependence of the white radiation on the voltage ( V ) of the tube. It can be shown that the total energy of X-radiation emitted by a tube is proportionel to Z V2.
W e have seen that moderate voltages applied to an X-ray tube give white radiation. If, however, the voltage is sufficiently raised, we get the
η 1
2 2 2
3 3 3 3 3
4 4 Λ 4 4
4 4 5
5 5
S ί 0
0 1 1
0 1
\ 2 2
0 t 1 2 2
3 3 0 1 1
2 J
τ {
J 1 2 7 \
5 2
*
2 3 J 2
t Τ
7 7
*
5 S Σ I
^ Κ Series
η 1
2 2 2
3 3 3 3 3
4 4 Λ 4 4
4 4 5
5 5
S ί 0
0 1 1
0 1
\ 2 2
0 t 1 2 2
3 3 0 1 1
2 J
τ {
J 1 2 7 \
5 2
*
2 3 J 2
t Τ
7 7
*
5 S Σ I
a 2
a ,/ t<
Ί
s, •1
1* L Series
•H
η 1
2 2 2
3 3 3 3 3
4 4 Λ 4 4
4 4 5
5 5
S ί 0
0 1 1
0 1
\ 2 2
0 t 1 2 2
3 3 0 1 1
2 J
τ {
J 1 2 7 \
5 2
*
2 3 J 2
t Τ
7 7
*
5 S Σ I η 1
2 2 2
3 3 3 3 3
4 4 Λ 4 4
4 4 5
5 5
S ί 0
0 1 1
0 1
\ 2 2
0 t 1 2 2
3 3 0 1 1
2 J
τ {
J 1 2 7 \
5 2
*
2 3 J 2
t Τ
7 7
*
5 S Σ I
Ml*
1
1
7/
II TL 1
tl 11 II 11 Π 11
?» («• -M Series ---*|
η 1
2 2 2
3 3 3 3 3
4 4 Λ 4 4
4 4 5
5 5
S ί 0
0 1 1
0 1
\ 2 2
0 t 1 2 2
3 3 0 1 1
2 J
τ {
J 1 2 7 \
5 2
*
2 3 J 2
t Τ
7 7
*
5 S Σ I
Μ ψ*
η 1
2 2 2
3 3 3 3 3
4 4 Λ 4 4
4 4 5
5 5
S ί 0
0 1 1
0 1
\ 2 2
0 t 1 2 2
3 3 0 1 1
2 J
τ {
J 1 2 7 \
5 2
*
2 3 J 2
t Τ
7 7
*
5 S Σ I
... "XL
η 1
2 2 2
3 3 3 3 3
4 4 Λ 4 4
4 4 5
5 5
S ί 0
0 1 1
0 1
\ 2 2
0 t 1 2 2
3 3 0 1 1
2 J
τ {
J 1 2 7 \
5 2
*
2 3 J 2
t Τ
7 7
*
5 S Σ I
Ni
ί Γ 1 Γ F F
η 1
2 2 2
3 3 3 3 3
4 4 Λ 4 4
4 4 5
5 5
S ί 0
0 1 1
0 1
\ 2 2
0 t 1 2 2
3 3 0 1 1
2 J
τ {
J 1 2 7 \
5 2
*
2 3 J 2
t Τ
7 7
*
5 S Σ I
3
η 1
2 2 2
3 3 3 3 3
4 4 Λ 4 4
4 4 5
5 5
S ί 0
0 1 1
0 1
\ 2 2
0 t 1 2 2
3 3 0 1 1
2 J
τ {
J 1 2 7 \
5 2
*
2 3 J 2
t Τ
7 7
*
5 S Σ I
Μ π.
η 1
2 2 2
3 3 3 3 3
4 4 Λ 4 4
4 4 5
5 5
S ί 0
0 1 1
0 1
\ 2 2
0 t 1 2 2
3 3 0 1 1
2 J
τ {
J 1 2 7 \
5 2
*
2 3 J 2
t Τ
7 7
*
5 S Σ I η 1
2 2 2
3 3 3 3 3
4 4 Λ 4 4
4 4 5
5 5
S ί 0
0 1 1
0 1
\ 2 2
0 t 1 2 2
3 3 0 1 1
2 J
τ {
J 1 2 7 \
5 2
*
2 3 J 2
t Τ
7 7
*
5 S Σ I η 1
2 2 2
3 3 3 3 3
4 4 Λ 4 4
4 4 5
5 5
S ί 0
0 1 1
0 1
\ 2 2
0 t 1 2 2
3 3 0 1 1
2 J
τ {
J 1 2 7 \
5 2
*
2 3 J 2
t Τ
7 7
*
5 S Σ I
<V
η 1
2 2 2
3 3 3 3 3
4 4 Λ 4 4
4 4 5
5 5
S ί 0
0 1 1
0 1
\ 2 2
0 t 1 2 2
3 3 0 1 1
2 J
τ {
J 1 2 7 \
5 2
*
2 3 J 2
t Τ
7 7
*
5 S Σ I
-
η 1
2 2 2
3 3 3 3 3
4 4 Λ 4 4
4 4 5
5 5
S ί 0
0 1 1
0 1
\ 2 2
0 t 1 2 2
3 3 0 1 1
2 J
τ {
J 1 2 7 \
5 2
*
2 3 J 2
t Τ
7 7
*
5 S Σ I
Fig. 4.—Complete energy-level diagram [to element 92 (uranium)], showing the origin of X-ray spectral lines. (From Richtmyer, "Introduction to Modern Physics".)
effect seen in Fig. 3. On the continuous spectrum a line spectrum is super
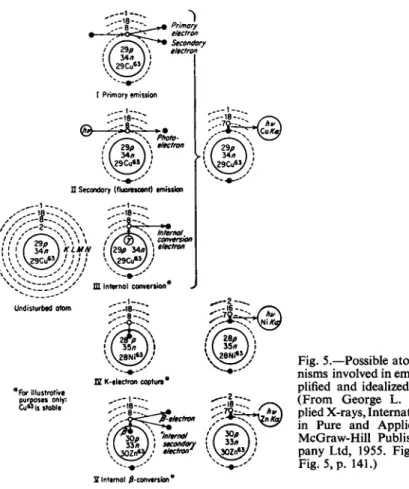
imposed. Several other effects give such a line spectrum, and the explanation for its appearance is as follows. When an electron with sufficient energy hits an atom, one of its inner electrons may be knocked out. The vacancy is subsequently filled by another electron coming from a higher energy level and consequently losing energy as it "jumps down". The energy lost by the electron leaves the system in the form of an X-ray photon. This process can proceed in several different ways as seen in Fig. 4. If the vacancy has been produced in the K-level (the innermost electron shell) this vacancy may be filled up in eight ways. Three of these, corresponding to al 9 a2 and β lines, are much more probable than the others and give the strongest intensity. However, vacancies may be produced in the L and higher levels giving line spectra according to similar mechanisms, which in those cases will be rather complicated. T o obtain a vacancy in a certain level, the im
pacting particle must have enough energy to remove the electron in question.
Once such vacancies are obtained the whole series of spectral lines, for in
stance the Κ series, appears at the same time.
When studying the change of frequency of the lines in such series as a
Π Secondary (fluorescent) emission
Fig. 5.—Possible atomic mecha
nisms involved in emission (sim
plified and idealized diagrams).
(From George L. Clark, Ap
plied X-rays, International Series in Pure and Applied Physics.
McGraw-Hill Publishing Com
pany Ltd, 1955. Fig. 4, p. 140;
Fig. 5, p. 141.)
I Internal ^-conversion*
function of the atomic number, Moseley in 1914 recognized that this varia
tion was continuous and not periodic. He showed further that if the square root of the reciprocal of the wavelength ( = wave number) of a given line was plotted against the atomic number, a practically straight line resulted.
This is the Moseley law and may for a K-line be written in the following way
where R is the fundamental wave number. Similar formulas are valid for all other X-ray lines. This simple dependence of the X-ray frequencies on the atomic number gives a very effective method of identifying elements.
T H E I N T E R A C T I O N O F X - R A Y S W I T H M A T T E R The effects observed when X-rays interact with matter will be discussed.
The following may happen. Part of the X-ray photons (7) may be trans-
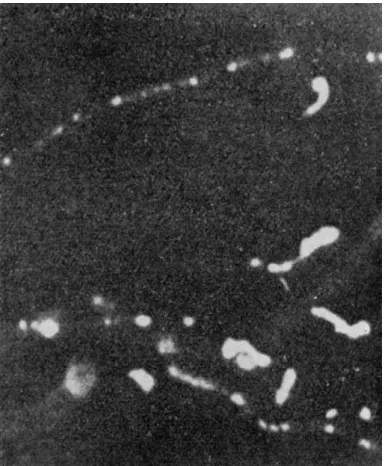
Fig. 6.—From Arthur H. Compton and Samuel K. Allison, X-Rays in Theory and Experiment, p. 17. Macmillan and Co., London, 1935.
mitted without any change, (2) may strike an atom and produce secondary (fluorescent) X-rays and photoelectrons, (3) may strike loosely bounded electrons and give up to them part of their own energy. This results in recoil electrons and scattering of modified X-rays (with the energy decreased), the so-called Compton scattering. (4) Part of the X-ray photons may be scattered unmodified by atoms or atomic groups.
There is nothing to be said about (7). Some information about (2) pro
duction of fluorescent X-rays may be gained from Fig. 5. As indicated there (the second case), fluorescent radiation is produced when photons with sufficient energy knock out an inner electron. Besides we get photo- electrons which produce ionisation in the surrounding media as may be seen in a Wilson chamber. Such an observation is given in Fig. 6. The long tracks are photo-electrons, the short tracks on the picture are ionisation effects produced by recoil electrons mentioned above under (5).
22 - 6014304ο I & Μ
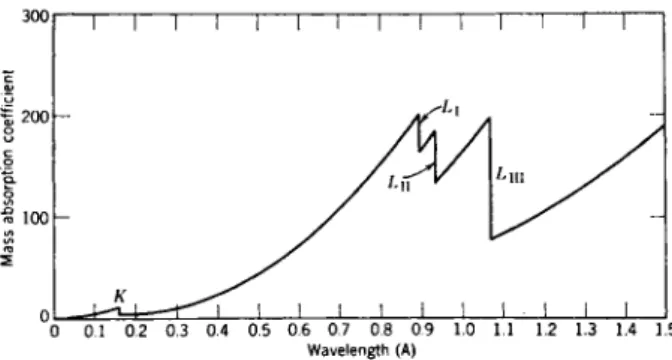
3 0 0I I I I I I 1 I I I I I I I Γ
0 0.1 0.2 0.3 0.4 0.5 0.6 0.7 0.8 09 1.0 1.1 1.2 1.3 1.4 1.5 Wavelength (A)
Fig. 7.—Plot of the mass absorption coefficient for platinum with wavelength, showing positions of the Κ and L absorption edges.
W e may state that there are two methods for producing characteristic X-ray spectra: these can be obtained by impact of either electrons or photons of sufficient energy on the specimen in question.
The over-all loss of energy by all these effects, summarized as absorption, follows the usual exponential equation
1=1 Ρ~ μχ
where Ix is the intensity after passage of homogeneous matter of the thick
ness x, I0 is the initial intensity and μ the absorption coefficient. Usually we transform this equation in the following manner
Ix = I0e-^x
and denote μ/ρ as the mass absorption coefficient. This coefficient is related to the atoms of the matter and is independent of the physical state of the body. A s we might suspect after the discussion of the compound nature of the absorption, μ/ρ is a sum
μ/ο = τ/ρ + σ/ρ,
where τ/ρ is the true mass absorption coefficient connected with the pro
duction of photo-electrons and fluorescent X-rays, and σ/ρ is the mass absorption coefficient due to scattering. This latter is much smaller than the mass coefficient due to fluorescence. The curves giving the dependence of μIρ on A usually have their characteristics mainly from τ/ρ.
In Fig. 7 we see μ/ρ versus λ for Pt. As long as the photons have enough energy to knock a K-electron out of its shell, they are absorbed in such a process. The probability of the process occurring grows as the photon energy comes nearer to its limit value necessary for the process. As the photon energy falls below this limiting values, the interaction of photons with K-
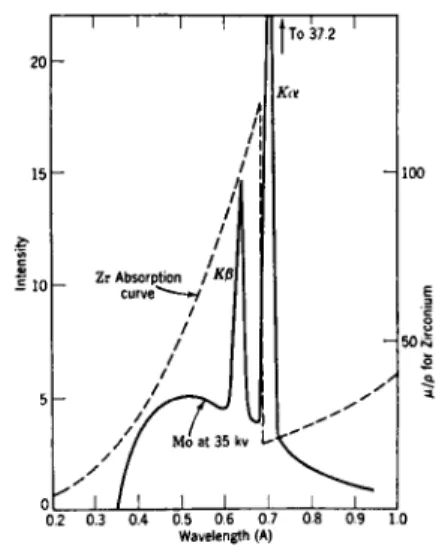
Fig. 8.—The zirconium absorption curve, su
perposed on 35-kV molybdenum radiation.
j . 3 u.o υ./
Wavelength (A)
electrons stops, which implies a discontinuous decrease in absorption. The same procedure is repeated in the energy region of the three L-electrons.
Use can be made of these absorption discontinuities (absorption edges, as we call them) in several materials, for instance, to obtain a partial mono- chromatization of X-radiation.
Fig. 8 shows the characteristic K-series (unresolved) of M o superimposed on the continuous spectrum as it appears in an X-ray tube with M o anode, when operating at 35 kV. If this radiation is filtered through a layer contain
ing zirconium, the resultant radiation will mainly consist of the peak radia
tion at 0.71 A. As is shown by the superposition of the Zr absorption curve, the region between 0.69 and 0.4 A will be strongly depressed. Excitation of a characteristic X-ray spectrum and filtration thus give fairly mono
chromatic X-radiation. A method that gives still purer radiation will be described later.
W e have already called attention to the fact that X-rays release recoil electrons and photoelectrons. These electrons in their turn cause ionization, providing a means of measuring the intensity of X-rays with ionization chambers. This was done by Bragg in his classical investigations on the structure of matter. The most used method, however, is the photographic one, where the measured blackening on a photographic film or plate may give a relative value for the X-ray intensity. Nowadays, however, the technique developed for measurement of y-radiation has more and more been applied to X-rays. W e have methods based on Geiger counters, pro
portional counters and especially scintillation counters combined with pulse height analysers and discriminators. Though the methods for measuring X-ray intensities in the last few years have been very much improved, much work in this field still remains to be done.
Incident beam
Fig. 9.—Diffraction of X-rays by a flat powder cake.
In the interaction between X-rays and matter, we recall that a part of the X-rays was scattered without any change in energy. This effect is, as we know, of tremendous importance, and forms the basis for all the varieties of diffraction techniques used for many different purposes. W e will briefly consider what is of importance for chemical analysis in this connection.
When an X-ray beam falls upon a crystalline body, where atoms or atomic groups are arranged in a three-dimensional pattern the unmodified or coherent scattering may result in diffraction. This occurs when the con
ditions of the well-known Bragg law are fulfilled:
ηλ = 2d sin Θ,
where η is a whole number (order of diffraction), λ the wavelength, d the spacing of the crystal plane, and θ the angle between the crystal plane and the incident beam. W e may express this in the following way. When X-rays with the wavelength λ fall upon a crystal plane with the spacing d, they may be reflected only if the angle θ fulfills the Bragg condition. If we have now observed such a reflection and measured the angle θ and if we further know the spacing d of the plane we then have the possibility of calculating the value of λ. It is desirable that λ and d in such cases should be of the same order of magnitude. This diffraction principle constitutes the basis for wavelength measurements in connection with chemical analyses. Further
more, if a polychromatic beam falls upon a crystal in a suitable way, only the radiation, that with respect to λ fulfills the Bragg condition, will be reflected. This gives us a method of obtaining strictly monochromatic X-rays.
If we let a monochromatic beam fall upon a powdered specimen, for each d value in the crystalline powder, the diffracted rays will follow the cone-angle 20, as is seen from Fig. 9. If we register, for instance, by means of a photograph, the diffracted rays along a circle with the primary beam
Fig. 10.—Geometrical features of the Debye-Scherrer technique. (From Harold P. Klug and Leroy E. Alex
ander, X-ray Diffraction Procedures.
John Wiley & Sons, 1954. Fig. 7, p. 93; Fig. 8, p. 101; Fig. 9, p. 163;
and Fig. 10, p. 164.)
as diameter, we get the result demonstrated in Fig. 10. Where the cones cut the film circle we obtain lines. Every line corresponds to a spacing d in the crystalline phase where spacing values can now be calculated from the known Α-value and the measured 0-values. The intensity of the lines is a function of the fine structure of the body.
The line pattern obtained with this so-called powder method may be con
sidered as a finger-print of a phase. The recording of such powder photo
graphs is then the basis of phase identification with X-rays.
A N A L Y T I C A L M E T H O D S B Y M E A N S O F X - R A Y S N o w , having made a brief survey of the different operations connected with chemical analysis by means of X-rays we will return to our first scheme containing the different analytical methods and see how these are combined of the different component operations.
X-ray spectrography
In Fig. 11 we see Moseley's spectrograph. Electrons bombard a specimen exciting characteristic radiation. A crystal is held in a fixed position and reflects each time a very definite region of the spectrum upon the photo
graphic plate. Several more advanced instruments have been built for similar purposes. A very modern instrument working according to the same principles is the electron-probe X-ray micro-analyser developed by Castaing.
Only an area of about 1 μ2 on the specimen is hit by a finely focused electron beam. The characteristic radiation is analysed by means of diffraction by different crystals and the intensity measured by a Geiger or proportional counter.
Fig. 11.—Moseley's vacuum spectro- graph. (From Georg von Hevesy, Chemical Analysis by X-rays and Its Applications, p. 41. McGraw- Hill Book Co. Inc. New York 1932.)
X-ray fluorescent spectrography
A s is seen from Fig. 12, white radiation from an X-ray tube strikes a specimen. The rays consisting of the excited characteristic spectrum pass through a collimator and are analyzed by a rotating crystal. The Geiger counter rotates with double the angular speed so as to be continuously in position to register possible reflexions. Lighter elements than N a cannot yet be analyzed in this way for several reasons. Different crystals with different spacings are used for measurements in different wavelength regions.
X-ray absorption photometry
White or sometimes monochromatic X-rays are made to pass alternately through two cells (see Fig. 13). One of them may contain a liquid or a gaseous specimen. A flow of the sample is possible too. The other cell is a reference cell. After penetrating the cells, the two beams strike a fluorescent screen.
With an aluminium attenuator of variable thickness the intensity of the beam passing through the reference cell is adjusted until the intensity
Specimen Geiger counter speed) Fig. 12.—Diagram of basic geometry of fluorescence-analysis method.
Fig. 13.—X-ray absorption photo- meter (absorptiometer). (From George L. Clark, Applied X-rays, International Series in Pure and Ap- plied Physics. McGraw-Hill Pub- lishing Company Ltd, 1955. Fig. 12, p. 148; Fig. 13, p. 185.)
of both beams as registered by means of an electron multiplier phototube are equal. From the position of the attenuator the thickness of the absorbing aluminium sheet is obtained. This gives in its turn the absorption in the specimen and from the absorption the content of some absorbing com- ponent may in special cases be evaluated. Lead in petrol is analyzed in this way. There are many other applications, especially in routine work con- cerning determinations of heavier elements among lighter ones.
The powder method
The principles of powder diffractometry have already been discussed.
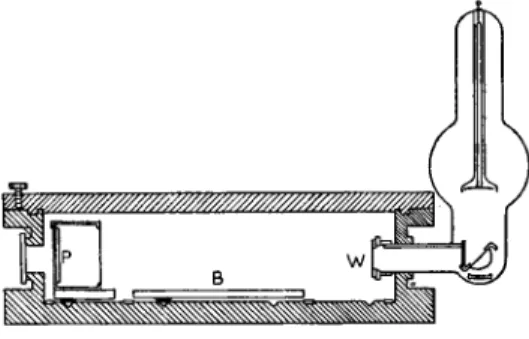
The simplest apparatus for obtaining a diffraction pattern is the Debye- Scherrer camera, shown in Fig. 14. The primary X-ray beam enters the
Fig. 14. Fig. 15.
Fig. 14.—Arrangement involving a movable finger for compressing film against camera wall.
Fig. 15.—Focusing arrangements involving a curved-crystal monochromator.
Fig. 16.—(A) Optical arrangement used in early X-ray spectrometer; (B) Newer optical arrangement with a "line" X-ray source and Soller slits to limit vertical divergence.
(From Harold P. Klug and Leroy E. Alexander, X-ray Diffraction Procedures. John Wiley & Sons Inc., 1954. Fig. 14, p. 182; Fig. 15, p. 218; Fig. 16, p. 241.)
camera through the collimator C and hits the sample mounted on a rod at the center of the camera, and then proceeds out of the camera through the exit E. The diffracted beams are recorded by a photographic film, resting against the inner wall of the camera housing (see Fig. 14). A n improved ratio of diffraction peak to background scattering can be obtained if the primary beam is monochromatized by the reflection from a plane crystal before entering the camera.
The Guinier camera makes use of monochromatization in a more so
phisticated manner (Fig. 15). By inserting a curved crystal monochromator, the radiation can be focused on the film, thereby improving the intensity as compared with a flat crystal monochromator.
During the last few years the spectrometric powder technique has come into more widespread use. The radiation is here recorded with a counter, generally a Geiger counter. The path of the beam in a spectrometer is illustrated in Fig. 16. The vertical divergence of the beam is limited by two Soller slits, s1 and s2. The beam emerges with a horizontal angular divergence γ determined by the slit X, from the line focus of an X-ray tube F. The sample S acts as a focusing device, focusing the diffracted beam through the slit Μ onto the thin receiving slit G in front of the Geiger counter. By rotating the sample with half the angular speed of the Geiger counter, i.e.
keeping the angle of incidence equal to the angle of reflection, the absorp
tion correction for the sample will generally be independent of angle. The output from the Geiger counter can be fed into a recorder and obtained as a graph, permitting an easy determination of line intensities. In the case of the film methods, on the other hand, intensity measurements are cumber
some, since they require photometry of the films or plates.
S U M M A R Y
In the survey given above, those principles in the physics of X-rays which are of interest to the chemical analyst have been discussed. The principles have been combined to standard operations. Finally the various analytical methods have been described as combinations of these standard operations.
The methods included are as follows: X-ray spectrography, X-ray fluores- cent spectrography, X-ray absorption photometry and the powder method in X-ray diffraction.
![Fig. 4.—Complete energy-level diagram [to element 92 (uranium)], showing the origin of X-ray spectral lines](https://thumb-eu.123doks.com/thumbv2/9dokorg/1137157.81025/4.669.61.631.107.510/complete-energy-diagram-element-uranium-showing-origin-spectral.webp)