Received: 11 10, 2017; Revised: 02 08, 2018; Accepted: 02 08, 2018
This article has been accepted for publication and undergone full peer review but has not been through the copyediting, typesetting, pagination and proofreading process, which may lead to differences between this version and the Version of Record. Please cite this article as doi:
10.1002/jssc.201701372 .
This article is protected by copyright. All rights reserved.
Effect of the flow profile on separation efficiency in pressure-assisted reversed-polarity capillary zone electrophoresis of anions: simulation and experimental evaluation
Gabor Jarvas1,2, Marton Szigeti1,2, Andras Guttman1,3
1Horváth Csaba Memorial Institute of Bioanalytical Research, Research Centre for Molecular Medicine, Faculty of Medicine, University of Debrecen, Debrecen, Hungary
2MTA-PE Translational Glycomics Group, University of Pannonia, Veszprem, Hungary
3SCIEX Separations, Brea, CA
Running title: Separation efficiency in reversed polarity CZE
Corresponding author: Prof Andras Guttman, Postal address: Research Centre for Molecular
Medicine, Faculty of Medicine, University of Debrecen, Egyetem tér 1. Debrecen, Hungary H-4010; e- mail: a.guttman@northeastern.edu
Abbreviations: APTS: 8-aminopyrene-1,3,6-trisulfonic acid; CFD: computational fluid dynamics; EDL:
electric double layer;
Keywords: capillary electrophoresis, electroosmotic flow, pressure-assisted flow, separation efficiency
Abstract
Capillary electrophoresis connected to electrospray ionization mass spectrometry is a promising combination to analyze complex biological samples. The use of sheathless electrospray ionization interfaces, such as a porous nanoelectrospray capillary emitter, requires the application of forward
This article is protected by copyright. All rights reserved.
2
flow (either by pressure or electroosmosis) to maintain the electrospray process. The analysis of solute molecules with strong negative charges (e.g., aminopyrenetrisulfonate labeled glycans) necessitates a reversed-polarity capillary electrophoresis separation mode, in which case the electroosmotic flow is counter current, thus pressure assistance is necessary. In this study, we compared the effect of forced convection with and without counter electroosmotic flow on the resulting separation efficiency in capillary electrophoresis based on flow profile simulations by computational fluid dynamics technique and by actual experiments. The efficiencies of the detected peaks were calculated from the resulting electropherograms and found approximately 790 000 plates/m for electrophoresis with counter electroosmotic flow, 16 000 plates/m with pressure only (such as would be in open tubular liquid chromatography) and 400 000 plates/m for electrophoresis with simultaneous counter electroosmotic flow and forward pressure assistance, which validates the simulation data.
1 Introduction
CE is a powerful liquid-phase separation technique that plays an important role in the field of bioanalytics. Connection of CE to MS by an ESI interface represents a promising combination to obtain good separation efficiency and detection versatility [1]. CE–ESI-MS hyphenation can be typically accomplished by means of three different interface types: co-axial sheath–liquid interface, sheathless interface, and the so-called liquid–junction interface [2, 3]. The most frequently used is the sheath–liquid interface [4, 5]. The sheathless arrangement [6, 7] recently became a very popular alternative due featuring significantly reduced ion suppression [8]. However, the use of sheathless- type MS interfaces requires maintaining the electrospray process with a bulk flow that can be accommodated either by forward electroosmotic pumping or pressurization. The third type is the liquid–junction interface, where the make-up fluid is delivered through a junction, which decouples the CE capillary and the ESI tip by a liquid gap [9].
This article is protected by copyright. All rights reserved.
3
Utilization of pressure assisted analyte mobilization in capillary columns results in laminar flow characteristics consequently forming a parabolic flow profile with the associated band broadening effect [10, 11]. EOF, on the other hand, has a plug shape flow profile causing minimal band
broadening. Bare fused-silica capillaries acquire various negative surface charge densities, depending on the pH of the BGE. Primarily, this ionization process happens through dissociation of the terminal silanol groups and provide the basis of the formation of the electric double layer and the consequent EOF. The degree of dissociation and the concomitant surface charge density is a result of the
equilibrium between the ions at the surface and in the bulk [12]. This charge partition is
characterized with three distinguishable layers: the first layer, known as the surface charge layer, is formed by cations absorbed on the surface hydroxides of the bare fused-silica capillaries due to Columbic attraction and becoming significant at pH > 5.5 [13]. The second layer, usually referred to as diffusive layer, is comprised of free anions from the BGE and attracted to the surface charge layer.
The diffuse layer screens the surface charge and its net charge is equal to the surface charge, but with opposite polarity. The third layer is located further from the capillary wall and forms the electroneutral bulk [14]. Due to the emerging importance of CE separation based bioanalytical techniques, mainly CE–ESI-MS, numerous interesting papers have been published [15-17] dealing with the separation efficiency of CE, however, none of them focused on the in-depth, numerical simulation supported investigation of reversed polarity CZE with pressure-assisted forwarding.
Simulation of the profiles of forced convection and EOF is possible by the utilization of
computational fluid dynamics (CFD) modeling. CFD simulation of the EOF is challenging as it involves a multiphysics consideration: i) the formed electric field is the function of the ion concentration in the BGE calculated from the mass transport; ii) the electric field is recovered from the gradients of the potential field; iii) the bulk fluid motion is described by the Navier–Stokes equations (including the continuity function) [18]. While a great number of publications have been dealing with the analytical aspects of this particular electrokinetic phenomenon, only a few of them discuss the effect
This article is protected by copyright. All rights reserved.
4
of EOF when associated with forced convection [19, 20]. As a matter of fact, this combination is especially important with the use of sheathless interfaces [21], where the ESI requires a bulk flow to support the electrospray process and driving the solute molecules into the MS instrument.
2 Materials and Methods
2.1 Chemicals
Lithium acetate (25 mM; Sigma–Aldrich, St. Louis, MO) buffer (pH = 4.75) was used in all
experiments as BGE with a calculated conductivity of 0.175 [S/m]. Conductivity calculation was done by PeakMaster 5.3 [22]. The Fast Glycan Sample Preparation and Analysis kit (SCIEX, Brea, CA) was used for the fluorophore labeling of the maltotriose with 8-aminopyrene-1,3,6-trisulfonic acid (APTS) that was used as model analyte in all experiments.
2.2 Instrumentation
All CE separations were performed on a P/ACE MDQ CE systems (SCIEX), equipped with a laser induced fluorescent detector (excitation: 488 nm, emission: 520 nm). The effective/total length of the separation capillary was 50/60 cm with 50 μm id and 365 μm od. The applied electric field strength was 500 V/cm in reversed polarity mode (cathode at the injection side). The temperature of the separation capillary was 25°C. APTS-maltotriose was injected electrokinetically at 1 kV for 1 s.
The 32 Karat version 9.1 software package (SCIEX) was used for data acquisition and analysis.
The dynamic viscosity of the BGE was measured by an AR 550 model rheometer (TA Instruments, New Castle, DE, USA).
2.3 Software
This article is protected by copyright. All rights reserved.
5
Stationer solver of commercially available software COMSOL Multiphysics version 4.3.0.151 (COMSOL AB, Stockholm, Sweden) was used to obtain time invariant solutions including the pressure, the velocity field and the electric potential for the entire computational domain.
3 Results and Discussion
3.1 Simulation of the flow characteristics
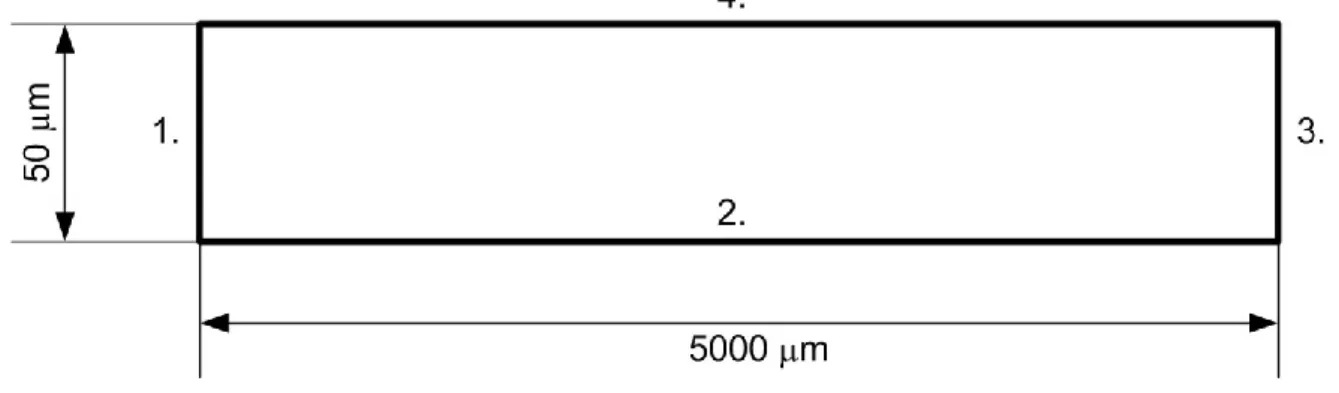
First, the electric double layer was numerically modeled utilizing three different operational modes in an integrated multiphysics approach, to achieve adequate simulation of the EOF: i) the electric field was governed by the applied potential gradient; ii) the space charges were the function of the anion and cation concentrations calculated by the Fick law; iii) the convective transport of ions was derived by using the laminar form of the Navier–Stokes equation. The electrostatic part and ion concentration were coupled by the volume force, which was calculated using the electric charge density available from the spatial concentration of anions and cations. The modeled geometry domain, which was involved in all simulations is depicted in Figure 1, where numbers 1–4 denote the corresponding boundaries.
The calculations were done in 2D plain mode to reduce the otherwise high computational demand, i.e., spatial effects were neglected. This simplification is widely accepted in the field [23], since commonly applied CE BGEs do not contain any solid particles and the average separation time is significantly shorter that of the time required for sedimentation or phase partitioning. The Debye length of the electric double layer (EDL) in weak electrolytes is usually in the nanometer range and its proper numerical simulation requires complex meshing of the modeled domain. Meshing (also referred to as grid generation or discretization) was done by means of mapped quadratic element method in the bulk and the so-called mapped boundary layer was applied close to the walls. Since meshing was a crucial step in this model development, special attention was paid to obtain grid- independent data, which was achieved by repeatedly meshing the geometry with different mesh
This article is protected by copyright. All rights reserved.
6
sizes. The resulted optimal mesh, shown in Figure 2 consisted of 90090 domain elements and 1774 boundary elements.
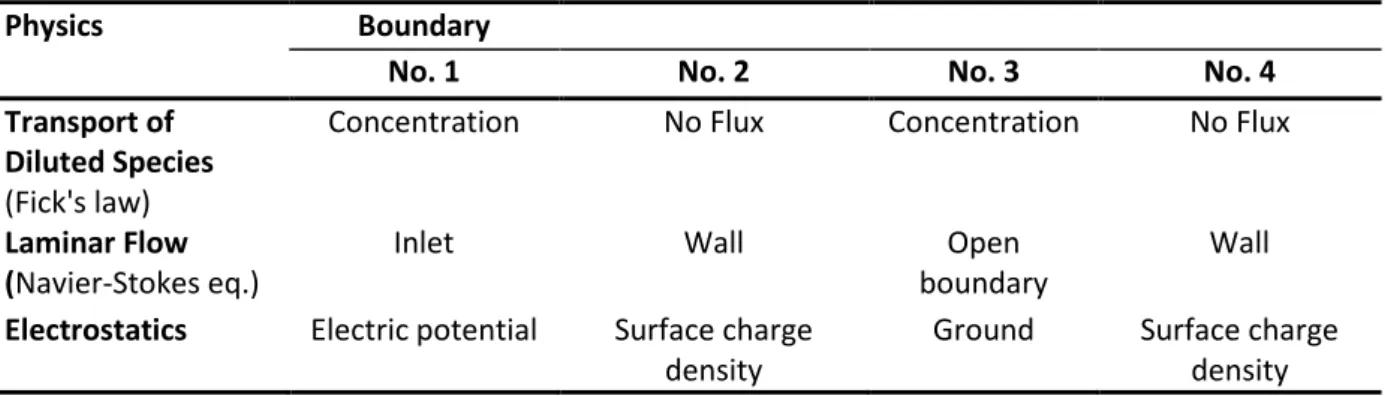
Initial and boundary conditions were required to solve the governing partial differential equation system. The applied boundary conditions are listed in Table 1, corresponding to the annotations (1–
4) shown in Figure 1.
The electric field was calculated from the gradients of the potential field as follows.
(eq
1)
where E is the electric field and V is the potential. The surface charge density is the function of the capillary material, buffer type and composition (including ionic strength, concentration and pH), and temperature just to list the most important ones. The experimentally determined surface charge density value of the bare-fused-silica capillary (–0.002 C/m2) was taken from the literature [24].
Boundary #1 was set up as the electric potential, while boundary #4 was the ground.
Please note that in CE the Reynolds number is typically well below the turbulent flow threshold, thus the forced convection contribution of the apparent BGE and analyte movements were calculated by the laminar form of the Navier–Stokes equation (eq 2):
(
( ) ) ( ( ( ) )) (eq 2)
where u is the linear velocity, ρ is the fluid density, η is the fluid viscosity, t is the time, and p is the pressure. Equation 2 should be coupled with the so-called continuity equation to ensure fluid consistency considering incompressible fluids:
(eq
3)
This article is protected by copyright. All rights reserved.
7
The dynamic viscosity at 25 mM BGE concentration was measured as 1.03 mPa·s at 25°C, while its density was assumed to be the same as for water. Boundaries #2 and #4 were treated as solid walls from convective flow point of view, i.e., u = 0 at the wall. The inlet (boundary #1) was defined as pressure, and the outlet boundary #3 was set up open, i.e., no stress was applied against the outgoing flow. The transport physics described the mass transport of anions and cations in the mixtures. This part of the multiphysics model calculated chemical species transport by diffusion (Fick’s law) and electromigration. Boundaries #2 and #4 were set to no mass flux through the wall.
Boundaries #1 and #3 represented constant anion and cation concentrations.
One of the unique advantages of CE is the plug shaped analyte migration, even when EOF is present.
Upon forced convection, which is necessary to establish the electrospray process in sheathless interfaces and drive the analyte molecules into the orifice of the mass spectrometer under zero or counter EOF conditions, a parabolic flow profile is introduced. The modeled flow profiles of forced convection, EOF and forced convection with counter EOF are shown in Figure 3. Panel A delineates the well-known parabolic velocity distribution of forced convection, caused by the friction between the fluid and the capillary wall. This friction is directly proportional with the pressure drop, in our case resulting in a maximal longitudinal dispersion of 1.2 mm. Figure 3B depicts the flat EOF profile, characteristic of CE in open tubular mode where the fluid layers in the EDL can slip on each other with minimal loss of mechanical energy. As a result, EOF driven flow does not significantly contribute to band broadening (longitudinal dispersion: 0.2 mm). Figure 3C shows the interesting case where the flow profiles of forced forward convection and counter EOF are superposed, resulting a unique profile with a longitudinal dispersion value of 0.7 mm. Therefore, in practice, we expected that the separation efficiency in this latter case would be higher that of with the pure parabolic profile.
3.2 Experimental validation
This article is protected by copyright. All rights reserved.
8
The numerical modeling results were experimentally justified in CE to demonstrate the beneficial effect of counter EOF on the resulting efficiency when forced forward convection was applied.
Migration time shifts in repeated runs i.e., the reproducibility were investigated during preliminary experiments proving excellent robustness (see Supporting Information for details). The solid trace in Figure 4 demonstrates the ideal case, when the analyte front moved by electromigration only in the presence of counter EOF (μapp = 2.4x10⁻⁴ cm2/Vs). The effectiveness of this separation mode relied on the flat EOF profile supporting the calculated plug type pattern in Figure 3B. This very narrow peak suggests that the corresponding flow velocity dissipation was minimal, meaning uniform front development. The separation efficiency was characterized by the number of theoretical plates (N), calculated as follows:
( ) (4)
where tM is the migration time of peak of interest and wh is the peak width at half height. The calculated theoretical plate number in this instance was N=477,118. Please note that in this case some counter EOF was present during the separation.
The dotted trace in Figure 4, on the other hand, represents the instance, where the analyte was mobilized by pressure only (no electric field applied), practically representing the case of open tubular LC. The calculated theoretical plate number was N=10 050 in agreement with the modeled flow pattern in Figure 3A.
In the most complex case, the effect of forced forward convection and counter EOF were
superimposed as shown by the dotted-dashed trace in Figure 4. Considering its calculated velocity dissipation of 0.0007 m/s and the resulted N=241,598, its separation efficiency was apparently between the solely electric field and pressure mediated cases, respectively. As a matter of fact, this exact phenomena occurs in sheathless ESI CE–MS in case reversed polarity separation mode to
This article is protected by copyright. All rights reserved.
9
analyze strongly negatively charged species, where the capillary is pressurized towards the MS during the CE separation to ensure the continuity of the electrospray process, while the EOF acts counter current. As a first approximation, we consider this theoretical plate value to be adequate for the analysis of samples possessing strong negative charges, such as APTS labeled glycans by CE–MS.
Please note that the peak areas (corrected by migration time) in all three cases were practically equal, i.e., 10.2 x10⁻⁶ in Trace A, 10.7 x10⁻⁶ in Trace B and 10.3 x10⁻⁶ in Trace C.
4 Concluding remarks
CE connected to MS by a sheathless ESI interface is a promising combination to obtain good separation efficiency and detection versatility, however, to maintain the electrospray process requires a bulk flow. In this paper we used Computational Fluid Dynamics modeling to simulate the flow profiles in the instances forward pressurization without the application of an electric field, using the electric field only and by combined electric field and forward pressure assistance modes. The modeling results were compared to actual experimental data by electrokinetically introducing APTS labeled maltotriose into the separation capillary and mobilized by i) electrophoresis with no forward pressure assistance, but in the presence of counter EOF, resulting N~790 000/m; ii) applying
pressure driven flow only with no electric field (and consequently no EOF) resulting N~16 000/m;
and finally, iii) electrophoresis was applied in the presence of counter current EOF and forward pressurization, resulting in N~400 000/m. We consider this latter efficiency value to be adequate for CE–MS analysis of samples possessing strong negative charges. Our findings are in full agreement with the work of Sursyakova and Rubaylo [15] and others [25, 26]. The reported flow profiles well visualize and explain the underlying flow dynamics phenomena, i.e., the superposed flat EOF and parabola-like profiles and their effect on separation efficiency.
Acknowledgment
This article is protected by copyright. All rights reserved.
10
The authors gratefully acknowledge the support of the Momentum (Lendulet) grant # 97101 of the Hungarian Academy of Sciences (MTA-PE Translational Glycomics) and the National Research, Development and Innovation Office (K 116263) grant of the Hungarian Government. This work was also supported by the BIONANO_GINOP-2.3.2-15-2016-00017 and MÁEÖ2017_5 (Tempus Public Foundation) projects.
The authors have declared no conflict of interest.
References
[1] Ding, J., Vouros, P., Advances in CE/MS. Anal. Chem. 1999, 71, 378a-385a.
[2] Tycova, A., Ledvina, V., Kleparnik, K., Recent advances in CE–MS coupling: Instrumentation, methodology, and applications. Electrophoresis 2017, 38, 115-134.
[3] Jarvas, G., Guttman, A., Foret, F., Numerical modeling of capillary electrophoresis - electrospray mass spectrometry interface design. Mass Spectrom. Rev. 2015, 34, 558-569.
[4] Kleparnik, K., Otevrel, M., Analyte transport in liquid junction nano-electrospray interface between capillary electrophoresis and mass spectrometry. Electrophoresis 2010, 31, 879-885.
[5] Olivares, J. A., Nguyen, N. T., Yonker, C. R., Smith, R. D., On-line mass spectrometric detection for capillary zone electrophoresis. Anal. Chem. 1987, 59, 1230-1232.
[6] Klampfl, C. W., CE with MS detection: a rapidly developing hyphenated technique. Electrophoresis 2009, 30 Suppl 1, S83-91.
[7] Whitt, J. T., Moini, M., Capillary electrophoresis to mass spectrometry interface using a porous junction. Anal. Chem. 2003, 75, 2188-2191.
[8] Jarvas, G., Fonslow, B., Yates, J. R., 3rd, Foret, F., Guttman, A., Characterization of a Porous Nano- electrospray Capillary Emitter at Ultra-low Flow Rates. J. Chromatogr. Sci. 2017, 55, 47-51.
This article is protected by copyright. All rights reserved.
11
[9] Hommerson, P., Khan, A. M., de Jong, G. J., Somsen, G. W., Ionization techniques in capillary electrophoresis-mass spectrometry: principles, design, and application. Mass Spectrom. Rev. 2011, 30, 1096-1120.
*10+ Kinzer, J. A., Olesik, J. W., Olesik, S. V., Effect of Laminar Flow in Capillary Electrophoresis:
Model and Experimental Results on Controlling Analysis Time and Resolution with Inductively Coupled Plasma Mass Spectrometry Detection. Anal. Chem. 1996, 68, 3250-3257.
[11] Jarvas, G., Guttman, A., Modeling of cell sorting and rare cell capture with microfabricated biodevices. Trends Biotechnol. 2013, 31, 696-703.
[12] Behrens, S. H., Grier, D. G., The charge of glass and silica surfaces. J. Chem. Phys. 2001, 115, 6716-6721.
[13] Andrews, A. T., Electrophoresis, Theory, Techniques and Biochemical and Clinical Applications, Claredon Press Oxford, Oxford, England 1986.
[14] Schwer, C., Kenndler, E., Electrophoresis in fused-silica capillaries: the influence of organic solvents on the electroosmotic velocity and the zeta potential. Anal. Chem. 1991, 63, 1801-1807.
[15] Sursyakova, V. V., Rubaylo, A. I., New peak broadening parameter for the characterization of separation capability in capillary electrophoresis. J. Sep. Sci. 2015, 38, 690-696.
[16] Piestansky, J., Marakova, K., Galba, J., Kovac, A., Mikus, P., Comparison of hydrodynamically closed two-dimensional capillary electrophoresis coupled with ultraviolet detection and
hydrodynamically open capillary electrophoresis hyphenated with mass spectrometry in the bioanalysis of varenicline. J. Sep. Sci. 2017, 40, 2292-2303.
[17] Kist, T. B. L., Number of theoretical plates achievable by a toroidal capillary electrophoresis system. J. Sep. Sci. 2017, 40, 4619-4627.
[18] Ghosal, S., in: Chakraborty, S. (Ed.), Microfluidics and Microfabrication, Springer US, Boston, MA 2010, pp. 87-112.
This article is protected by copyright. All rights reserved.
12
[19] Huhn, C., Ramautar, R., Wuhrer, M., Somsen, G. W., Relevance and use of capillary coatings in capillary electrophoresis-mass spectrometry. Anal. Bioanal. Chem. 2010, 396, 297-314.
[20] Mark, J. J., Scholz, R., Matysik, F. M., Electrochemical methods in conjunction with capillary and microchip electrophoresis. J. Chromatogr. A 2012, 1267, 45-64.
[21] Moini, M., Simplifying CE–MS operation. 2. Interfacing low-flow separation techniques to mass spectrometry using a porous tip. Anal. Chem. 2007, 79, 4241-4246.
*22+ Hruška, V., Štědrý, M., Včeláková, K., Lokajová, J., Tesarová, E., Jaros, M., Gas, B., Eigenmobilities in background electrolytes for CZE. V. Intensity (amplitudes) of system peaks. Electrophoresis 2006, 27, 4610-4617.
[23] Pryor, R. W., Multiphysics Modeling Using COMSOL: A First Principles Approach, Jones and Bartlett Publishers, Inc. 2009.
[24] Zhang, L., Singh, S., Tian, C., Shen, Y. R., Wu, Y., Shannon, M. A., Brinker, C. J., Nanoporous silica- water interfaces studied by sum-frequency vibrational spectroscopy. J. Chem. Phys. 2009, 130, 154702.
[25] Mai, T. D., Hauser, P. C., Study on the interrelated effects of capillary diameter, background electrolyte concentration, and flow rate in pressure assisted capillary electrophoresis with contactless conductivity detection. Electrophoresis 2013, 34, 1796-1803.
[26] Mai, T. D., Hauser, P. C., Anion separations with pressure-assisted capillary electrophoresis using a sequential injection analysis manifold and contactless conductivity detection. Electrophoresis 2011, 32, 3000-3007.
This article is protected by copyright. All rights reserved.
13 Figure legends
Figure 1. Schematic representation of the modeled domain of interest. Numbers denote boundaries.
This article is protected by copyright. All rights reserved.
14
Figure 2. The meshed modeled domain showing the mapped quadratic elements in the bulk (A) and the well-structured boundary layer grid elements close to the wall (B). The inset shows the
magnified view of the boundary layer elements.
This article is protected by copyright. All rights reserved.
15
Figure 3. Simulated flow profiles of forced convection (A); EOF (B) and forced convection with counter EOF (C). Arrows show the corresponding flow velocity dissipations. Please note, flow profiles in panel A and B have opposite direction but shown here in one direction for easier comparison.
This article is protected by copyright. All rights reserved.
16
This article is protected by copyright. All rights reserved.
17
Figure 4. CE–LIF analysis of the APTS-labeled maltotriose with different mobilization modes. Solid trace: electrophoresis with counter EOF. Dotted trace: analyte mobilized by forward pressure only.
Dotted-dashed trace: electrophoresis with superimposed counter EOF and forward pressure
assistance. Capillary: 50 cm effective length (60 cm total), 50 μm id and 365 μm od bare fused-silica.
Separation: 30 kV (E = 500 V/cm) in reverse polarity mode. Forward pressure where applicable: 3447 Pa. Temperature 25°C. Electrokinetic injection: 1.0 kV for 1 sec.
This article is protected by copyright. All rights reserved.
18
Table 1. Boundary conditions of the developed multiphysics model.
Physics Boundary
No. 1 No. 2 No. 3 No. 4
Transport of Diluted Species (Fick's law)
Concentration No Flux Concentration No Flux
Laminar Flow (Navier-Stokes eq.)
Inlet Wall Open
boundary
Wall Electrostatics Electric potential Surface charge
density
Ground Surface charge density