4.3 Anomie as a thermometer of the crisis (experiment) – Social Capacity – phenomenon of the complex crisis
Ferenc Bódi – JenĘ Farkas – Zsuzsanna Horváth
Types of Anomie and Historical Background
The purpose of the chapter below is not to provide an additional interpretation of Durkheim’s concept of anomie or to represent the concept in terms of quantitative measures. As Merton said a few decades before us: “Like many of us who have tried to follow in his large footsteps and consequently wobble a bit in these excessively spacious areas, Durkheim did not afford explicit and methodical guidance to the various signs of anomie, to the observables of normlessness and deteriorated social relationships. Yet it is plain that indicators must be developed if the concept of anomie is to be utilized in empirical research.” (Merton 1968, 219) Rather, the authors’ attempt has been to design a complex measure, an experimental index to describe the symptoms of acute anomie in territorial units of various sizes.
First of all, the concept of anomie must be investigated. Its first appearance is connected to the deep global crisis, the tipping point of which served as a basis for the prognosis of the Great Depression by Nikolai Kondratiev (Kondratiev 1925), while datasets serving Durkheim’s analyses pertain to the period between 1870 and 1880.
Durkheim’s analyses are embedded in history as a social environment which includes embodied artifacts and institutions already framed, but the primary substance of historicity of human beings is their sociality as a space of free inter-subjectivity beyond any strict determinism. Durkheim relied on Guyau's idea of social environment as historically embedded (Guyau 1898) is not oriented towards discovery of hard mechanical laws of human behavior, quite the contrary, it seeks to understand social milieu with its traditions and interactions as a complex field of differentiations and free choice. To put Guyauin relationship with Taine and positivism, F. J. W. Harding (1973, p. 65) accentuates that »...the influence of a social environment ceases to be dominant in highly complex and dynamic communities which tend to break up into a number of smaller, independent milieux.« Beside »life« as dominant idea, there is a dominant motive in Guyau's thought: to liberate philosophy and science
from positivist or social evolutionist ambition to represent human beings and their social interaction in terms of mechanical determinism, and to synthesize such knowledge into laws of absolute necessity which call for scientific manipulation management of the people, a discipline which political leaders found so compelling in Saint-Simonian doctrines.
Durkheim's contribution to the study of the relationship between society and health is immeasurable. Perhaps most important is the contribution he has made to the understanding of how social integration and cohesion influence mortality. Durkheim's primary aim was to explain how individual pathology was a function of social dynamics. In Suicide, Durkheim challenges us to understand how the patterning of one of the most psychological, intimate, and, on the surface, individual acts rests upon the patterning of social facts and not upon psychological foundations. In Suicide, he shows how social facts can be used to explain changing patterns of aggregate tendency toward suicide. Durkheim introduces his work by observing how countries and other geographic units and social groups have very stable rates of suicide year after year.
Once armed with the irrefutable social patterning of suicide, Durkheim goes on to theorize that the underlying reason for suicide relates, for the most part, to the level of social integration of the group.
Anomic suicide is of particular relevance. This type of suicide defined by Durkheim, is related to large-scale societal crises of economic or political nature, often occurring during times of rapid social change and turbulence. Social control and norms (e.g. the regulatory function of integration) waning, the rapid change serves to deregulate values, beliefs and general norms and fails to rein in or guide individual aspirations (Turner & Noh 1983).
Today crises in Russia and Eastern Europe might be classical situations leading to anomic suicide. Durkheim illustrates suicide is triggered by the erosion of society's capacity for integration.
Following the tipping point of the third Kondratiev cycle, anomie, probably the greatest sociological innovation of the 19thcentury, came to the forefront anew. The Great Depression prompted a more precise description and definition of the concept along with the introduction of a new methodology. The most precise, if not always consistently used, definition of anomie provided by Merton refers to “a literal demoralization, i.e., a deinstitutionalization, of the means” that is the consequence of a dissociation between cultural goals and institutional norms (Merton 1968, p. 190). Anomie has often been believed to refer
to a general imbalance between cultural goals and the legitimate ways to achieve those goals. That is clearly not the case, for Merton’s concept of anomie refers to “a specific imbalance where cultural goals are overemphasized at the expense of institutionalized means” (Orrù 1987, 122). In his attempt to renew the concept, he distinguishes between simple and acute anomie, the former being a general imbalance, the latter being “acute anomie, to the deterioration and, at the extreme, the disintegration of value-systems, which results in marked anxieties. “(Merton 1968 217 Garzia 1948) Further on, he explains that anomie can have various levels of intensity, and of different types.
Consistent with the Theory of action of Parsons and Bales (Parsons et al.
1953) he points out that deviant action can have four distinct directions generating the four archetypes of anomie described in the Continuities in the theory of social structure and anomie (Merton 1968). The actor’s active or passive role in either the alienation from the normative pattern, or the commitment to the normative pattern or to change are depicted below:
Table 4.3.1 Parsons’ typology55
the alienative side, the side of compulsive conformity
Aggressiveness compulsive performance
Withdrawal compulsive acceptance
Source: authors based Parsons and Bales (1953).
Consistent with Parsons’ Theory of action, Merton uses phases in US culture as an ontological framework to develop the typology of anomie.
He investigates the relationship of success as a central notion to US culture along with its institutional and changing norms, and he focuses on success in terms of an aim to be achieved and a path to reach it,
55 In the words of Parsons and Bales, "Deviance was shown to involve four basic directions, according to whether the need to express alienation from the normative pattern – including the repudiation of attachment to alter as an object – or to maintain compulsive conformity with the normative pattern and attachment to alter, and according to whether the mode of action was actively or passively inclined. This yielded four directional types, those of aggressiveness and withdrawal on the alienative side, and of compulsive performance and compulsive acceptance, on the side of compulsive conformity. It was furthermore shown that this paradigm, independently derived, is essentially the same as that previously put forward by Merton for the analysis of social structure and anomie." (Parsons et al., (1953)Working Papers, 68.
embedded in available institutional framework. Two critical phases in time are included in his work: the aftermath of the Civil War How to become rich? (quoted by Merton) giving birth to the American dream and the Great Depression and its aftermath.
Analysing the first phase, he points out the contradiction in the parallel validity of the value system of ‘Work ! and work makes you a man ! ‘ (quoted by Merton) and “…the greatest barons were robber barons, men who made their way by corrupting legislatures, appropriating resources, organizing monopolies, and crushing competitors.” (Merton 1968, 223)562 Opposing values (morals and immorality) of the terminal value system of the society are in contrast with the opportunities and societal realities. “The disjunction between accepted norms and opportunities for socially rewarded conformity to these norms ‘exerts pressure’ for deviant behavior and produces anomie.” (Merton 1968, 230)
At the same time, if institutional practice is rejected but cultural aims are invariably maintained, then – in order to achieve institutionalized goals, non-institutionalized means are deployed, for instance white-collar crime, or the frequency of organized crime can increase – like in the aftermath of the Great Depression. Merton points it out that “…this theory does not maintain that the resulting deviant behavior is rationally calculated and utilitarian. Instead, it centers on the acute pressures created by the discrepancy between culturally induced goals and socially structured opportunities.”(Merton 1968, 232)
This innovation attitude is observed during significant societal transformations – coincidental with phases around tipping points of economic depression and more specifically, with their aftermath. Merton, describing the ‘gangster’ attitude exuding an air of negativism, and destructive behavior, aiming at the goal meanwhile rejecting instruments leading there, in reality establishes the first archetype of anomie.
Parallelism with Eastern Europe is not difficult to point out: in the legal and moral chaos following the collapse of communism, white-collar crime (tax evasion, property acquisition by unlawful ways and fraud), together with ’subsistence crime’ flourished and were not actively
56 Acknowledging a striking parallelism, any reader from Eastern Europe could believe that his region following the transformation of the socio-political system in 1990 and the subsequent wild capitalism and privatization are described by Merton. The only condition not valid for the region in the era of post- communism is the value system of Work!
investigated by authorities – consistent with the permissive attitude of ruling governments.57
In periods of crises intermittent phases of status- and role transformation can be detected; individuals, yet bound by institutional norms can give up their terminal values. This is what Merton calls ritualism, the second archetype of anomie (Merton 1968, 238). “As located in the typology, ritualism refers to a pattern of response in which culturally defined aspirations are abandoned while "one continues to abide almost compulsively by institutional norms. ‘As was said when this concept was introduced, ‘it is something of a terminological quibble to ask whether this represents genuinely deviant behavior.” (Merton 1968, 238)
Bureaucratic virtuosos are seen as champions of excessive adaptive and concessional behavior, that can, in extreme cases ’develop’ a workaholic pathological behavior. According to Merton, driven by status anxiety, they are characterized by obsessive repetitive and stereotypical behavior patterns, experience eviction, excessively ’good’ form. Transformation in Eastern Europe has developed its bureaucratic virtuoso archetype, recklessly struggling for the remaining workplaces and constructing their careers tooth and nail, enforcing their rights over others’ backs and thus negating values of older generations instrumental in generating cohesion and solidarity.
Generation Y58 which actually happens to be the first generation educated and socialised in a society newly liberated from the socialist norm behind the former Iron Curtain is impacted by the former effects and synergies.
Its members are ready to overshadow values in their fight for work, employment, in extreme situations to live as singles (one possible form of live) giving up family ties, and protection.
The third archetype of anomie is labeled as retreatism by Merton “The retreatist pattern consists of the substantial abandoning both of the once- esteemed cultural goals and of institutionalized practices directed toward those goals.” (Merton 1968, 241)
Retreatism is triggered by acute anomie which may occur in times of both depression and prosperity. Merton mentions the example of
57 http://www.polgariszemle.hu/app/interface.php?view=v_article&ID=318&
page= 0 / Póczik Szilveszter: szegénység, BĦnözés, Megélehtési bĦnözés, Polgári Szemle, 2009. 5. Évf. 2. Sz.
58 Jean M. Twenge (2006) Why Today's Young Americans Are More Confident, Assertive, Entitled--and More Miserable Than Ever Before. Simon and Schuster.
widowhood where both sloth and torpor can overwhelm one’s behavior.
The same apathy can seize people freshly entering unanticipated pension and disrupted from their daily routine.59
Apathy as a topic is often used in fiction: Camus in his work entitled L’Étranger (1942) uses absurd as an approach. Retreatism, the most conspicuous type of anomie can be detected in the socio-graphic experiment of Marienthalnear Vienna, where apathy takes the shape of a drained community with its members retreating into their dwellings, relinquishing travel and socializing.
Public spaces and parks are abandoned, institutions are not supported – thus compelled to shut down, visits to public institutions (library and social circles) and membership decreases even if they are free. Long-term pensioners, despite the higher price of tabloids choose to subscribe to them and not to the cheaper daily papers with more substantial and meaningful content. Political parties are gradually abandoned, and the number of unsubstantiated prosecutions increases, etc. (Jahoda &
Lazarsfeld & Zeisel 1975).
Marienthal is the perfect precursor of the rust belts developing after 1990 and of the communities living or subsiding on the ruins of socialist heavy industries.
Symptoms recorded in the middle of the 1930’s, although not referring to the notion of anomie, coincide with retreatism as defined by Merton.
Individuals, absorbed by vacuum are tossed around, thus becoming preys of political totalitarianism.
Merton has reservations about the metric experiment designed by his contemporary, Bernard Lander, attempting to define a measure of anomie from the point of view of objective living conditions. According to Lander (1954), the increase in the level of anomie in a given territorial unit is proportional to the increase of crime rate, the rate of Afro- Americans and Hispano- Americans in the population, and the low rate of residential ownership.
However, the Marienthal experiment of Lazarsfeld and collaborators, offers a better starting point for the composition of an indicator of anomie based on objective variables. This indicator could be used a measure of comparing varying levels of retreatism-type anomie. For instance, in Hungary, in regions still not recovering from employment crisis lasting
59 See the movie entitled About Smith with Jack Nicholson playing this role.
for nearly a quarter of a decade, owing to the modifications in the timetables of public transportation, the coach and train services have dramatically dropped. Institutions had to shut down due to aging populations, former migration and low income levels (Bódi & Fekete 2012). Gardens and orchards are not being cultivated, yet there are 200,000 hectares of them available in the country.60
Civil institutions are more present and active in more developed regions and settlements than in underdeveloped ones.61 In Hungarian settlements with long-term low level of employment and income, participation at the parliamentary elections is lower than the national average (Bódi, F. &
Bódi, M. 2012). Measurement of the territorial differences in the retreatism-type anomie will be the topic of a later study.
Former archetypes of anomie have been defined in function of the relationship between the institutional norms; however, individual groups of society may have varying norms, furthermore, these norms are bound to change, giving birth to new norms that can subsequently become dominant. Values greatly appreciated in the past can become devalued.
Cf. the topic of Don Quixote, the decline of the value system of former periods, or the absurd approach of the topic in Dürrenmatt’s Romulus der Große (1950). Merton relies on Elinor Barber’s The Bourgeoisie in 18th Century France (1955) when he introduces the archetype of rebellion anomie. “When rebellion becomes endemic in a substantial part of the society, it provides a potential for revolution, which reshapes both the normative and the social structure. It is in this connection that a recent study of the changing role of the bourgeoisie in eighteenth century France significantly extends the present theory of anomie.” (Merton 1968, 244)
When discrepancy between mobility expectations and factual mobility is too wide, we face a state of anomie – says the author – and effective mobility is not accompanied by moral approval (Barber 1955). In reality, in this case, change in class and order structure is not organic, the principle of conservation cum elimination is not effective, meaning that the emerging individuals are despised, considered as opportunistic by their peers, on the other hand, emerging individuals despise those remaining in lower ranks.
60 http://mno.hu/mezogazdasag/fazekas-ez-a-magyar-agrarium-aranytartaleka- 1144491
61 http://civil.info.hu/nyilvantartas
Rebellion-type anomie can prevail in a time dimension, that is, the dichotomy of old and new, and also in space. Dual living presence prevail in space (Castells 1991), where terminal values friction and clash.
In metropolises created by globalization parallel living presence came to existence, specifically owing to immigration, the modern-time migration.
By the same token, parallel living presence of the drifting and depressed- emerging regions are organic consequences of the complex crisis following the collapse of communism in Eastern Europe. In regions with long-term low employment levels, including rural living presents, we can observe the formation of ghettoes (Kovács & Váradi 2013) and enclave societies the escape from which is nearly or wholly impossible (Gazsó 2008). Societal and regional discrepancies triggered by the crisis are sustained and continue to have an impact (theory of Kuznets-Williamson gap 1966)
In drifting regions, where children cannot see their parents going to work on a regular basis, managing genuine property, everyday life is restricted to black work, allowance benefits and a certain degree of “collection”.
Family and friend celebrations are organized for children not in the event of their graduation from secondary school, not that they have high chances of doing so, but when they return from their first preliminary arrest or served prison sentence.
In these enclave communities new regulating norms become dominant and they start to gnaw away basic norms of society. Family as an integrating institution alienates from the measures safeguarding societal order, yet a more restricted community keeps its members in a bubble, who so have weak chances of breaking free using their own means.
Supporting institutions, kindergarten, school, family caregivers, health caregivers and church, as outsiders to this world, cannot address these issues as they don’t use the same means of communication.
Significant development of spatial informatics of the past decades made it possible for us to have access to data relating to a given spatial unit in a given time. The use of such methods is pointedly required today in the Eastern part of the former Iron curtain following the EU-accession Concomitantly, a series of health sociology reports have been published, confirming relevant relationship between death and deprivation, and exploring connection between phenomena independently observed before (Juhász et al. 2010). Durkheim’s hypotheses have been confirmed on various points. “Durkheim's theories related not only to the patterning of
suicide but easily extend to other major outcomes ranging from violence and homicides to cardiovascular disease.”(Berkman et al. 2000)
In the following, we attempt to demonstrate regional discrepancies and to delineate areas suggesting the prevalence of a peculiar type of dual living presents. Wherever societal integration is weak, and social capacity is low, a conglomerate of symptoms of anomie will be found.
Overview of indices and composite indicators depicting social phenomena
In social sciences, the condition of individual observation units, their degree of complexity and development trends are defined by indicators, or in the case of more complex phenomena, by composite indices. The latter, consistent with the object of observation, using joint application of the values of the diverse indicators by mathematical-statistical methods, describe various aspects of the given phenomena. Among the most widely known complex indicators are the Bennett- indicator, the human development and other deprivation indices.
The composite Bennett-indicator comprises settlement characteristics such as accessibility, development, competitiveness, or degree of urbanization. The composite indicator is calculated by comparison to the given indicators’ maximum value, thus values of the individual test units are defined as percentage of these maxima. The per cent aggregation results in the final indicators value.
Human Development Index (HDI), introduced in 1992 by the United Nations Development Program, is the basis of the annual Human Development Reports. HDI, a composite statistic, having the objective of capturing the full complexity of human capabilities is calculated taking into account three dimensions:
• A long and healthy life: Life expectancy at birth
• Education index: Mean years of schooling and Expected years of schooling
• A decent standard of living: GNI per capita (PPP US$)
The three autonomous dimensions are used to calculate the HDI composite statistic. At its origin, HDI was considered to be a revolutionary statistic, but some serious criticism has been worded considering both the methodology and the basic indicators.
The immediate predecessor of our social capacity index described in this piece has been the deprivation index as elaborated by Juhász and his research team (Juhász et al., 2010). In the course of the past decades, researchers of the topic have developed a number of complex indicators differing in some of their details (Jarman, 1983; Towshend 1987; Spéder, 2002; Kapitány and Spéder 2004). The Hungarian research team has been able to bring fresh results in the selection of indicators by considering fundamental characteristics of Hungarian society. Thus, the constituents of the index include the rate of large families (in Hungary three children or more than three children in a family) rate of single parent families, since, data provided by the Hungarian Bureau of Statistics indicate that these families are liable to a higher risk of poverty.
The objective for creating the social capacity index
The objective of creating this composite indicator is to assess the capacity of local society as a reliable local resource when allocating various regional development programs. We consider local society to be a local resource that can substantially contribute to the success of regional or rural development in any given settlement or region. Hence the importance of describing its condition before the commencement of a planning or development cycle. Development requires – beyond environmental and economic resources - the availability of societal resources, since the combination of these resources predict the effectiveness of setting realistic strategic objectives and the of the right development methodology. Therefore, when composing our composite index, we strive to assemble that grasp and describe population characteristics: physical and mental health, economic status, well-being and relationship with the world of working.
Description of the constituent indicators of the index
At this stage of research design, municipal level has been defined as the test unit. Consequently, we had to face the difficulty of some of the selected indicators not qualifying as stabile enough for mathematical- statistical purposes (e.g.: early mortality risk) on the level of territorial test units. Therefore it has been decided that whenever possible, a single relevant indicator will be integrated into the index using aggregate data of three years (2009-2011). However, this solution has not been always workable because of the shift in the range of data collection (the number of the recipients of social allowances, owing to regulatory change cannot
be retrospectively calculated over several years), or because of missing data (in the case of criminals). (Differences are shown at the individual indices.)
1. Proportion of convicted criminals (by residence) to the ratio of taxpayers averaged over 3 years (2008, 2009, and 2011) – indicators describing the moral condition of the society.
2. (Annuitants) Proportion of recipients of social allowances compared to the number of taxpayers in the year 2011. This indicator is an aggregate indicator in itself, deployed on the basis of the results of (Bódi &Fekete & Bódi 2012) (Bódi 2012), and comprising the following constituents: number of recipients of regular social allowances, registered unemployed in search of work, number of recipients of old age pension, and the recipients of disabled and rehabilitation allowances. This indicator’s objective is to assess the proportion of those in need of allowances in any given municipality.
3. Income per taxpayer in the average range of 3 years – representing economic wealth.
4. Proportion of taxpayers as a percentage of the population aged 18- 59, in the average range of 3 years, representing the number of active population having work wages.
5. Change in population between 2009-2011 as an indicator representing increase, stagnation or decrease of the population as a resource.
6. Number of abortions as a percentage of women of child-bearing age, in the average range of 3 years, representing the mood and optimistic future orientation of the society.
7. Risk of early mortality in the average range of 3 years, as an indicator representing damage (economic and social) caused by inefficient (or lack of appropriate health care and health educated) healthcare – furthermore, there is a significant correlation to certain poverty-related illnesses, such as cardiovascular illnesses.
Methodology of composing the composite index
Methodology has been following the formulation of the deprivation index as developed by Juhász, Nagy, Páldy and Beale (Juhász et al., 2010).
Standardization and aggregation of the individual indicators, as
constituents of the composite index, has been implemented in the following way: Indicator values of the individual territorial units (X) have been compared to their arithmetic mean (A) and divided by standard deviation (S). This calculation is expressed by the formula below:
= ( í )/
For indicator 3 (per capita income), indicator 4 (percent of tax-payers) and indicator 5 (population change) the formula is modified as per below:
= ( í )/
Furthermore, Z values of the indicators standing for individual territorial units have been
aggregated, resulting in the value of social capacity index. Mathematical and statistical weighing of the indicators, as well as expert weights has been omitted at this time.
Explaining the social capacity index
The social capacity index can be interpreted as follows: the higher the Z value in any given territorial unit, the higher the complexity and number of societal-social problems to be found. Lower Z values signify more favorable societal-social status.
East-West slope
Before the discussion of the spatial differences of the above indicators, it would be useful to consider the position of Hungary within Central Europe from a wider perspective. Although for Hungarians it seems obvious that there are some measurable discrepancies between the quality of living in Transdanubia in the Western part of the country and the Great Plain in the East, it seems less obvious that discrepancies do not originate in the breakdown of the employment structure of the aftermath of 1990.
Browsing through the Atlas of Central Europe of András Róna (1945), particularly the pages showing quality of life indicators, one can realize that there is a step, a fissure dividing the country in an East-West direction.
In the respective period, Illiteracy rate in Transdanubia and in Central Hungaryis 0-10 %, but in the Great Plain and in Northern Hungary it is 10-20 %, except in the larger towns (e.g. Debrecen and Szeged), and in
the further East (Transylvania, Eastern Balkans) the picture based on data registered in the beginning of the 1930’s is gloomier (Róna 1945, 184-186).
Death rate in Northern Hungary andTransdanubia, along with Central Hungary and between Danube and Tisa, is 14-16 ‰, but in the further East it is 16-18 ‰, followed by Northern Great Plain, where it attains more than 18 ‰, based on 5-10 years average around 1930 (Róna 1945, 196-197).
Infant mortality (based on 5 years in the middle of the 1930’s), in Central Transdanubia, along the Austrian border is below 12 % (not an error, factually percentage), but in the Trans-Tisa, along the Rumanian border it is 16 % (Róna 1945, 202-203).
Despite the dramatically changed life conditions of the Central European population in the past 8 decades, the East-West slope continues to prevail.
Social Capacity Indicators
In the following section indicators will be examined by local municipalities, amounting to 3142 in the territory of Hungary, excluding Budapest, as the unique municipality of the size of a metropolis. Each municipality was allocated a Z-value for each indicator, and the values have been ranked and divided into 5 equal parts consisting of equal number of constituents (628-629 items). Z-values divided into quintiles were represented on a map comprising administrative boundaries.
Municipalities with near-median values are ranged in the middle quintile and marked with yellow, and the upper quintiles contain municipalities marked with red and orange. Most disadvantaged local municipalities in green are found in the two lower quintiles
Municipalities in the upper quintiles of the map illustration on criminals index are to be found more frequently in regions of Northern Hungary and Northern Great Plain, notably in Szabolcs- Szatmár-Bereg county adjacent to the Ukrainian border (Appendix, map figure 4.3.1.).
Moreover, high criminals index municipalities are situated in Southern Transdanubia, and those along the Austrian border tend to belong to the lower quintiles. In the upper ranges, municipalities are found more frequently in the internal peripheral, along the county borders. Although the range values of the two upper quintiles are rather high, yet when observing municipalities in red, we can see that the adjacent
municipalities are in orange or yellow, meaning that they gradually blend into networks of ‘green’ municipalities. This signifies that the spatial situation of inhabitants clashing with the societal norms is not entirely random; therefore the inclusion of criminals index into the composition of the index seems justified.
Municipalities of the lower quintiles of the map illustration on annuitants index are distributed into three regions: Western Transdanubia, regions adjacent to Austria, Central Transdanubia regions adjacent to Western Slovakia, the belt around Budapest,additionally, the Central Hungary Region (Appendix map figure 4.3.2.). It is in this area, the size of one third of the total territory of Hungary that the majority of GDP is produced. Newly established automotive and electronic industries are found along this modern industrial axis, or mega region, its terminal points being Budapestand Vienna, respectively.
In the past twenty years, the greatest investments of reindustrialization involved attracting significant workforce of Hungarian ethnic minority from Western Slovakia. Concomitantly, a large number of inhabitants are currently employed as commuter workers in nearby Austria or as immigrant workers in German-speaking parts of Western Europe.
German is generally spoken in the region as during the Iron Curtain period German language television and radio programs were broadcasted in the Western part of the entire Transdanubia.
Accordingly, annuitants’ rate (benefiting from pension-type allowance, yet not reaching the pension age limit) in this mega region, in proportion to the taxpayers is significantly low, resulting in a relatively high rate of employment62, and education rate is popping out compared to the other regions. It is believed to be a sign of optimism that this “green banana”
zone has a tendency to expand to the South-East, crossing Kecskemét (Mercedes investment) reaching towards Szeged, its university center being the national fortress of biotechnology. The other expansion direction is Debrecen, and its surroundings to the West, in the Hajdúság63,with the largest rural university and the national fortress of nuclear research.
62 http://www.ksh.hu/docs/hun/xstadat/xstadat_hosszu/h_qlf009a.html
63 Hajdúság has been as an ethnography area since early 16th century between Debrecen and Tisa river which existed as an independent administrative unite till end of 19th century.
Municipalities of the map figure on income index (Appendix map figure 4.3.3) are distributed into a similar pattern. The index comprising of income per taxpayer depicts a less coherent mega region, however, the municipality structure of the country, and the orange and yellow municipalities of the Western Transdanubia, designate municipalities sparsely inhabited by old- age pensioners, not paying income taxes.
Adversely to this green region, we can find the regions of Northern Great Plain and Northern Hungary, adjacent to remoter Eastern Slovakia and Ukraine. Owing to the presence of the Roma communities, a large number of rejuvenating villages are located there. Their economic activity being rather low, they do not pay taxes or just barely. Out of the red and orange regions, Debrecen, Nyíregyháza andMickolccities stand out, each with entrepreneurs and public sector as significant employers.
Southern Transdanubia is colored the same, with the county seats standing out with their deep green color.
Colored map illustration on taxpayer index is congruent with the previous two, the only significant difference being that the big green mega region (green banana does not stretch across the Danube (Appendix map figure 4.3.4.). The Central Hungary Region is not joined with GyĘr- Moson-Sopron County, referred to as the flagship region of Transdanubia, or with the adjacent, more active counties. Adversely, the index of income and annuitants is promising, one of the probable explanations being that many of the active age adults attend tertiary education in full time. These individuals in a post-adolescence stage of late twenties, remain with their parents (mama hotel), do not have own families, and do not generate independent, taxable income, yet do not live on unemployment allowances either; when they finally become independent, continue to be strained with their lives of singles. This life situation is typical with families having significantly higher than average income.
Societal distribution of labor is a very important integrating factor, described by the previous three indices, each of which can create a coherent spatial pattern from the mosaic of municipalities on the country’s map. It can be undoubtedly declared that they stand as constituents of the social capacity index to be created. In Hungary, acute population decrease was on the agenda as early as in the 1960’s (Bódi &
Bódi 2012), but following the collapse of the socialist system, it has recently emerged as a political agenda-setting topic, and endeavors have been made to prevent further escalation. The results are yet to be assessed. Demographic crisis has been widening since the 1980’s;
according to the KSH – Hungarian Central Statistical Office, while the total population decrease of the country was 737,000 (between 1981 and 2011), the balance of migration amounted to 363,000 (between 1988- 2009).The main reason of population decrease is natural loss, which, without the uninterrupted influx of Hungarian ethnic populations from across the borders, would have reached 1 million. At the same time, there are settlements with increasing population by means of immigration and natural growth, and they can be found in the Budapestagglomeration, in the Great Plain, surrounding Debrecen the Hajdúság, and these small villages are included in the upper two quintiles (Appendix map figure 4.3.5.). Probably, the population change index is the weakest element of the social capacity index from methodological point of view and need further elaboration.
We have assumedly arrived to the most dubious index, the abortion index, which, in Eastern European research environments used to be a taboo subject for many years, and its agenda-setting systematically avoided, following the collapse of socialism. This topic was at the origin of a schism between the researchers, at least in Hungary. Yet it is essential to reflect upon facts. In 1990, there were 90,400 abortions, meaning a rate of 71.9 over one hundred births. At the millennium, the number decreased to 56400, but the rate still remained high, 58.1 per one hundred births.
Subsequently, abortion rate decreased to 38400 in 2007, maintaining a high proportion on births: (46.4). As a means of comparison, in the same year, the surrounding countries had the following rates: Austria 22.1, Slovakia 27.2, Slovenia 26.3, Czech 20.6.64 Abortion rate was higher only in the Eastern neighboring countries: Romania 46.9 and Ukraine 40.4.65
Spatial distribution of abortion is varied and extreme, making it impossible for us to provide birth-related proportional distribution. In numerous settlements, abortions exceeded births,
therefore we chose to compare them with heads of women in birth-giving age. This is represented by the map figure (Appendix 4.3.6) entitled
64 Kamarás Ferenc – Terhességmegszakítások Magyarországon – http://www.tarki.hu/adatbank- h/nok/szerepvalt/Kamaras-99.html
65 Percentage of Pregnancies Aborted by Country, compiled by Wm. Robert Johnston, 21 February 2007
http://www.johnstonsarchive.net/policy/abortion/wrjp333pd.html
abortion index, with a wide range of legends. Red and orange of the upper two quintiles mark settlements of Northern Hungary and Southern Transdanubia, and those along the Ukrainian and Rumanian border in Northern Great Plain. A more promising picture is discerned in Western- and Central Transdanubia, with the remaining indicators being equally positive.
The creation of premature mortality index is the outcome of the research done by Juhász and Nagy (Juhász et al. 2010), demonstrating the relationship between deprivation and cardiovascular mortality, along with dependencies such as smoking, sedentary lifestyle and education attainment in spatial patterns in Hungary. Map figure (Appendix 4.3.7.) displays evidence of the settlements of Northern Great Plain, Northern Hungary and Southern Transdanubia, excluding big towns and their agglomerations, which are included in the two upper quintiles. Western- and Central Transdanubia, and the Central Hungary Region, except for the inner peripheries discernible along the county borders constitute a coherent, quasi-unified mega-region and allow for a more optimistic picture.
For each of the indices, natural indicators have been used to draw the country maps, and these maps displayed the same patterns as the ones using Z-values. Many of these maps have been published (Bódi et al.
2012) and used for the purposes of previous research. One of the aims of the present work has been to establish a main index assembling independent anomic phenomena observed (criminality, rejection of the order of societal structure of division of labor, rejection of life as a value). Notwithstanding, this is not the final anomie index connected to various elements of the crisis cycle, but the social capacity index requiring further elaboration and precision. It is posited that this index will be instrumental in localizing the existence of parallel living presents and rebellion anomie of norm ghettoes opposing to the totality of the local communities, together with regions where a significant segment of the local communities live in apathy, rejecting cultural aims and institutional norms (retreatism anomie).
Interpreting the Social Capacity index
Map illustration of the social capacity index (Appendix map figure 4.3.8.) exhibits the quintiles on the basis of Z-values of individual settlements. Overall range is wide: 52.4, with minimum and maximum range in the lowest quintile being -16.3 and -3.19; respectively. It is
expected that local communities in this range are rather stable and the phenomena of disintegration of the society are scarce. Members of the lowest quintile do not constitute the totality of a region, these dark green patches signify larger, industrially developed, university towns (knowledge centers), and their wider agglomeration circles, such as:
GyĘr, Sopron, Szombathely, Veszprem, Székesfehérvár. They are the most successful towns of the past 30 years, many of them having had mercantilist local policies already in the socialist period, with carefully planned capital attraction, education- and industry development plans also in place.
Most of the settlements of GyĘr-Moson-Sopron County, located in the North-Western corner of Hungary, in the proximity of Vienna and Bratislava, are comprised in this most promising lower quintiles.
Successful towns are networked by pale green settlements, all comprised in the second ’lower quintiles’, in a somewhat narrow range (-3.18 – 1.00). Both of the green fields are connected by an axis between the Southern shore of Lake Balaton (standing out as a successful agglomeration) and Budapest. In the East of Budapest, Kecskemét, Szeged and Debrecen and their agglomerations emerge from the field.
Antipodal to the above two lower quintiles stand the red (min. max.:4.03- 36.1) together with orange (min. max.: 1.17-4.02) settlements, networking into a coherent field in regions of Northern Hungary, Northern Great Plain and Southern Transdanubia, sporadically broken by the green hue of the county seats and significant educational towns (Gyöngyös, Sárospatak).
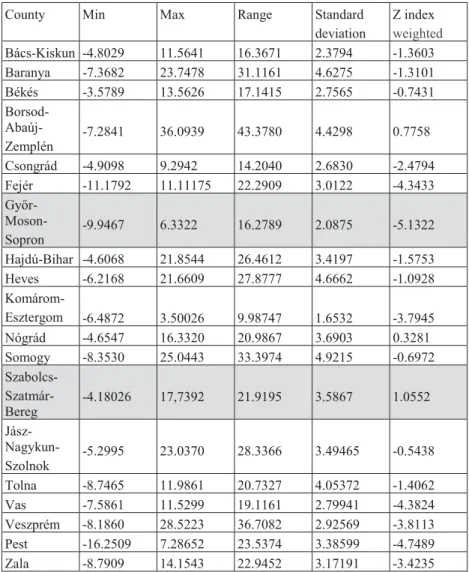
Considering the 19 counties of the country, calculating the settlement average of the social capacity index weighted by population for each county, the following Z-values are obtained:
Table 4.3.2 Social capacity index by weighted Z index in 19 counties in Hungary.
County Min Max Range Standard
deviation
Z index weighted Bács-Kiskun -4.8029 11.5641 16.3671 2.3794 -1.3603 Baranya -7.3682 23.7478 31.1161 4.6275 -1.3101
Békés -3.5789 13.5626 17.1415 2.7565 -0.7431
Borsod- Abaúj- Zemplén
-7.2841 36.0939 43.3780 4.4298 0.7758
Csongrád -4.9098 9.2942 14.2040 2.6830 -2.4794
Fejér -11.1792 11.11175 22.2909 3.0122 -4.3433
GyĘr- Moson- Sopron
-9.9467 6.3322 16.2789 2.0875 -5.1322 Hajdú-Bihar -4.6068 21.8544 26.4612 3.4197 -1.5753
Heves -6.2168 21.6609 27.8777 4.6662 -1.0928
Komárom-
Esztergom -6.4872 3.50026 9.98747 1.6532 -3.7945 Nógrád -4.6547 16.3320 20.9867 3.6903 0.3281 Somogy -8.3530 25.0443 33.3974 4.9215 -0.6972 Szabolcs-
Szatmár- Bereg
-4.18026 17,7392 21.9195 3.5867 1.0552 Jász-
Nagykun- Szolnok
-5.2995 23.0370 28.3366 3.49465 -0.5438
Tolna -8.7465 11.9861 20.7327 4.05372 -1.4062
Vas -7.5861 11.5299 19.1161 2.79941 -4.3824
Veszprém -8.1860 28.5223 36.7082 2.92569 -3.8113
Pest -16.2509 7.28652 23.5374 3.38599 -4.7489
Zala -8.7909 14.1543 22.9452 3.17191 -3.4235
Source: calculation of the authors, based on TeIR database “National Spatial Development and Spatial Information System”
Counties having high social capacity Z-value will have equally high range, predicting significant discrepancies between the settlement values within the same county. In the most promising county, GyĘr-Sopron- Moson, the weighted Z-value for the county is -5.13; but in the least
promisingSzabolcs-Szatmár-Bereg County it is +1.05; with low range in the former and high range in the latter.
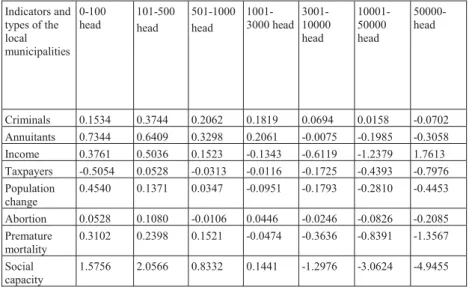
Territorial variations as displayed on the map figure (Appendix 4.3.8) can be explained by other reasons than just regional impacts, it seems therefore reasonable to observe weighted Z-values of each indicators by settlement types (inhabitants) as well. Z-values of indicators drop dramatically towards settlements with more inhabitants, meaning that although settlement size is a predictor, its effect is not exclusive. In the Western Transdanubia Region there are several local governments of less inhabitants, typically along the border, belonging to the upper quintiles.
On the other hand, the settlements of this size typically in the Southern Transdanubia and Northern Hungary, stretching across areas of county size, belong to the upper quintiles.
Table 4.3.3 Indicators and Social Capacity index in the types of the local municipalities in Hungary.
Indicators and types of the local municipalities
0-100 head
101-500 head
501-1000 head
1001- 3000 head
3001- 10000 head
10001- 50000 head
50000- head
Criminals 0.1534 0.3744 0.2062 0.1819 0.0694 0.0158 -0.0702 Annuitants 0.7344 0.6409 0.3298 0.2061 -0.0075 -0.1985 -0.3058 Income 0.3761 0.5036 0.1523 -0.1343 -0.6119 -1.2379 1.7613 Taxpayers -0.5054 0.0528 -0.0313 -0.0116 -0.1725 -0.4393 -0.7976 Population
change
0.4540 0.1371 0.0347 -0.0951 -0.1793 -0.2810 -0.4453 Abortion 0.0528 0.1080 -0.0106 0.0446 -0.0246 -0.0826 -0.2085 Premature
mortality
0.3102 0.2398 0.1521 -0.0474 -0.3636 -0.8391 -1.3567 Social
capacity
1.5756 2.0566 0.8332 0.1441 -1.2976 -3.0624 -4.9455 Source: calculation of the authors. TeIR database “National Spatial Development and Spatial Information System” calculated with the average (inhabitants) of the given local municipality category.
Regional economic structural research, using the Bennett method, carried out by Matolcsy, Csizmadia & Csordás (2007) provide encouragement to our efforts in further elaboration and precision of the social capacity index. These authors grasped spatial structure of the economy and the society by involving variables such as migration, spatial distribution of
personal income tax, entrepreneurial activity, per capita foreign direct investment, prevalence of knowledge bases, spatial impact of highways, accessibility, unemployment, thermal tourism and EU-funds allocation data.
Peculiarly, despite our aim and methods being entirely different, our research deploying the social capacity index (SCI) resulted in a similar set of regional formations as the above approach (Appendix map figure 4.3.8.).
In their research article entitled Spatial geomodels of Hungary the authors define a Western Hungarian modernization line, which is also present in our model along the Austrian border. Balaton region, together with Danube innovation axis (a deep green corridor along the GyĘr Budapest axis) and the Southern- Danube ancillary between Budapest andPécs, each colored with a deep green hue, are present in both models.
Further to the above, the Central Hungary belt can also be observed on the map illustration (the deep green hue of the Budapest agglomeration embraced by a lighter green ring). The North-Eastern Hungary wall, established by the article can also be found on the SCI-map, adjacent to the Rumanian-Ukrainian and Eastern Slovakian borders. Areas assessed as depressed by the regional economists are also found on the SCI-map and their innovative and modernization areas are categorized as stable from the point of view of societal norms on the SCI-map.
The methods deployed in the research need further elaboration and precision, as mentioned before. This research has been a first step, an experiment in the process of reinterpreting classic theories ranging from Max Weber’s Protestant ethics (1905) to Peter Sir Bauer’s work (1991).
Economy, and its crisis symptoms cannot be interpreted without understanding the ethos and moral attitudes of the working, economically active man. It is not our aim to envelope the latter into figures and formulas, but to establish a framework of investigation serving the optimization of socio-economic modeling both in space and time.
Hopefully, we have made the first steps on this path.
References
Barber, E.G. (1955) The Bourgeoisie in 18th Century France. Princeton.
Bauer, P. (1991) The Development Frontier: Essays in Applied Economics.
Harvester Wheatsheaf
Berkman, L.F. & Glass, T. & Brissette, I. & Seeman T. E. (2000) From social integration to health: Durkheim in the new millennium Social Science &
Medicine, Volume 51, Issue 6, Pages 843-857
Bódi, F. (2012) The elements of the complex crisis, and its influences on the rural societies – historical background of disadvantageous situation In (eds) Bódi, F.
& Fábián, G. & Lawson, R. T (2012) Local Organization of Social Services in Hungary (Crises – Reactions – Changes) Europäischer Hochschulverlag GmbH
& Co. KG, Bremen, pp129-145
Bódi, F. & Bódi, M. (2012) The degrease of the population, the vicious circle of poverty and development model In (eds) Bódi, F. & Fábián, G. & Lawson, R. T (2012) Local Organization of Social Services in Hungary (Crises – Reactions – Changes) Europäischer Hochschulverlag GmbH & Co. KG, Bremen, pp. 41-58 Bódi, F. & Bódi, M. (2012) Where are the voters? In (eds) Bódi, F. & Fábián, G. &
Lawson, R. T (2012) Local Organization of Social Services in Hungary (Crises – Reactions – Changes) Europäischer Hochschulverlag GmbH & Co. KG, Bremen, pp 59-77
Bódi, F. & Fekete, A. (2012) Changes in supply and demand in elementary education 1988-2009. In (eds) Bódi, F. & Fábián, G. & Lawson, R. T (2012) Local Organization of Social Services in Hungary (Crises – Reactions – Changes) Europäischer Hochschulverlag GmbH & Co. KG, Bremen, pp 268-287 Bódi, F. & Horváth, Zs. (2012) Shadows and ghosts in rural welfare system. In (eds)
Bódi, F. & Fábián, G. & Lawson, R. T (2012) Local Organization of Social Services in Hungary (Crises – Reactions – Changes) Europäischer Hochschulverlag GmbH & Co. KG, Bremen, pp 147-162
Bódi, F. & Bódi, D. & Fekete, A. & Bódi, M (2012) Annex (maps, figure, tables) .In (eds) Bódi, F. & Fábián, G. & Lawson, R. T (2012) Local Organization of Social Services in Hungary (Crises – Reactions – Changes) Europäischer Hochschulverlag GmbH & Co. KG, Bremen, pp 426-476
Castells, M. (1991) Die zweigeteilte Stadt. In Die Welt der Stadt. (et. Schabert, T.) München pp. 199-217
Durkheim, É. (1982) Az öngyilkosság. (La Suicide). Közgazdasági és Jogi Könyvkiadó. Budapest
Fónai, M – Fábián, G – Filepné, Nagy É – Pénzes, M (2008) Poverty, health and ethnicity: the empirical experiences of researches in Northeast-Hungary.
Review of Sociology 14: (2) 63-91
Gazsó, F. (2008) Közoktatás a zárványtársadalomban. In Bódi, F. (ed.) Helyi szociális ellátórendszer. MTA PTI, Budapest
Guyau, J.M. (1898). A Sketch of Morality Independent of Obligation or Sanction (transl. G. Kaprteyn). London: Watts. Available through Scribd (Accessed 15.10.2013)
Jahoda, M. & Lazarsfeld, P.F. & Zeisel, H. (1975) Die Arbeits-losen von Marienthal.
Ein Soziographischer Versuch über die Wirkungen Lang-andauernder Arbeitslosigkeit. Suhrkamp Verlag
Jarman, B. (1983) Identification of underprivileged areas. British Medical Journal, 28.1705- 1709
Juhász, A. & Nagy, Cs., & Páldy, A., & Beale, L. (2010) Development of
Deprivation Index and its relation to premature mortality due to diseases of the circulatory system in Hungary, 1998- 2004. Social Science & Medicine 70. pp.
1342-1349
Harding, F. J. W. 1973. Jean-Marie Guyau (1854-1888). Aestheticiam and Sociologist. A Study of His Aesthetic Theory and Critical Practice. Genève:
Droz
Kapitány, B., & Spéder, Zs. (2004) Poverty and deprivation. In the trace of social contexts, the turning points of our life – workshop studies, 4. Budapest:
Hungarian Central Statistical Office, Demographic Research Institute (Available only in Hungarian)
Kondratiev, N. (1925) The Major Economic Cycles
Kopp, M. & Stauder, A. & Purebl, Gy. & Janszky, I (2007) Work stress and mental in a changing society. European Journal of Public Health, p. 1-7
Kosa Zs, Szeles G, Kardos L, Kosa K, Nemeth R, Orszagh S, Fesus G, Adany R, Voko Z. Health of the inhabitants of Roma settlements in Hungary - a comparative health survey. Am. J Public Health 2007; 97: 853-859
Kovács, K. & Váradi, M. M. (2013) Hátrányban vidéken. Argumentum. Budapest Kuznets, S.S. (1966) Modern Economic Growth, Rate, Structure and Spread. New
Haven, Conn. Yale University Press
Lander, B. (1954) Towards an Understanding of Juvenile Delinquency. New York.
Matolcsy, Gy. & Csizmadia, N. & Csordás, L. (2007) A Magyar gazdaság térszerkezeti változásai. Polgári Szemle. 3. éfv. 11. sz
Merton, R. (1968) Social Theory and Social Structure. The Free Press, New York.
Orrù, M. (1987). Weber on anomie. Sociological Forum, Vol. 4, No. 2, pp.
120-135
Parsons, T., & Bales, R.F. & Shils, E.A. (1953) Working papers in the Theory of Action In Parsons, T. The Social System. Glencoe p. 67-78
Róna András (1993) Közép-Európa Atlasz. Gróf Teleki Pál Tudományos Intézet (1945) Digitális Fakszimile Kiadás. ELTE Térképtudományi Tanszék (Klinghammer, István) Szent István Társulat – Püski Kiadó
Sebastian De Grazia, The Political Community (University of Chicago Press, 1948), 72-74, passim; cf. Brookes, op. cit., 46
Skrabski, Á. & Kopp, M. & Kawachi, I. (2003) Social Capital in changing society:
cross sectional association with middle aged female and male mortality rates.
Journal Epidemiology and Community Health, 57. 114-119
Skrabski, Á. & Kopp, M. & Rózsa, S. & Réthelyi, J. & Rahe, R. H. (2005) Life Meaning: An Important Correlate of Health in the Hungarian Population.
International Journal of Behavioral Medicine. 2005, Vol. 12, No. 2, 78-85 Spéder, Zs. (2002) Poverty: socioeconomic characteristics and demographic factors.
In Spéde, Zs. (Ed.) Demographic process and social environment. Repot (pp.
91-102) Hungarian Central Statistical Office, Demographic Research Institute (Available only in Hungarian)
Széles Gy, Vokó Z, Jenei T, Kardos L, Bajtay A, Papp E, Pásti G,Kósa Zs, Molnár I, Lun K, Ádány R. A preliminary evaluation of a health monitoring programme in Hungary. Eur. J. Public Health 2005;15:26-32
Turner, R., & Noh, S. (1983). Class and psychological vulnerability among women:
The significance of social support and personal control. J. Health Soc. Behav., 24, pp.2-15
Townsend, P. (1987) Deprivation. Journal of Social Policy, 16. 125-146 Weber, M. (1905) Die protestantische Ethik und der Geist des Kapitalismus (The
Protestant Ethic and the Spirit of Capitalism). translated by Talcott Parson (1930)
List of Contributors
Editors
Bódi,Ferenc Ph.D., senior research fellow, Centre for Social Sciences, Hungarian Academy of Sciences, Budapest, Hungary.
Fábián, Gergely Ph.D., dean, University of Debrecen, Faculty of Health, Nyíregyháza, Hungary.
Fónai, Mihály Ph.D., Head of Department, University of Debrecen, Faculty of Law, Department of Public Policy and Applied Sociology, Debrecen, Hungary.
Kurkinen, Jorma researcher, Northern Finland Centre of Excellence on Social Welfare, Master of Arts, Oulu, Finland.
Prof. Lawson, Thomas R., Ph.D., Hon. Dr., Hon. D.Sc., FUASM, Professor and Director of International Programs, Kent School of Social Work, University of Louisville, Louisville, Kentucky, USA.
Pietiläinen, Hannu Ph.D., Oulu University of Applied Sciences, School of Health and Social Care, Head of Department, Master of Social Sciences, Master of Education, Oulu, Finland.
Authors
Bódi,Ferenc Ph.D., senior research fellow, Centre for Social Sciences, Hungarian Academy of Sciences, Budapest, Hungary.
Bódi,Mátyás support specialist, GeoX, Budapest, Hungary.
CsĦrös,Gabriella Ph.D., assistant professor, University of Debrecen, Faculty of Law, Department of Financial Law and Public Management, Debrecen, Hungary.
Fábián, Gergely Ph.D., dean, University of Debrecen, Faculty of Health, Nyíregyháza, Hungary.
Farkas, JenĘ Ph.D., senior research fellow, Centre for Economic and Regional Studies, Hungarian Academy of Sciences, Grate Plain Departure, Kecskemét.
Hungary.
Fekete, Attila, research fellow, Centre for Social Sciences, Give Kids a Chance Research Group, Hungarian Academy of Sciences, Budapest. Hungary.
Fónai, Mihály Ph.D., Head of Department, University of Debrecen, Faculty of Law, Department of Public Policy and Applied Sociology, Debrecen, Hungary.
Horváth, Zsuzsanna E., Ph.D. candidate, Australian Collaboratory for Career Development, Learning, and Employability (ACCELL), University of Southern Queensland, Australia.
Huszti, Éva Ph.D., assistant professor, University of Debrecen, Faculty of Health, Nyíregyháza, Hungary.
Kilpeläinen, Arja lecturer, University of Lapland, Master’s Degree Program of e- Competence in Social work, Finland.
Krizsai, Anita solicitor, Municipality of Nyíregyháza, Ph.D student, University of Debrecen, Hungary.
Kurkinen, Jorma researcher, Northern Finland Centre of Excellence on Social Welfare, Master of Arts, Oulu, Finland.
Nyilas,Mihály Ph.D., associate professor, Head of Department, Department of Social Policy Faculty of Social Sciences, ELTE University, Budapest, Hungary.
Patyán, László associate professor, University of Debrecen, Faculty of Health, Institute of Social Sciences, Nyíregyháza, Hungary.
Rákó, Erzsébet Ph.D., associate professor, Head of Department, University of Debrecen, Faculty of Child and Adult Education, Department of Social Pedagogy, Debrecen, Hungary.
Szabó, Gyula Ph.D., assistant professor, University of Debrecen, Faculty of Child and Adult Education, Department of Institutional Management and Leadership, Debrecen, Hungary.
Szarvák, Tibor Ph.D., professor, College of Szolnok, Sociologist at National Institute for Family and Social Policy, Hungary.
Reviewers
Hajnal, György Ph.D.,associate professor, Head of Department, Corvinus University of Budapest, Department of Public Policy and Management, Budapest, www.uni-corvinus.hu, academic director, MA Public Policy and Management, Corivinus University of Budapest, EAPAA accredited - www.
eapaa.org, senior researcher, Center for Social Sciences, Institute for Political Science, Hungarian Academy of Sciences, Budapest, www.mtapti.hu , Hungary.
Prof. Lawson, Thomas R., Ph.D., Hon. Dr., Hon. D.Sc., FUASM, Professor and Director of International Programs, Kent School of Social Work, University of Louisville, Louisville, Kentucky, USA.
Prof. Vigvári, András, Ph.D, vice rector for scientific affairs, Head of Institute of Finance and Accountancy, Budapest Business School.
Editorial assistant
Kamocsa, Beáta scientific assistant, Centre for Social Sciences, Hungarian Academy of Sciences, Budapest. Hungary.
Reader editors
Kovács, Mariann, Institute for Sociology, Centre for Social Sciences, Hungarian Academy of Sciences, Budapest, Hungary.
Toldi, Andrea MSc, Expert of International Relationships, translator, English, Russian teacher, Nyíregyháza, Hungary.
Acknowledgement
Authors would like to thank to Dr. Rainer Greca, Professor of Sociology of the Katholische Universität Eichstätt in Germany, initiator of the European LOSS program, for his help, encouragement and continous support for our research team during the past two decades.
This book was written in the 20th year of the LOSS Project.
This book was edited in framework of Number 81667 project of OTKA, The Hungarian Scientific Research Fund. Project website:
http://www.tk.mta.hu/pti/loss/