Wild Boar (Sus scrofa) Home Range and Habitat Use in Two Romanian Habitats
Ferenc J
ÁNOSKAa*–Attila F
ARKASb– Miklós M
AROSÁNc– József-Tamás F
ODORba Institute of Wildlife Management and Vertebrate Zoology, University of Sopron, Sopron, Hungary
b Roth Gyula Doctoral School of Forestry and Wildlife Management Sciences, University of Sopron, Sopron, Hungary
c Division of Hunting, Game and Wildlife Management, University of Veterinary Sciences, Budapest, Hungary
Abstract – During our research we utilized data provided by GPS collars to compare the spatial patterns of wild boars living in lowland and high-hilly regions. Five wild boars were fitted with GPS Plus (Vectronic) type collars. The two aforementioned investigated habitat areas were as follows: a high-hilly hunting ground from the foot of the Bodoc Mountains (Covasna County), and the meeting point of Olt and Danube rivers in the southern part of the country (Teleorman County). The average daily wild boar activity varied between 2.9 and 3.1 km in the lowlands and between 3.6 and 4.9 km in the higher situated habitats. The average daily movement area calculated with the minimum convex polygon method was between 60.3 and 112.5 ha/day in the lowlands and between 113.5 and 125.2 ha/day in the high-hilly regions. The movement area of the wild boars calculated with the MCP method varied between 1,060 and 1,2001 hectares in lowlands and between 8,689 and 9,463 hectares in higher altitudes. Our data proved inadequate at testing whether or not large carnivores affect wild boar activity patterns. Habitat use analysis produced interesting results: even in a very diverse habitat, every collared individual preferred green forests. We found negative preference for agricultural fields in both habitats.
wild boar / habitat use / GPS collars / large carnivores / home range
Kivonat – A vaddisznó (Sus scrofa) otthonterülete és élőhely-használata két romániai élőhelyen.
A tanulmányban a szerzők bemutatják a vaddisznó élőhely-használatának jellemzőit egy síkvidéki és egy dombvidéki-középhegységi jellegű élőhelyen Romániában, GPS-nyakörvek segítségével. Öt vaddisznó példányt jelöltünk meg GPS-nyakörvvel (Vectronic). A vaddisznók napi átlagos aktivitása síkvidéken 2,9–3,1 km, dombvidéken 3,6–4,9 km között változott. A napi átlagos otthonterület nagysága (Minimum Convex Poligon, MCP módszerével számolva) 60,3–112,5 ha (síkvidék) és 113,5–125,2 ha (dombvidék) között alakult. Az éves átlagos otthonterület nagysága 1 060 és 12 001 ha (síkvidék) és 8 689–9 463 ha (dombvidék) között változott. Az élőhelyhasználat tekintetében negatív preferenciát találtunk mindkét vizsgálati területen a mezőgazdasági művelés alatt álló területekre vonatkozóan.
vaddisznó / élőhelyhasználat /GPS nyakörv / nagyragadozók / otthonterület
* Corresponding author: janoska.ferenc@uni-sopron.hu; H-9400 SOPRON, Bajcsy-Zs. u. 4, Hungary
1 INTRODUCTION
Farmers and foresters in many European countries consider wild boars (Sus scrofa) as pests by due to the perceived or real agricultural damage they cause. Schlageter (2013) concluded that numerous studies have provided extensive evidence for a drastic increase in wild boar populations in Europe over the last few decades. Multiple factors have favoured this continent- wide growth trend; among these are the reproductive rate of wild boars, which is the highest rate of all ungulates (Briedermann 1971), global climate change (e.g. Melis et al. 2006), and the increasing availability of foods of human origin such as crops (Geisser – Reyer 2005) or supplemental feeding (Cellina 2008). Increased population sizes are associated with problems including damage to agricultural crops, grassland, and woodland (Focardi et al. 2000, Gómez et al. 2003, Schley – Roper 2003, Calenge et al. 2004, Geisser – Reyer 2005, Schley et al. 2008, Varga – Kása 2011). The amount and severity of damage are strongly related to wild boar population density (Spitz – Lek 1999, Schley et al. 2008). Compensation payments amount to millions of Euros annually (Calenge et al. 2004, Schley et al. 2008, in countries like France (Klein et al. 2000), Luxembourg, and Hungary (Varga – Kása 2011) where damage to agriculture is generally compensated.
According to data provided by the Ministry of Environment, Water and Forests of Romania (MEWF 2016), wild boar population dynamics show increasing growth trends in Romania as well, but the real damage level caused by game species is underestimated because of the ambiguity surrounding the legislative and bureaucratic procedures of damage compensation.
According to government decision 1679/2008, compensation requests must be formulated within 24 hours after the damages have occurred. Damage caused by game species are not compensated unless a landowner can prove that damage prevention activities had been undertaken beforehand. Bureaucracy, short deadlines, ambiguous responsibilities, and delayed compensations have resulted in a relatively small number of damage compensation requests.
The first state compensations for crop and livestock damage caused by wildlife were paid in 2014. The equivalent of 184,167 Euro (4.4215 Ron = 1 Euro) was paid for 369 cases that occurred in the period of 2012–2014, and this was damage caused mainly by brown bear (Ursus arctos) and grey wolf (Canis lupus), both large carnivores (MMSC 2014). Official data relating to damages induced by wild boar do not exist at the national level. Currently, landowners and hunting associations try to manage the damages through intense prevention activities and by increasing the number of legally harvested boar both during and outside the limits of the hunting season.
Wild boar habitat selection has been evaluated in different contexts. For example, Boitani et al. (1994) found that boars selected uncultivated fields versus cultivated fields and used them according to the availability of forests. Thurfjell et al. (2009) also found avoidance of cultivated areas and a preference for forests (mainly deciduous forests), water, and open areas. Preference for wetlands has been reported in several areas (Dardaillon 1986; Meynhardt 1986; Thurfjell et al. 2009). The less frequent utilization of cultivated lands has been explained by the fact that they offer scant food resources when the soil is ploughed and become attractive only during the short season for grains and corn (Boitani et al. 1994); nevertheless, preference for agricultural fields, in addition to positive preference of deciduous forest and forest meadows has been found in other places such as Poland (Fonseca 2008).
Wild boar movement ecology varies among contexts. In general, disturbance by humans or natural enemies and widely distributed food resources necessitate larger home ranges (Schlageter 2013). Several studies investigated the influence of hunting on home range sizes (Maillard – Fournier 1995, Sodeikat – Pohlmeyer 2002, 2003, Baubet et al. 2004, Keuling et al.
2008b, Scillitani et al. 2010, Saïd et al. 2012). The effect of resource distribution has also been well-studied (e.g., Keuling et al., 2008a). The impacts of predators as natural enemies can be
direct (lethal), but can also include other risk effects (Schmitz 2008, Creel 2011). Currently, it is increasingly recognised that indirect, non-lethal predator impacts could be even more significant than direct lethal effects (Schmitz et al. 1997, Creel – Christianson 2008). In habitats with a high predator species density, direct encounters can occur despite various behavioural responses (i.e., increasing vigilance, altering group size, retreating to safe habitats) ungulates employ to reduce predation risk (e.g., Dehn 1990, Sih 1997, Hunter – Skinner 1998, Brown et al. 1999, Brown – Kotler 2004, Creel – Winnie 2005). These direct encounters, as well as the frequency and strength of anti-predator responses, remain undetected even with the use of advanced GPS technology (Creel et al. 2013), but long term tracking should reveal some activity patterns induced by predators, should they exist.
According to the best and most complete large-scale assessment of large carnivore population estimates available in 2014 (Chapron et al. 2014), large carnivore population sizes in Europe were as follows: brown bear – 17,000; grey wolf – 12,000; Eurasian lynx (Lynx lynx) – 9,000 individuals. Of these, about 35% of bears (6,000 individuals), 21% of wolves (2,300–
2,700 individuals), and 15% of lynxes (1,200 – 1,500) were found in Romania. Covasna County hosts the highest ungulate and large predator densities as well. In 2012, the following average large carnivore densities on 10,000 hectares were estimated: bear – 17.55; wolf – 4.59; and lynx – 2.03 (Boronia et al. 2012). In the case of bears, these average densities can be higher than 35 individuals per 10,000 ha at the local game management unit level.
Covasna County also had the most large carnivore damage reports (128 from a total of 902 cases) in 2012. At the national level, the requirements of G.D. 1679/2008 were only met in 71 of the 902 cases; thereby, damage compensation could only be requested in these 71 instances (Boronia et al. 2012). More than 40% (29 out of 71 cases) of properly documented damage compensation requests were from Covasna County.
Spatial requirements for wild boar has been reported to range from between a few hundred hectares to up to 3,500 ha (McIlroy 1989; Saunders – Kay 1996; Fischer et al. 2004) being that within the same populations there are more boars than sows (e.g., 3,500 ha, SD = ±2200 ha vs.
1100 ha, SD = ±520 ha in boars and sows, respectively Saunders – Kay, 1996; see also Massei et al. 1997 and Keuling et al. 2008a) including areas with different levels of hunting pressure (Saïd et al. 2012). One of the most extreme home range values reported is from Janeau – Spitz (1984) who reported an annual spatial requirement of 4,000–6,000 ha for sows and 12,000–15,000 ha for boars. Reported differences in annual home range areas can be explained by habitat-related factors such as food availability or disturbances. On the other hand, daily home ranges between 6 and 75 ha have also been reported (Janeau – Spitz 1984; McIlroy 1989;
Massei et al. 1997). Daily average distance covered ranged between 2.5 and 26.7 km for boars, and between 2 and 9 km for sows (Douaud 1983; Podgórski et al. 2013).
The first legal regulation of the dimensions of game management units in Romania was drafted in 1923 (Cotta – Bodea 1969). Dimensions were already linked to altitudinal zone at that time. The smallest hunting areas could have 100 ha in lowland regions and 1,000 ha in mountain regions. Currently in Romania, law 407/2006 for Game Protection and Hunting regulates the dimensions of hunting units. These dimensions are 5,000 ha in lowlands, 7,000 ha on hills, and 10,000 ha in mountain regions, but the question of how these dimensions are adequately adapted to the focal species remains unknown. According to law 407/2006, the game management unit boundaries must be defined to ensure greater wildlife stability within them.
This stability can be accomplished if spatial requirements for normal activities such as food gathering, mating, and nurturing the young are met.
In the present study, we examined spatial utilization patterns and, partly, the evolution of population dynamics trends of wild boar and large predators in two different regions of Romania to address the following questions:
1. Are the game management unit dimensions defined by law properly correlated with wild boar spatial requirements?
2. Are there any differences between activity patterns in the presence or absence of large predators?
3. Does a high preference for agricultural areas exist and does this lead to major crop damage?
2 MATERIALS AND METHODS
2.1 Study area
We chose two different habitat types regarding habitat quality, climate, and the presence of predators. One area was the high-hilly hunting ground of the Bodoc Mountains (mean altitude of 650 m a.s.l; 20,403 ha; Covasna County, Romania). The average temperature during the year is quite low (7.7 oC), and the number of snowy days is higher when compared to the second study area. This area is characterized by mixed forests (Fagus sylvatica, Carpinus betulus, Quercus petraea). Cover types in this mountain area were broad-leaved forests (39.6%), arable lands (37.8%), pastures (19.4%), and artificial surfaces (3.2%). Brown bear, grey wolf, and Eurasian lynx occur in this area. The second study area, a flatland hunting ground with a total area of 24,500 was situated in Teleorman County, at the confluence point of the Olt and Danube Rivers (S Romania). This region is warmer (mean multiannual temperature 11.5 oC) and broad- leaved forests occupied only 21.0% of the area, while arable lands occupied 50.3%, pastures 26.9%, water bodies 1.4%, and artificial surfaces 0.4%, respectively. As opposed to the previously mentioned hunting ground, all three top predator species are absent and the largest carnivore species in the area are golden jackals (Canis aureus). The disturbance caused by hunting is similar in both hunting grounds.
2.2 Population dynamics of wild boar and predator species
Stock assessment and hunting bag data for game species are available on the official Ministry of Environment, Waters, and Forests site (MEWF 2016). In Romania, there are some major differences between stock assessment data provided by hunting associations and population estimates made by some NGOs with various monitoring methods. For example, in 2012 hunting associations ‘had counted’ 9,220 bears while NGOs ‘had estimated’ 6,166 individuals. Therefore, to study trends in population dynamics, we processed only the hunting bag data for wild boars and golden jackal on lowlands. In the case of large predators, estimations made by NGOs are available only at the county level. The stock assessment data provided by hunting associations were reduced by the proportion of differences between data for Covasna County provided by hunting associations and NGOs.
2.3 Crop damage complaints
The number of crop damage complaints and the number of wild boars removed because of these conflicts were processed at the hunting association level.
2.4 Wild boar trapping and monitoring 2.4.1 Capture methods and anaesthesia
To capture wild boars, we used a single one corral type trap placed in traditional feeding sites.
These feeding places were situated between resting places and natural feeding locations and their main purpose was to prevent crop damage. We bait the traps all year long regardless of the intention to capture. Boars began using the traps as feeding places almost immediately.
Before capture days, we armed the clasp mechanism. In 4 out of 5 attempts, we captured sows with piglets. Individuals unfitted with GPS collars were transported in a wild boar enclosure.
Thus, we succeeded in capturing a sow or piglet in one trap day, whereas the capture of a male took five nights. Wild boars were immobilized using Stresnil® (40 mg Azaperon/ml) applied dose (Fournier et al. 2014): 20mg/50 kgbw; Domosedan® (10 mg/ml Medetomidin) applied dose: 10 mg/50 kgbw; Zoletil® (Tiletamin+Zolazepam 125 mg + 125 mg/5 ml) applied dose:
120 mg/50 kgbw (average induction time: 3’4’’, individuals slept after an average 4’45’’, average time of immobilization: 37’37’’, doses ranged from 6.8 to 9.2 mg/kgbw). Animals recovered from anaesthesia after an elapsed time of 185 minutes. We cannot confirm any unusual secondary effects.
2.4.2 Animal collaring and monitoring
We used GPS Plus collars, version number 10.0.5.12279, Vectronic Aerospace GmbH and utilized information from 5 wild boars (Table 1). In the high-hilly hunting ground, the collared individuals were 1 four-year-old boar (AM1_11699) and 1 six-year-old sow (AF1_11702). In the typical flatland and river-flats hunting ground, we captured and fitted 3 individuals with GPS collars: two yearlings, a male (SAM1_09777) and female (SAF1_11699), and a 5-year- old boar (AM2_11701).
2.5 Data analysis
Home range sizes were calculated using the Minimal Convex Polygon (MCP) method (Kie et al.
1996; Burgman – Fox 2003; Nilsen et al. 2008), and the Kernel Home Range (KHR) method (Worton 1987; Worton 1989; Laver – Kelly 2008), considering the 90% probability rate of finding (relocating) the animal in the area. In Kernel Density Estimation (KDE), a Kernel distribution (i.e. a three-dimensional hill or kernel) is placed on each telemetry location. Hill height is determined by the distribution bandwidth, and many distributions and methods are available (e.g. fixed versus adaptive, univariate versus bivariate bandwidth). The commonly used KDE with plug-in bandwidth selection frequently experienced problems: the home range polygons generated appeared unrealistic and fragmented. However, with the development of GPS technology to track animals in near real time, estimators of home range and movement have developed concurrently. Therefore, we also used a new method based on Brownian Bridge Movement Models (BBMM), which is based on two assumptions: (1) location errors correspond to a bivariate normal distribution and (2) movement between successive locations is a random conditional on the starting and ending location (Horne et al. 2007). Normally distributed errors are common for GPS data and 1 h between locations likely ensured that movement between successive locations was random (Horne et al. 2007). We estimated home range sizes using the BBMM method for 90% intensity of use.
GPS coordinates were transformed with Quantum GIS software into a Romanian Stereo70 projection system for subsequent analyses. Further analyses were carried out with Microsoft Excel, Arc View 3.2, and R software.
Habitat characteristics of wild boar home ranges were calculated from the habitat structure of the estimated home ranges using the MCP method. We used the Corine Land Cover 2000 habitat map with a 100 m resolution compiled by the European Environment Agency (EEA) to calculate the proportion of the following land covers within home ranges: artificial surfaces (CLC code = 112, 121, 131), arable fields (CLC code = 211, 213, 241), pastures and grasslands (CLC code = 231, 321), forest and semi-natural forested areas (CLC code = 311, 313, 324), and water bodies (CLC code = 511). Next, we correlated the cumulative incidence frequency occurring in the particular habitat types to the number of total GPS locations. To determine the wild boar habitat preference, we used the Ivlev-index (electivity index) (Ivlev, 1961). We calculated the Ivlev’s electivity index for each of the above mentioned habitat types as follows:
Iv = (N2 – N1) / (N2 + N1), where N1 was the proportion of a given habitat available within a home range and N2 was the proportion of locations within this habitat.
3 RESULTS
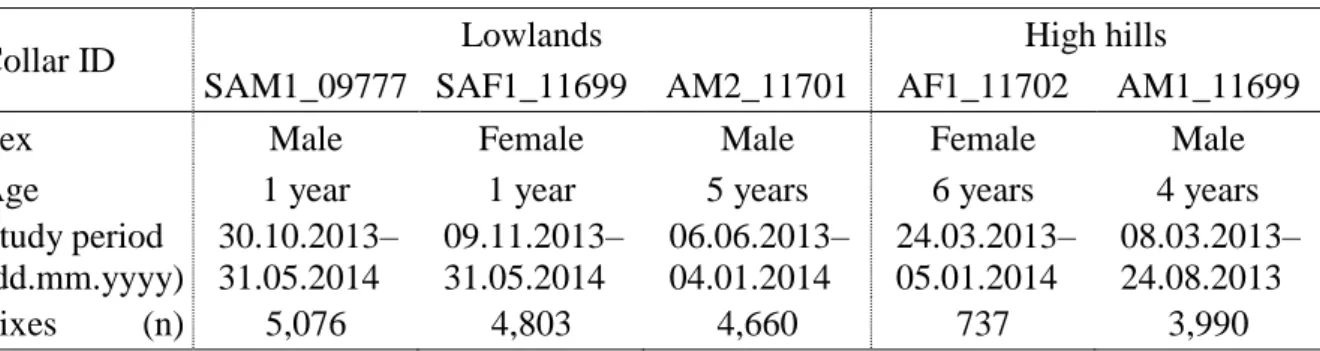
We analysed 19,266 valid positions (mean per individual: 3,853; range 737–5,076). Table 1 lists the identifiers of the five examined individuals, the examination periods, and the number of all positions of each individual.
Table 1. Number of collars, sex and age of wild boars, study period, and number of fixes received
Collar ID Lowlands High hills
SAM1_09777 SAF1_11699 AM2_11701 AF1_11702 AM1_11699
Sex Male Female Male Female Male
Age 1 year 1 year 5 years 6 years 4 years
Study period (dd.mm.yyyy)
30.10.2013–
31.05.2014
09.11.2013–
31.05.2014
06.06.2013–
04.01.2014
24.03.2013–
05.01.2014
08.03.2013–
24.08.2013
Fixes (n) 5,076 4,803 4,660 737 3,990
There was continuous and unimpeded data transmission from 4 individuals. The adult sow from the high hilly habitat marked as AF1_11702 was tracked for a total of 288 days.
Unfortunately, in this period, there were only 31 days when the GPS positions could be transmitted due to the lack of GSM signal coverage. Further data collection directly from the collar was impossible because it was lost.
3.1 Population dynamics
During the 2014/2015 hunting season, 25,750 wild boars were harvested in Romania, while in 2004/2005, bagged game amounted to 10,714 individuals. These data show a 2.4-fold increase in 10 years. In the lowlands (Teleorman County), the hunting bag data increase was 2.64-fold (187 to 494) for the same period. At the high-hilly Covasna County site, hunting bag data also increased, but only by a moderate 1.71 rate (500 to 856). At the hunting association level, comparable data are only available since the 2010/2011 hunting season because of some changes in game management organizations. The high-hilly hunting association from the Bodoc Mountains has a stable hunting bag with an insignificant increase rate of 1.1 in 4 years (60 to 66). Ten wild boars were removed in the lowlands study area during the 2010/2011 hunting season, while in the 2014/2015 season the hunting bag reached 168 harvested individuals, which translates to a 16.8-fold increase in 4 years.
National hunting bag data for golden jackal shows a 4.9-fold increase in the period from 2007 to 2015. At the county level (Teleorman County), the rate of increase was 8.17-fold in the 2007–2013 period (from 41 to 335). There was no jackal removal at the studied hunting association level in 2007. The first 2 jackals were harvested in 2008, and this number increased to 78 in the 2012/2013 hunting season.
According to data published by Chapron et al. (2014), compared to the 1950–1970s reference period, the population sizes of large carnivores in Romania increased as follows:
>1.5-fold in the case of wolves, >2-fold in the case of lynxes, and >5-fold in the case of bears.
The distribution range of these species had also increased in Carpathians: >2-fold in the case of wolf, and >1.5-fold in the cases of lynxes and bears. At the Bodoc Mountains, which is the part
of Covasna County that hosts the highest densities of ungulates and large predators, the hunting association ‘had counted’ 70 bears, 7 wolves, and 11 lynxes in an area of 20,403 ha in 2012 (MEWF 2016). At the county level in the same year, NGOs ‘had estimated’ smaller population sizes with 39.08% for bears, 28.57% for wolves and 60.52% for lynxes (Boronia et al. 2012).
Hunting association data reduced by the proportion of the differences between the data for Covasna County provided by the hunting associations and the NGOs results in the following large carnivore densities at 10,000 ha for the Bodoc Mountains: 20.58 for bears, 2.45 for wolves, and 2.12 for lynxes.
3.2 Crop damages
Until 2015, the hunting season for wild boar opened on August 01. Hunting was forbidden from February to July, but crop damage complaints usually started to appear from the end of April or the beginning of May. The fields of some landowners in the Bodoc Mountains are more exposed to damages regardless of the crop cultivated. The number of complaints at the hunting association level is quite small, under 10 every year, and the damaged area varies between 5 and 30 hectares. As a consequence of the complaints, the hunting association receives permission to authorise wild boar removals within the annual hunting quota limit. From the 60 individuals harvested annually, the number of removals related to crop damages in the summer period is increasing; in 2015 this number reached 20 specimens.
No wild boars were removed for crop damage in Teleorman County in the summer period before the start of the 2015/2016 hunting season. Only verbal complaints were made and, thus, remained unregistered. Nevertheless, the almost 17-fold increase in hunting bags in 4 years could only occur through an increase in hunting pressure. The stock assessment data also shows increasing trends, which could be a more plausible explanation for the evolution of such hunting bag data. Written damage complaints appeared in 2014 when 200 ha of maize owned by 4 landowners were destroyed. An earlier start to the hunting season was permitted in 2015 based on the damage complaints registered in 2014. In the period of May–July 2015, 30 wild boars were removed in relation to crop damages.
3.3 Spatial ecology: Home range and Brownian motion
Using the MCP method, wild boar home range size ranged from 1,060 to 12,001 ha. Habitat related differences in home range sizes were not found. However, adult animals showed the higher values. On the other hand, estimates using the KHR 90% varied between 115 and 1,410 ha. The smallest estimates with this method were for a young boar from the lowland hunting ground, whereas the biggest was detected in the case of an adult sow from the high- hilly habitat. Finally, the BBMM 90% method showed a home range size ranging from 235 to 940 ha (Table 2). The Brownian motion home range estimates have shown similar age-group related patterns as the MCP method.
Table 2. Home range size values using the MCP 100%, KHR 90% and by BBMM 90%
methods
Collar ID Lowlands High hills
SAM1_09777 SAF1_11699 AM2_11701 AF1_11702 AM1_11699 MCP to.st.p. (ha) 1,060 6,231 12,001 8,689 9,463
KHR 90% (ha) 114.9 385.5 704.0 1410.3 351.3
BBMM 90.0 (ha) 235.3 443.3 655.5 940.3 475.0
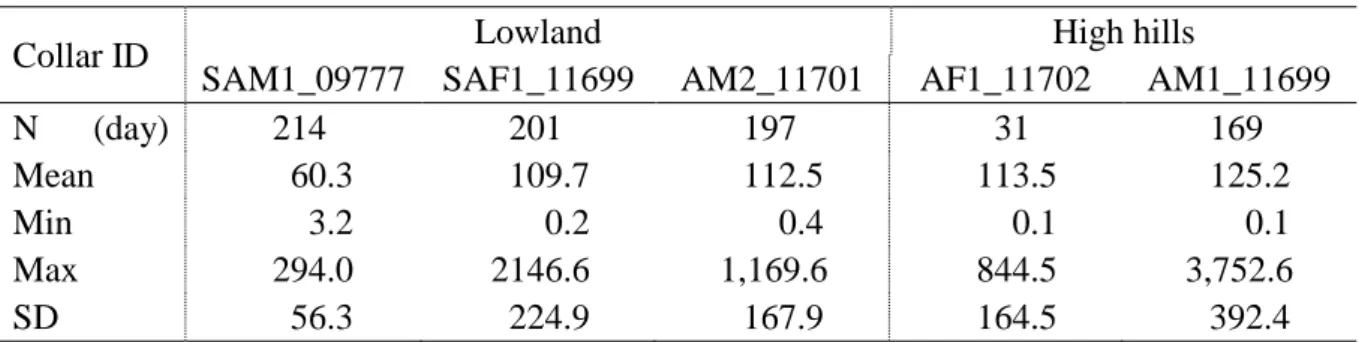
The mean daily home ranges calculated with the MCP method varied between 60.3 and 125.2 ha per day with a maximum of 3,752 ha (Table 3).
Table 3. Daily home range (ha) minimum, maximum, and standard deviation of mean
Collar ID Lowland High hills
SAM1_09777 SAF1_11699 AM2_11701 AF1_11702 AM1_11699
N (day) 214 201 197 31 169
Mean 60.3 109.7 112.5 113.5 125.2
Min 3.2 0.2 0.4 0.1 0.1
Max 294.0 2146.6 1,169.6 844.5 3,752.6
SD 56.3 224.9 167.9 164.5 392.4
The mean daily travel distance of the studied wild boars ranged between 2,887 m and 4,948 m, (Table 4). Longer average daily distances as well as shorter minimal daily distances were found in the high hills. The distances between the first and last point in the trajectory appear to be individual characteristics without any connection to the habitat type or the age of the wild boar.
Maximum displacement seems to be age related.
Table 4. Basic dataset for Brownian Bridge Movement Models (BBMM)
Habitat ID Lowlands High hills
SaM1_09777 SaF1_11699 AM2_11701 AF1_11702 AM1_11699
MeanLDay* 2,887 3,149 3,135 4,948 3,576
MinLDay* 333 332 436 66 172
MaxLDay* 17,860 14,075 9,315 15,165 37,483
DisplMtrs* 1,047 4,980 2,109 11,318 1,804
MaxDisplMtrs* 5,605 9,703 19,474 16,309 6,106
* MeanLDay: The mean daily distance; MinLDay: The min daily distance; MaxLDay: The max daily distance;
DisplMtrs: The distance between the first point in the input trajectory and the last point in the trajectory;
MaxDisplMtrs: The maximum displacement between any two points in the trajectory.
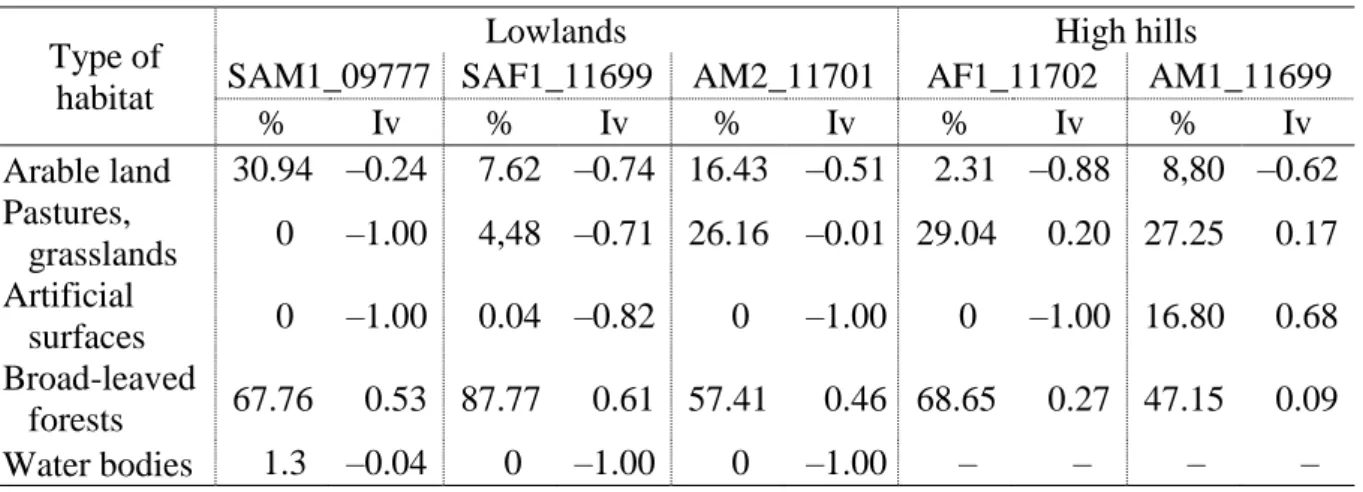
3.4 Habitat use
Wild boars used forests as main habitats (47–88%) in both study areas (Table 5). We found preference or use according to availability of these habitat categories. Water bodies were avoided. We found avoidance of artificial surfaces in most cases, but the male from the high- hilly habitat has shown signs of urbanization. Regarding the use of agricultural areas, we noted avoidance in the lowlands and neutral use in higher altitudes. We have to mention that neutral preference was experienced in the mountainous area and, on the other hand, during the growing period of the agricultural crops. The negative preference values were found in the November–
May period, outside the growing time of the cultivated plants.
Table 5. Ivlev’s electivity indexes and percentage of use of different habitat types
Type of habitat
Lowlands High hills
SAM1_09777 SAF1_11699 AM2_11701 AF1_11702 AM1_11699
% Iv % Iv % Iv % Iv % Iv
Arable land 30.94 –0.24 7.62 –0.74 16.43 –0.51 2.31 –0.88 8,80 –0.62 Pastures,
grasslands 0 –1.00 4,48 –0.71 26.16 –0.01 29.04 0.20 27.25 0.17 Artificial
surfaces 0 –1.00 0.04 –0.82 0 –1.00 0 –1.00 16.80 0.68 Broad-leaved
forests 67.76 0.53 87.77 0.61 57.41 0.46 68.65 0.27 47.15 0.09
Water bodies 1.3 –0.04 0 –1.00 0 –1.00 – – – –
4 DISCUSSION
Although our results are partial, we can state that the home range calculated with the MCP method far exceeds the values published in former studies (McIlroy 1989, Saunders – Kay 1996, Massei et al. 1997, Fischer et al. 2004, Keuling et al. 2008a).
The daily home ranges also exceed the previously published values (McIlroy 1989, Massei et al. 1997). With the exception of the young male marked SAM1_09777 that was characterized with the smallest annual home range, the average daily home range seems to fit with values published by Janeau – Spitz (1984).
In the meantime, the average daily distances covered partially fit the values stated in France (Douaud 1983), but are shorter than those in Poland (Podgórski et al. 2013). There are considerable differences in the home range of boars of differing ages living in the same habitat.
As we can see in the Table 2, the home range of the young boar is far smaller. The difference in the results between the young and the old boar persist when calculated with all methods.
Since the MCP method also takes the farthest positions into consideration, this draws our attention to the fact that old boars sometimes roam for great distances. The home ranges of the two marked sows are more or less similar; however, in this case too, the younger individual’s home range is smaller. In the higher hunting ground, against all expectations, neither the average daily distance covered nor the home range is larger. Here we marked one sow AF1_11702, and one boar AM1_11699. Considering that the disturbance level in this hunting ground is higher due to the large number of top predators (bear, wolf, and lynx), it was assumed that the home range of the wild boar would be bigger. Thus far, the data does not show considerable differences between the daily home ranges of the two boars marked in different habitats, nor in average daily distances covered. Despite the small number of collared individuals in an area that probably contains the highest density of large carnivores in Europe, it is reasonable to assume that predators should affect the activity patterns of wild boars.
However, we did not find any sign of predator impacts. Our partial results are different in many respects from the former study results; for example, in respect to the daily home ranges, as well as in respect to the annual home ranges calculated with the minimum convex polygon method.
Regarding the first question concerning the proper correlation of legislated hunting unit dimensions and wild boar spatial requirements, we can state that the smallest dimension for game management units is 5,000 hectares, which is the minimum size that ensures greater species stability. The whole home range of wild boar calculated with methods that exclude the positions without any connection to the normal activities of the animal such as food gathering, mating, and caring for young, do not exceed 3,000 hectares either in the lowlands or in the
higher altitudes. In the Carpathians, wild boar population growth and associated crop damage issues seem to be under control. Therefore, the crop damages can be handled appropriately at actual legal hunting unit levels. In the context of harsh climatic conditions and large carnivores, higher harvest rates or expanded hunting seasons could threaten the highly adaptive wild boar.
Smaller hunting unit dimensions are not recommended because of the spatial requirements of the other sympatric ungulate and large carnivore communities.
Wild boar populations have become overabundant in lowland areas. The population was underutilised for years; therefore, previously used hunting methods and quotas would prove ineffective at managing the population. These areas provide comfortable climatic conditions, a lack of natural enemies, and a high proportion of accessible agricultural fields under crop; thus, the following management solutions are recommended: increasing the harvest rate through the implementation of minimal hunting quotas; an open, year-round hunting season; removal of females outside the breeding season; a higher harvest rate for juveniles (Keuling et al. 2013, Massei et al. 2015); large scale application of damage prevention methods; and, finally, simplifying and enforcing the damage compensations systems. The abovementioned management solutions require more human resources and smaller areas of responsibility for proper implementation. Smaller game management units of at least 3000 hectares could accomplish greater wild boar stability and reduce management requirements. If the spatial requirements of species of interest, such as wild boars, are smaller than the legal hunting unit dimensions, crop damage issues can become manageable because the hunting revenues and the crop damage compensation costs are generated through the same game management units.
Due to the small number of collared individuals, as well as age and sex related differences in wild boar spatial ecology, we admit that the effect of large carnivores on activity patterns could not be tested. We can only state that annual home ranges of wild boars living in the studied habitat types are similar. Based on our results, we could not conclude whether the activity patterns of wild boar are affected or unaffected by presence of large predators.
In terms of habitat use and the preference of agricultural areas, our main finding is that crop damage prevention efforts are unnecessary during the period from November to May because wild boar display avoidance and neutral use of agricultural areas during this period.
Concerning the point of habitat preference, we can state that there is a lower interest in open field areas with reduced coverage. In some cases we experienced total avoidance of these areas;
conversely, covered and dense green forest areas were preferred. Our results regarding the preference of deciduous forests fit with other European publications (Fonseca 2008, Thurfjell et al. 2009). Also, there is an inconsistency in the preference of agricultural lands under crop.
Random use or negative preference of agricultural fields was found in other studies as well (Boitani et al. 1994, Thurfjell et al. 2009). The cause probably lies in the examination period.
This could be the justification of keeping the function in GPS collars on the boars, and this is why we need to make detailed interpretations of the data collected during various seasons.
Acknowledgements: We would like to thank Frank Berger for proofreading the manuscript.
REFERENCES
BAUBET,E.–BRANDT,S.–VASSANT,J.–GENDNER,J.P.–KLEIN,F. (2004): Can wild boar be surveyed using GPS? Memoirs of National Institute of Polar Research. Special issue 58: 188–195.
BOITANI,L.–MATTEI,L.–NONIS,D.–CORSI,F.(1994): Spatial and activity patterns of wild boars in Tuscany, Italy. Journal of Mammalogy 75 (3): 600–612. https://doi.org/10.2307/1382507
BORONIA,V.–IONESCU,O. –IONESCU,G. (2012): Studiu privind estimarea populaţiilor de carnivore mari şi pisică sălbatică din România (Ursus arctos, Canis lupus, Lynx lynx şi Felis silvestris) în vederea menţinerii într-o stare favorabilă de conservare şi pentru stabilirea numărului de exemplare
din speciile strict protejate care se pot recolta în cadrul sezonului de vânătoare 2012–2013 [Study on estimating populations of large carnivores and wild cats (Ursus arctos, Canis lupus, Lynx lynx and Felis silvestris) from Romania in order to maintain a favorable conservation status and to determine the number of individuals of the strictly protected species that can be harvested during the 2012-2013 hunting season.] Carpathian Wildlife Foundation and subcontractors: National Institute for Research and Development in Forestry and Transilvania University of Brașov - Faculty of Silviculture and Forest Engineering for Ministry of Environment and Forests. (in Romanian) BRIEDERMANN, L. (1971): Zur Reproduktion des Schwarzwildes in der Deutschen Demokratischen
Republik. Tagungsbericht der deutschen Akademie für Landwirtschaftswissenschaften Berlin 113:
169–186.
BROWN,J.S.–KOTLER, B. P. (2004): Hazardous duty pay and the foraging cost of predation. Ecol. Lett.
7: 999–1014. https://doi.org/10.1111/j.1461-0248.2004.00661.x
BROWN,J.S.–LAUNDRÉ,J.W.–GURUNG,M. (1999): The ecology of fear: optimal foraging, game theory, and trophic interactions. Journal of Mammalogy 80 (2): 385–399.
https://doi.org/10.2307/1383287
BURGMAN,M.A.–FOX,J.C. (2003): Bias in species range estimates from minimum convex polygons:
implications for conservation and options for improved planning. Animal Conservation 6 (1): 19–
28. https://doi.org/10.1017/S1367943003003044
CALENGE,C.–MAILLARD,D.–FOURNIER,P.–FOUQUE,C. (2004): Efficiency of spreading maize in the garrigues to reduce wild boar (Sus scrofa) damage to Mediterranean vineyards. European Journal of Wildlife Research 50 (3): 112–120. https://doi.org/10.1007/s10344-004-0047-y
CELLINA,S. (2008): Effects of supplemental feeding on the body condition and reproductive state of wild boar Sus scrofa in Luxembourg. Brighton: University of Sussex.
https://doi.org/10.13140/2.1.5077.6642
CHAPRON,G.–KACZENSKY,P.–LINNELL,J.D.C.–VON ARX,M.–HUBER,DJ.–ANDRÉN,H., et al.
(2014): Recovery of large carnivores in Europe’s modern human-dominated landscapes. Science 348: 1517–1519. https://doi.org/10.1126/science.1257553
CREEL, S. (2011): Toward a predictive theory of risk effects: hypotheses for prey attributes and compensatory mortality. Ecology 92: 2190–2195. https://doi.org/10.1890/11-0327.1
CREEL,S.–CHRISTIANSON,D. (2008): Relationships between direct predation and risk effects. Trends in Ecology & Evolution 23 (4): 194–201. https://doi.org/10.1016/j.tree.2007.12.004
CREEL,S.–WINNIE,J.A. (2005): Responses of elk herd size to fine-scale spatial and temporal variation in the risk of predation by wolves. Anim. Behav. 69: 1181–1189.
https://doi.org/10.1016/j.anbehav.2004.07.022
CREEL,S.–WINNIE,J.A.–CHRISTIANSON,D. (2013): Underestimating the frequency, strength and cost of anti-predator responses with data from GPS collars: an example with wolves and elk. Ecol. Evol., 3: 5189–5200. https://doi.org/10.1002/ece3.896
COTTA, V.–BODEA,M. (1969): Vînatul României [The hunting in Romania]. Editura Agrosilvica, Bucuresti (in Romanian)
DARDAILLON,M.(1986):Seasonal variations in habitat selection and spatial distribution of wild boar (Sus Scrofa) in the Camargue, Southern France. Behavioural Processes 13 (3): 251–268.
https://doi.org/10.1016/0376-6357(86)90088-4
DEHN,M.M. (1990): Vigilance for predators: detection and dilution effects. Behav. Ecol. Sociobiol. 26:
337–342. https://doi.org/10.1007/BF00171099
DOUAUD,J.F. (1983): Utilisation de l'espace et du temps et ses facteurs de modulation chez le sanglier, Sus scrofa, en milieu forestier ouvert (Massif des Dhuits, Haute-Marne (Doctoral dissertation) [Time and space use and its modulation factors of wild boar, Sus scrofa, in an open forest area].
(in French)
FISCHER,C.–GOURDIN,H.–OBERMANN,M. (2004): Spatial behaviour of the wild boar in Geneva, Switzerland: Testing the methods and first results. Galemys 16: 149–155.
FOCARDI,S.–CAPIZZI,D.–MONETTI,D. (2000): Competition for acorns among wild boar (Sus scrofa) and small mammals in a Mediterranean woodland. Journal of Zoology 250 (3): 329–334.
https://doi.org/10.1017/S095283690000306X
FONSECA,C. (2008): Winter habitat selection by wild boar Sus scrofa in southeastern Poland. European Journal of Wildlife Research 54 (2): 361–366. https://doi.org/10.1007/s10344-007-0144-9
FOURNIER, P. – FOURNIER-CHAMBRILLON, C. – MAILLARD, D. – KLEIN, F. (2014): Zoletil®
immobilization of Wild boar (Sus scrofa L.). Journal of Mountain Ecology 3:134–136.
GEISSER,H.–REYER,H.U. (2005): The influence of food and temperature on population density of wild boar Sus scrofa in the Thurgau (Switzerland). Journal of Zoology 267 (1): 89–96.
https://doi.org/10.1017/S095283690500734X
GÓMEZ,J.M.–GARCIA,D. –ZAMORA,R. (2003): Impact of vertebrate acorn and seedling predators on a Mediterranean Quercus pyrenaica forest. Forest Ecology and Management 180 (1): 125–134.
https://doi.org/10.1016/S0378-1127(02)00608-4
HORNE,J.S.–GARTON,E.O.–KRONE,S.M.–LEWIS,J.S. (2007): Analyzing animal movements using brownian bridges. Ecology 88: 2354–2363. https://doi.org/10.1890/06-0957.1
HUNTER,L.T.B.–SKINNER,J.D. (1998): Vigilance behaviour in African ungulates: the role of predation pressure. Behaviour 135: 195–211. https://doi.org/10.1163/156853998793066320
IVLEV,V.S. (1961): Experimental ecology of the feeding of fishes. – Yale University Press, New Haven JANEAU,G.–SPITZ,F. (1984): L'espace chez le sanglier (Sus scrofa scrofa L.): occupation et mode
d'utilisation journalier [Space use of wild boar (Sus scrofa scrofa L.): Activity and daily habitat use]. Gibier Faune Sauvage, 1: 73–89. (in French)
KEULING,O.–STIER,N.–ROTH,M. (2008a). Annual and seasonal space use of different age classes of female wild boar Sus scrofa L. European Journal of Wildlife Research 54 (3): 403–412.
https://doi.org/10.1007/s10344-007-0157-4.
KEULING,O.–STIER,N.–ROTH,M (2008b). How does hunting influence activity and spatial usage in wild boar Sus scrofa L.? European Journal of Wildlife Research 54: 729–737.
https://doi.org/10.1007/s10344-008-0204-9
KEULING,O.–BAUBET,E.–DUSCHER,A.–EBERT,C.–FISCHER,C.–MONACO,A.–PODGÓRSKI,T.
–PREVOT,C.–RONNENBERG,K.–SODEIKAT,G.–STIER,N.–THURFJELL,H.(2013):Mortality rates of wild boar Sus Scrofa L. in central Europe. European Journal of Wildlife Research 59 (6):
805–814. https://doi.org/10.1007/s10344-013-0733-8
KIE,J.G.–BALDWIN,J.A.–EVANS,C.J. (1996): CALHOME: a program for estimating animal home ranges. Wildlife Society Bulletin (1973-2006) 24 (2): 342–344.
KLEIN,F.–JAEGER,P.–SAINT-ANDRIEUX,C.-VAN LAERE,G. (2000): Prévention et indemnisation des dégâts forestiers dans différents pays européens [Prevention and compensation of forest damages in different European countries]. Office National de la Chasse, Direction de la Recherche et du Développement & Centre national d’étude et de recherche appliquée Cervidés et sanglier, Paris, 16 pp. (in French)
LAVER,P.N.–KELLY,M.J. (2008): A critical review of home range studies. The Journal of Wildlife Management 72(1): 290–298. https://doi.org/10.2193/2005-589
MAILLARD D.–FOURNIER P. (1995): Effects of shooting with hounds on size of resting range of wild boar (Sus scrofa L.) groups in mediterranean habitat. Ibex J. Mt. Ecol. 3:102–107.
MASSEI,G.–GENOV,P.V.–STAINES,B.W.–GORMAN,M.L. (1997): Factors influencing home range and activity of wild boar (Sus scrofa) in a Mediterranean coastal area. Journal of Zoological Society of London 242: 411–423. https://doi.org/10.1111/j.1469-7998.1997.tb03845.x
MASSEI,G.– KINDBERG, J.–LICOPPE,A.– GACIC, D.– SPREM, N.–KAMLER, J. –BAUBET,E. – HOHMANN, U.– MONACO,A. – OZOLINS, J.– CELLINA, S. – PODGÓRSKI, T. –FONSECA, C. – MARKOV,N.–POKORNY,B.–ROSELL,C.–NÁHLIK,A.(2015):Wild boar populations up, numbers of hunters down? A review of trends and implications for Europe. Pest Management Science 71 (4): 492–500. https://doi.org/10.1002/ps.3965
MCILROY,J.C. (1989): Aspects of the ecology of feral pigs (Sus scrofa) in the Murchison Area, New Zealand. New Zealand Journal of Ecology 12: 11–22.
MELIS,C.–SZAFRAŃSKA,P.A.–JĘDRZEJEWSKA,B.–BARTOŃ,K. (2006): Biogeographical variation in the population density of wild boar (Sus scrofa) in western Eurasia. Journal of Biogeography 33 (5): 803-811. https://doi.org/10.1111/j.1365-2699.2006.01434.x
MEWF (2016): Ministry of Environment, Waters and Forests in Romania:
http://www.mmediu.ro/categorie/vanatoare
MEYNHARDT,H. (1986): Vaddisznóriport: életem a vaddisznók között. [Wild boar reportage: my life between wild boars]. Gondolat, Budapest (in Hungarian)
MMSC (2014): http://www.mmediu.ro/app/webroot/uploads/files/2014-11-13_ MMSC_a _adus _la_zi _plățile_despăgubirilor_pentru_pagubele_produse_de_speciile_protejate.pdf
NILSEN,E.B.–PEDERSEN,S.–LINNELL,J.D. (2008): Can minimum convex polygon home ranges be used to draw biologically meaningful conclusions? Ecological Research 23(3): 635–639.
https://doi.org/10.1007/s11284-007-0421-9
PODGÓRSKI,T.–BAŚ,G.–JĘDRZEJEWSKA,B.–SÖNNICHSEN,L.–ŚNIEŻKO,S.–JĘDRZEJEWSKI,W.– OKARMA, H. (2013): Spatiotemporal behavioral plasticity of wild boar (Sus scrofa) under contrasting conditions of human pressure: primeval forest and metropolitan area. Journal of Mammalogy 94(1): 109–119. https://doi.org/10.1644/12-MAMM-A-038.1
SAÏD,S.–TOLON,V.–BRANDT,S.–BAUBET,E. (2012): Sex effect on habitat selection in response to hunting disturbance: the study of wild boar. European Journal of Wildlife Research 58: 107–115 https://doi.org/10.1007/s10344-011-0548-4
SAUNDERS,G.–KAY,B. (1996): Movements and Home Ranges of Feral Pigs (Sus scrofa) in Kosciusko National Park, New South Wales. Wildlife Research (23): 711–719.
https://doi.org/10.1071/WR9960711
SCHLAGETER, A. (2013): Preventing wild boar Sus scrofa damage – considerations for wild boar management in highly fragmented agroecosystems. Doctoral dissertation. University of Basel.
SCHLEY, L. –ROPER,T.J. (2003): Diet of wild boar Sus scrofa in Western Europe, with particular reference to consumption of agricultural crops. Mammal review 33(1): 43–56.
https://doi.org/10.1046/j.1365-2907.2003.00010.x
SCHLEY,L.–DUFRÊNE,M.–KRIER,A.–FRANTZ,A.C. (2008): Patterns of crop damage by wild boar (Sus scrofa) in Luxembourg over a 10-year period. European Journal of Wildlife Research 54 (4):
589–599. https://doi.org/10.1007/s10344-008-0183-x
SCHMITZ,O.J. (2008): Effects of predator hunting mode on grassland ecosystem function. Science 319:
952–954. https://doi.org/10.1126/science.1152355
SCHMITZ,O.J.–BECKERMAN,A.P.–O'BRIEN,K.M. (1997): Behaviorally mediated trophic cascades:
effects of predation risk on food web interactions. Ecology 78 (5): 1388–1399.
https://doi.org/10.1890/0012-9658(1997)078[1388:BMTCEO]2.0.CO;2
SCILLITANI,L.–MONACO,A.–TOSO,S. (2010): Do intensive drive hunts affect wild boar (Sus scrofa) spatial behaviour in Italy? Some evidences and management implications. European Journal of Wildlife Research 56: 307–318. https://doi.org/10.1007/s10344-009-0314-z
SIH,A.(1997): To hide or not to hide? Refuge use in a fluctuating environment. Trends Ecol. Evol.
12:375–376. https://doi.org/10.1016/S0169-5347(97)87376-4
SODEIKAT,G.–POHLMEYER,K. (2002): Temporary home range modifications of wild boar Sus scrofa caused by drive hunts in Lower Saxony (Germany). In Proceedings of the 25th Congress of the International Union of Game Biologists and the IXth International Symposium Perdix. E.
Hadjisterkotis, editor, 3.–7. September 2001. Lemesos, Cyprus. Zeitschrift für Jagdwissenschaft 48: Supplement: 161–166. https://doi.org/10.1007/BF02192404
SODEIKAT,G.–POHLMEYER,K. (2003): Escape movements of family groups of wild boar Sus scrofa influenced by drive hunts in Lower Saxony, Germany. Wildlife Biology 9: Supplement 1: 43–49.
SPITZ, F. – LEK, S. (1999): Environmental impact prediction using neural network modelling. An example in wildlife damage. Journal of Applied Ecology 36 (2): 317–326.
https://doi.org/10.1046/j.1365-2664.1999.00400.x
THURFJELL,H.–BAL,L J.P.–ÅHLÉN,P.A.–KORNACHER,P.–DETTKI,H.–SJÖBERG,K. (2009): Habitat use and spatial patterns of wild boar Sus scrofa (L.): agricultural fields and edges. European Journal of Wildlife Research 55 (5): 517–523. https://doi.org/10.1007/s10344-009-0268-1
VARGA,Z.–KÁSA,R.(2011):Vadkár. Mezőgazda Kiadó, Budapest.
WORTON,B.J. (1987): A review of models of home range for animal movement. Ecological modelling 38 (3): 277–298. https://doi.org/10.1016/0304-3800(87)90101-3
WORTON, B.J. (1989): Kernel Methods for Estimating the Utilization Distribution in Home-Range Studies. Ecology 70 (1): 164–168. https://doi.org/10.2307/1938423