University of West Hungary
Summary of PhD Thesis
Effect of Linear Structures in Land Use of Red Deer
Zsuzsanna Ballók
Sopron, 2011
„Roth Gyula” Doctoral School of Forestry and Wildlife Management
Programme: Wildlife Management
Supervisor: Dr. Náhlik, András
Content
1. Literature overview...4
2. Problem definition, aim of this study...5
3. Questions...6
4. Examined area, data recording methodology...7
5. Results...9
6. Evaluation of results, conclusions, recommendations...15
7. Thesis summary...18
8. Used literature...19
9. Other publications, presentations...21
1. Literature overview
Linear structures have significant effect on the density of wild life and diversity of communities (Bissonett, 2002), because they generate "barrier- effect", which is the root cause of habitat fragmentation, the most serious problem caused by linear structures (Reed et al., 1996). The changes in the structure of an ecosystem caused by the continuously developing network of roads and fences are very prominent. Examples include habitat de- fragmentation, other functional, structural changes (e.g. increasing ratio of border-areas), complete degradation or disappearance of habitat. According to different opinions and estimates, only 20 percent of under-passes built on highways are actually suitable for game to pass (Nagy 2007). This poses a great danger to -- among other things -- conserving the gene pool of the red deer. It is important when planning a road or a network of roads, that the impact assessment is done based on data acquired with different scaling and on different types of habitat. This is the only way to obtain an overall picture about the impact of the investment based on the entire road network.
According to the results of Clevenger & Walto (2005), without human disturbance, the amount of traffic on an under-pass was mostly influenced by the structural parameters of the under-pass. In case of short and wide under- passes, the high ones were more preferred by deer (Cervus elaphus, Odocoileus, etc) according to this Canadian study. Although the vegetation coverage around the under-pass proved to be a secondary factor compared to the size of the under-pass, it still had a significant role.
Taking several studies into account, the most successful way is to have several different types of passes with different parameters next to each other.
These under- and over-passes don't necessarily have to be dedicated only for the wild life, it suffices if the main purpose is different (train, agricultural
machinery, cars, pedestrians, etc) and they serve the wild life as a secondary goal (Taylor et al., 2003; Ng et al., 2004).
A study related to the forest and agricultural fences performed around Sopron found that forests fenced off in the area had a great impact on the location of pellet groups. They found no or very little pellet within several hundred meters of such objects, even if the area provided good hiding places.
The same study also showed that with increasing the size of the fenced off area there was no increase in browse damage outside the fences. There was no evidence to support the theory that if the deer is cut off from specific areas, the damage will be greater elsewhere. This also contradicts the assumption that at some distance from the fences there would be increased amount of pellet groups as the deer trying to get to the fenced off area would be "deflected" by the fence (Náhlik, 2004).
2. Problem definition, aim of this study
At first, densely populated European countries started using fences that no longer wanted to keep animals within a given area, but to keep them away from huge, sometimes several acres of areas. Today the great amount of fences serving such purpose fundamentally change the quality or even the quantity of habitats. A new problem rises about the effect of two fences set up close to each other. How will a fence influence deer movement in its immediate vicinity and what is the minimum distance within which if a new fence is built, they can no longer be considered as separate objects but they cut off the deer from the entire area together.
An other problem similar to the one above can be defined related to fenced off highways. Passes with different sizes, under- or over-passes that
are built for a different purpose but can be used by wild animals as well try to allow animals to move around and between the habitats. However, the parameters and physical properties of these passes do make a difference.
Examining the immediate surroundings of a linear structure, the question is how close the red deer will approach them, and how their detectable presence will change along a strip that has a fenced off highway built on it.
3. Questions
Study of the effects of forest and game preserve fences
1. Is the method of counting pellets suitable for estimating changes in deer population density in cases when there is only a few 10 meters between sampling areas?
2. Is there a difference between fences that are next to a wild boar hunting park or a smaller fence, protecting forest plantations with regard to how the frequency of deer appearances changes with distance measured from the fence?
3. Examining the movements of wild animals in the immediate vicinity of the fences, is there a detectable difference between the two groups of sampling areas next to different sizes of fenced off areas?
4. Is there a detectable correlation between the distance measured from the fence and the frequency of deer appearances?
Examining the "utilization" of wild passes
1. When we examine the area before the highway is constructed, is there a difference in estimated amount of wild animal crossing at two separate points along the already defined path of the highway?
2. Comparing data recorded on individual sections and the combined data of the two passes built later, how does the "game traffic" change before and after the construction on these parts?
3. Description of the temporal change, dividing the period before and after the construction in time.
4. Examined area, data recording methodology
Examining the effects of forestry and wild park fences
The author chose to conduct this study at the northern part of Vas county, north of the road number 8, between Csörötnek and Csákánydoroszló, and south of the Austrian border. This area is mostly covered by forests, and strongly mosaic. Oak, beech, pine and hornbeam forests mix up with agricultural areas and forest plantations. This results in numerous forest and agricultural fences in addition to a bigger wild reserve park in the area.
The sampling sites were picked randomly. The study examines these sites using the method of stripe-based estimation of pellet count. This method is able to give a rough estimate of the density of a wild animal population even on diverse terrain, how it changes in different areas, and the typical appearance of wild animals (Härkönen & Heikilä, 1999; Neff, 1968; Smith, 1990). A single
stripe was 2 meters wide (Borkowski, 2004). The center-line of each stripe was running along the fence at a fixed distance. The first stripe was directly next to the fence, and at the first data recording six stripes were defined in total with 20 meters between them. The first data collecting raised a few questions, and to answer them, a second data recording session was planned. This time there were 5 stripes in total, with 60 meters between them.
The examined wild passes
In this part of the research the examined area was south of lake Balaton, in the north-western corner of county Somogy, along the section of the M7 highway that starts with the wild over-pass north-east of the crossing of the road number 68, and stretches until the under-pass built to allow the crossing of a canal arriving from towards Balatonújlak and a railway.
The data comes from four wild passes in total. One of these is an over-pass, the other three are under-passes. On each pass, the number of tracks were recorded in a way that allows for comparing the individual passes and describing temporal changes.
There was an opportunity to count full length crossing tracks on two sections along the marked path of the highway being under construction at that time. For this reason, there were no sampling areas defined. Every week the total number of tracks was determined separately for each of the two sections. After the construction the data was recorded every week as well, based on full length tracks crossing the wild passes, so there were no sampling areas defined this time either. Because the fences were already up, wild animals could only cross
using the wild passes and for the rest of the section the author considered the number of tracks to be zero. Later there were two wild passes built on each of the two examined sections.
5. Results
Surroundings of forest fences
After processing all data and examining the pellet count next to the two different types of fences (the bigger, contiguous area of the wild boar hunting park and the smaller, sparsely located fences protecting forest plantations) regardless of their distance from the fence (adding up all the stripes), the author found that the numbers show significant difference (t = -2,45; p =0,016).
Summarising data from both groups and using stripes being at the same distance, then comparing them using variant analysis, the author found traceable difference as well (F =25,33; p ≤0,001).
That stripes that are 0 m away from the fence are different in the same way from the others based on Tukey and Bonferroni post hoc tests (looking at the comparison with the 2., 3., 4., 5. and 6. stripes: average deviation: 0,60; 0,77;
0,82; 0,63; p≤0,001). The other stripes analysed separately did not differ from each other. Pellet counts within the individual stripes showed a rather big standard deviation, this is the reason why there was no significant difference between the other stripes.
However, when the pellet counts from stripes 40-80 meters away are added up and other stripes being 0, 20 and 100 meters away are combined as well, the two numbers already show difference. The question is that if the stripes are grouped together as mentioned above, will there be statistical proof to the
difference? For the two-sample experiment, since according to Levene’s test the variances of the two groups were not equal, it was necessary to adjust the degrees of freedom (df1 =94; df2 =85,65; t = -5,9, p ≤0,001). Stripes that are 40- 80 meters away had significantly more pellet-groups per hundred meters than the stripes being 0, 20 and 100 meters away (F = 7,88; p = 0,006).
Sampling was done up to 100 meters away from the fences, and there is an obvious increase in density at the distance of 40-80 meters followed by a decrease at larger distances. The Regression Power Function fits on these data very well (F = 54,52; p ≤ 0,001)
The strong significant match of the power function proves that up to the stripe at 60 meters away, as the distance increases, so does the density of pellet groups, followed by a decrease at larger distances.
After the analysis the question still remains: is the experienced drop of pellet density after the 80 meters distance only temporary, or there are similar tendencies at greater distances as well? To reverse the question, are there increased number of wild animal appearances close to the fence (about 60 meters away) compared to the large open areas?
Since the location of the stripes did not make it possible to study this question, a second set of data samples was collected. While processing the new data the stripe at zero distance was ignored, since the values recorded here can again be considered constant, they did not hold any new information compared to previous data sets. The random data sampling and their independence as described above are still valid. However, unlike the previous case, according to the drawn histogram and its Kolmogorov-Szmimov test (Z = 0,515; p = 0,953) as well, this time the data shows standard deviation without any transformation.
This means that when the original data was converted to piece/100 meters based on the length of the stripes, it was possible to work with it directly, without any corrections.
According to the Levene-test the equality of the variances is fulfilled, so it
is possible to use ANOVA here (F = 3,868; p = 0,02). There is significant difference between the stripes. Examining this further using a post hoc Bonferroni test, it is clear that the stripe 60 meters away is significantly differs from each of the 180m and the 240m stripes (Avg. deviation = 1,722, 1,756; p = 0,034, p = 0,3). In case of the latter there are more pellet-groups within the stripe at 60 meters. The regression power function explains the significant part of the data variation in this case as well (F = 5,81, p = 0,007). The increase of the pellet group density, however, is clearly shifted towards the stripes at smaller distances.
Examining wild-pass “utilization”
Based on the Mann-Whitney test there was no difference with regard to track density between the two examined section of the marked path of the highway prior to the construction (Z = -0,558; p = 0,577 ).
However, when those two sections were compared based on the combined data of two already built wild passes on each of the sections, the difference was significant (Z = -4,514; p < 0,001). Of the entire “deer-traffic” counted earlier, only a small fraction remained and spread between the constructed wild passes.
This change of course clearly shows in the statistical calculations as well (Mann- Whitney U test Z = -1,755; p = 0,79).
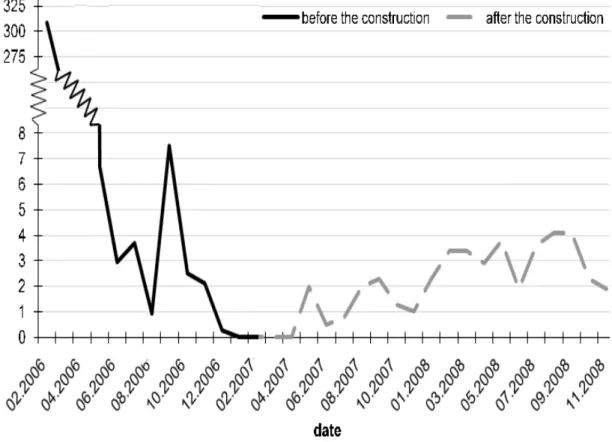
In the time period from the beginning of December 2006. until end of January 2007. the number of tracks completely crossing the highway was practically zero. This is the time when -- except for the already existing wild passes -- the road was fenced off. After this time period the deer’s presence was detectable again on the completed wild passes. In the following diagram (figure 4) the individual sections and wild passes are not separated, their data is combined. The big difference between collected data (at the start and end of the
data collection period) made it necessary to “cut out” part of the diagram to make it presentable. This way one diagram is able to cover the whole data- sampling time period. The domain of the ‘Y’ axis spreading from 0 to 325 nicely represents how wide the the range of the recorded data is. The diagram also shows a slow increase in the number of tracks after the wild passes were built, and how their total number was still only a small fragment of the number before the construction (Figure 1)
Figure 1. Comparison of deer track counts before and after the construction of wildlife crossings
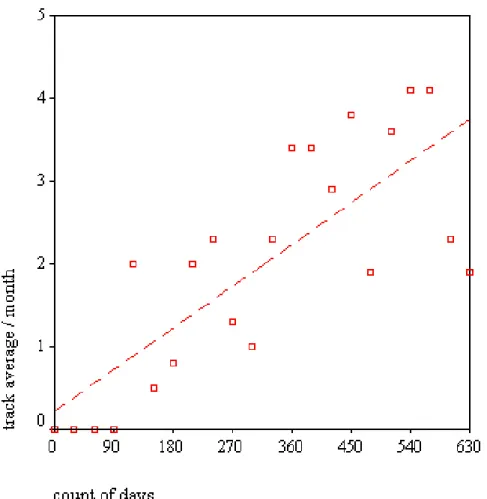
Applying Spearmann rank-correlation the author was looking for a connection between the number days passed since the entirely deer-less time period, and the number of recorded tracks. The trend line on figure 5 (scatter type) and the statistical analysis also shows that there is an obvious connection between the amount of time passed and the amount of deer movements (correlation coefficient = 0,76; p < 0,001). It is also visible on the diagram that the number of tracks increased as time passed (Figure 2).
.
Figur 2. Deer track density progress in time,
after the deflecting fences of the given section were set up
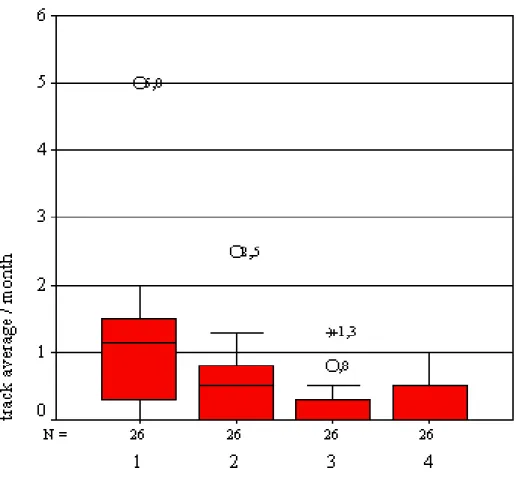
The four different passes are used of course at a different extent by deers. The diagram below shows how the number of tracks spread among the four constructed wild passes in the examined time period. The Kruskall - Wallis non- parametric test proved that the widest pass had significantly higher “deer-traffic”
than the others at the same time (H = 23,509; p < 0,001) (Figure 3).
Figure 3. Comparison of monthly averages of deer track frequency recorded in each of the crossings
Finally, the only examined over-pass was compared to the under-pass within the same section to get a picture about deer movements on the two different types of passes. The result of Mann - Whitney U test did not show significant difference between the two pass types in this regard (Z = -0,041; p = 0,967).
6. Evaluation of results, conclusions, recommendations
Methods for estimating the size of a population, like counting pellet groups and tracks as it was done in this study, are suitable for examining how the passes are used. On the other hand, they are also able to examine the behaviour of wild animals in cases when they are not moving in open and unblocked areas, but for some reason -- possibly forced to -- approach otherwise avoidable or crossable artificial obstructions. Since the number of such objects are increasing continuously, it is important to study how wild animals avoid or sometimes cross them. It is also important to understand in what way or how fast can the animals be “expected” to get used to them.
Examining the density of pellet-groups located within the immediate vicinity of forest or agricultural fences it is evident that the vast majority of deers avoid them at a distance of 40-80 meters. This study did not detect any connection between this behaviour and the size of the fenced off area. Based on these results, when fences are planned and built, a 60 meters wide stripe along the fence should be considered as an area directly influenced by it. It is unavoidable that the ever increasing number of fences built for different purposes will get closer and closer to each other. More and more frequently, and at increasing number of locations, this leads to the very important question
whether there is actually enough room left for an escape route for deers wandering into such areas.
On the other hand these results raise an other question as well: does the relatively increased density mean a larger browse damage compared to the surrounding areas? This study did not permit to research this topic further, but doing so at a later opportunity would have great benefits.
Planning, building and maintaining wild passes and protecting fences on and around highways cost a significant amount of money. Highway construction and maintenance is strictly regulated by standards and the law. All these mean that it is fundamental to know their effectiveness and to monitor their usage.
Based on the results of this study it is clear that wild animals did not start using the passes immediately after their construction, because they could get around the fenced off area towards the construction site continuously moving away. A similar “avoiding” behaviour was observed by Clevenger and his colleagues (2001) when the fences along a highway were built in two waves.
The results of the study show that the deers were following the avoiding-strategy while the energy needed to do so was worth it, after that they were basically forced to use the wild passes.
It was also suspected that the construction work was effecting the usage of the passes. Servheen (2003) and Kusak et al. (2009) found positive correlation between disturbance and the wild pass usage. In their case as well, those wild passes were used the soonest that were the most further away from the still ongoing but continuously moving away construction site.
The mentioned two effects explains why the wild passes on the first half of the examined section were used sooner. If the assumtion is correct, after the construction of the M7 highway is completed, this difference should disappear.
However, if the explanation of this phenomena is related to the preferred type or location of wild passes, then the difference will continue to be detectable. To answer these questions, further research and data-collection would be necessary.
During and after the construction the movements of wild animals decreased significantly, and for a few months it dropped to a small fraction compared to data from before the construction. Based on the low usage of wild passes, it cannot be determined that the chosen location or the construction of the passes were wrong, because the animals need time to get used to them (Clevenger and Waltho 2003). However, the aim must be to decrease the avoiding behaviour pattern of the wild animals that has been strengthened by the changed environment. It is easy to see that animals will not consider a 15 - 17 meters wide pass (two of the examined wild passes are within this width range) as a potential crossing point, especially since they will not even approach it due to the existing fences and artificially changed environment during the construction.
In the second part of the study, data collected along forest fences also showed that deers will approach fenced off areas only as close as about 60 meters. This situation can be definitely helped by extending the crossing “holes” with deflecting fences forming a cone to let the animals experiment and get used to the new conditions.
Among the examined passes there was only one -- the so called
“becsehelyi” or “canal - train underpass” -- that had continuous, although seriously decreased amount of wild animal traffic, even during the construction.
This pass was not specifically built for wild animals. This is the only one of the four passes that's main purpose is to provide a crossing point for a railway and an open water-canal. However, because of these two main purposes, this pass is by far the tallest and widest among the examined passes. This fact also points out that passes do not necessarily have to be built for wild animals specifically.
Multi-purpose passes can be more economical and have larger parameters than passes designed specifically for wild animals. This way animals will also prefer them to other passes.
7. Thesis summary
1. Counting pellet-groups proved to be a suitable method for examining the behaviour of wild animals even in special cases when they were not moving on open, unblocked areas, but approached otherwise avoidable or cross-able
artificial barriers to a few 10 meters.
2. The deers will not approach fences closer than 40 - 80 meters if they can avoid them physically. The detectable presences of deers decreased both closer and further away than this distance.
3. Regarding the size of the fenced off area, there is no difference (neither in population density within the immediate vicinity of fences, nor in the standard deviation of the density) between larger (around 350ha) or much smaller (15- 30ha) areas.
4. On the examined two sections of the already marked path of the not yet constructed highway the number of crossing wild animals was the same.
However, the same two sections showed a distinct difference based on data of the already constructed wild passes.
5. On a highway section that is being constructed, while it is still possible to get around the construction, the deers will not use the already built passes, or only to a small extent.
6. Compared to preliminary data, wild animal traffic dropped significantly during and a few months after the construction.
8. Used literature
Bissonette, J. A. (2002): Scaling roads and wildlife: the Cinderella principle, Z.
Jagdwiss., Supplement, 48: 208-214
Borkowski, J. (2004): Distribution and habitat use by red and roe deer following a large forest fire in South-western Poland. Forest Ecology and Management 201: 287-293
Clevenger, A. P., Chruszcz, B. és Gunson, K. E. (2001): Highway mitigation fencing reduces wildlife-vehicle collisions, Wildlife Society Bulletin 29(2): 646-653
Clevenger, A. P., Waltho, N. (2003): Long-term, year-round monitoring of wildlife crossing structures and the importance of temporal and spatial variability in performance studies, Proceedings of the International Conference on Ecology and Transportation 2003, 293-302
Clevenger, A. P., Waltho, N. (2005): Performance indices to identify attributes of highway crossing structures facilitating movement of large mammals.
Biological Conservation 121 (3): 453-464
Härkönen S., Heikilä R. (1999): Use of pellet group counts in determining density and habitat use of moose Alces alces in Finland. Wildlife Biology 5 (4): 233-239
Kusak, J., Huber, D., Gomercic, T., Schwaderer, G., Guzvica, G. (2009): The permeability of highway in Gorski kotar (Croatia) for large mammals, European Journal of Wildlife Research 55: 7-21
Nagy E., Bíró G. (szerk.) (2007): Vadkár – A vadgazdálkodás időszerű kérdései (7.) Dénes Natúr Műhely 78pp.
Náhlik, A. (2004): A gímszarvas-gazdálkodás ökológiai és ökonómiai szempontú racionalizálása. Kutatási részjelentés Nyugat-Magyarországi Egyetem Erdőmérnöki Kar
Neff, D.J. (1968): The pellet-group count technique for big game trend, census, and distribution: a review. Journal of Wildlife Management 32: 597-614 Ng, S.J., Dole, J.W., Sauvajot, R.M., Riley, S.P.D., Valone T.J. (2004): Use of
highway undercrossings by wildlife in southern California. Biological Conservation 115 (3): 499-507
Reed, R.A., Johnson-Barnard, J., Baker, W.L. (1996): Contribution of roads to forest fragmentation in the rocky mountains. Conservation Biology 10(4):1098-1106
Smith, R.L. (1990): Student Resource Manual to Accompany Ecology and Field Biology. Harper and Row, New York.
Servheen, C. (2003): A sampling of wildlife use in relation to structure variables for bridges and culverts under I-90 between Alberton and St. Regis, Montana, Proceedings of the International Conference on Ecology and Transportation 2003, 331-341
Taylor, B.D., Goldingay, R.L. (2003): Cutting the carnage: wildlife usage culverts in north-eastern New South Wales. Wildlife research 30 (5): 529- 537
9. Other publications, presentations
List of the publications related to the topic:
Ballók, Zs.(2004): A vadállomány becslésének módszerei. Erdélyi Nimród, (6)4: 26-27.
Ballók, Zs (2004).: A vadállomány becslésének módszerei II. Erdélyi Nimród, (5)4: 26-27
Ballók Zs., Náhlik A., Tari T. (2010): Affects of building of a highway and wild crossings on land-use of red deer (Cervus elaphus). Acta Sylvatica &
Lignaria Hungarica 6: 67-74
Presentations:
Nyugat-magyarországi Egyetem Erdőmérnöki Kar, Kari Tudományos Konferencia, Sopron (2009): Az erdei kerítések „hatása” a gímszarvas mozgására
Ballók, Zs. (2011): A vonalas létesítmények szerepe a gímszarvas tér és élőhely használatában. - Előadás In: Tóth, M. & Puky, M. (szerk.): Vonalas létesítmények és élővilág: Hogyan létezhetnek egymás mellett? Vonalas létesítmények IENE Műhelytalálkozó. Program és kivonatkötet. Magyar Biológiai Társaság Környezet- és Természetvédelmi Szakosztály – Varangy Akciócsoport Egyesület, Budapest. 6-7.