H
AVASII
STVÁN, B
ARTHAG
ÁBOR,
I NTRODUCTION TO GIS
1
I. I
NTRODUCTIONTOG
EOINFORMATICS1. G
EOINFORMATICSANDG
EOGRAPHICALI
NFORMATIONS
YSTEM(GIS)
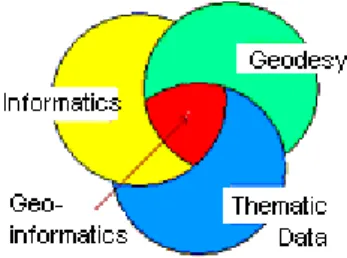
Geoinformatics is a new branch in technical sciences. It has been developed from informatics and geodesy as specialized information technology to work with different thematic data which have reference to geographic location (Fig. 1.1.1). The object of geoinformatics is to store, visualize and analyze these data by computer. Geoinformatics is an indispensable tool for planning and monitoring social, economic and technical processes and is at the same time a progressive technical science focusing on its theoretical and technical background.
Fig. 1.1.1. Geoinformatics and background sciences
There are other suitable definitions for geoinformatics. One of them as follows: geoinformatics is a technical science where the geometrical properties of a basic unit called an entity are treated together with the connected database by several applicable analyses and the results are visualized in graphic form. The entity is the smallest unit in geoinformatics. Let’s see some examples for an entity. Trees should be considered as entities in a Geographical Information System targeted to the trees of the park on the University of Miskolc campus. However, the species of trees are the entities in another system developed to target the species of trees in the forests of Bükk Mountains.
Therefore the entities in GIS are determined by their object. Although the term entity is used in geoinformatics, here the better-known geoobject will be used.
The dynamic progress of geoinformatics is strongly connected to the rapid development of information technology, especially computer graphics. The importance of geoinformatics is indicated by the GIS World Day. It was initiated by ESRI (the Environmental System Research Institute – one of the first commercial firms in geoinformatics) 10 years ago and since then several professional events have been organized for students of high schools and universities in several countries on this November day in every year. The Department of Geodesy and Mine Surveying of the University of Miskolc also organizes events suitable to the occasion.
The problem solving of geoinformatics is accomplished in Geographical Information Systems. These are specialized information systems containing the conceptual model and the computer program package for problem solving, the geographical location dependent thematic data, furthermore the hardware and software means to visualize, store and analyze the data.
The process of preparation of a GIS is depicted in Fig. 1.1.2 in detail. The first step is to establish an geoinformation model composed from a conceptual model and the pretreated thematic data. The problem is laid out and the concept of the solution is formulated in the conceptual model and then the thematic data are prepared accordingly. The conceptual model and the thematic data are the basic elements of the geoinformation model that is used for program development. Beside data management, visualization and the analytic operations are also included in this model. The second step is to develop the computer package of a GIS specialized to the problem and to complete it with a user interface. This step is accomplished in a GIS-IDE. The third step is to set up the developed package in the appropriate hardware and software environment. The software environment is frequently identical to the developing GIS-IDE.
However, GIS-IDE software companies usually provide free, so-called viewer programs to run a GIS package developed by their IDE product. Obviously, no transformation or development can be done in the environment of a viewer program.
Fig. 1.1.2. Process of developing a GIS
Valuable information can be produced for complex planning and management in professional fields that deal with tasks are related to geographical locations. This information is given by the analysis of geoobjects describing the real word in a geoinformation environment provided by a GIS. The structure and the role of a GIS in decision making is depicted in Fig. 1.1.3.
Fig 1.1.3. Structure and role of GIS
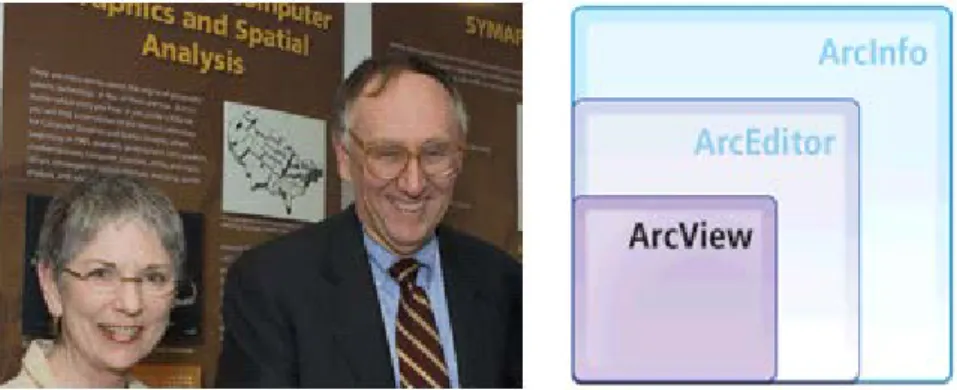
The first GIS related to a large territory was developed for cadastre and planning land use in Los Angeles, USA, in 1970. The lion’s share of the project was accomplished by ESRI Inc. (Environmental Systems Research Institute, Inc.), established by Jack Dangermond and his wife Laura in Redlands, California, in 1969. The first commercial GIS-IDE was developed here and this firm has been the first player in the GIS business since then. The file system introduced by ESRI has become a non-official standard in the GIS world. Recently several other GIS-IDE packages are available on the market beside ESRI’s products, but all of them can import and export ESRI GIS files.
Fig. 1.1.3. Laura and Jack Dangermond, and ESRI’s product line
2. GIS
STRUCTUREA GIS is composed from three elements, namely: hardware, GIS software and the developed GIS package (see Fig.
1.2.1).
Fig. 1.2.1. GIS structure
The basic element of the hardware is the desktop computer or the computer network composed from one or more server(s) and connected workstations. The GIS software is usually developed for several platforms (Windows, UNIX, MAC OS) and for desktops and networks as well. The most popular is the desktop program, although the users of larger companies prefer the more economical network versions when one frame program is run on the server and several users can access it simultaneously via workstations. The file system of a multifunctional GIS package related to a larger area claims a huge capacity of memory, therefore the computers are equipped with external data storage facilities, usually with magnetic storage devices. The result of operations in a GIS is usually one or more thematic maps. Beside their digital and screen image the printed versions are also claimed several times (for printed reports, archives, etc.). Therefore, high resolution plotters are important elements of GIS hardware. The thematic data related to geographical locations are frequently available as printed maps. They must be digitalized to prepare the input data for a specialized GIS. Consequently, high resolution scanners suitable for scanning large-size pictures are also important components of GIS hardware.
A GIS frame program should run on the hardware to manage the file system of a developed GIS. Two types of frame programs are available for managing the file system of a GIS. The first type is the GIS-IDE where, besides program development, file management and programmed operations can be executed as well. The second type is a GIS viewer frame, usually freeware, that does not have development functions. Recently "hybrid" freeware programs have appeared which were developed as viewer programs but were later fitted with developing functions by a dedicated Internet community.
The central element in a GIS is a set of files related to the geoinformation model of GIS. One segment in the set is composed from files describing digital maps. The maps contain the geoobjects that are appropriate to the thematic data and the corresponding color table. Points, lines and areas are used to visualize the geoobjects (Fig. 1.2.2). The identical geoobjects (e.g. roads) are depicted on one map while another type of objects (e.g. buildings) is depicted on a separated one. These maps are called layers and they can be visualized separately or by superposing them in GIS (see animation Fig. 1.2.3).
Fig. 1.2.2. Representing geoobjects by points, lines, polygons (areas)
ANIMATION
Fig. 1.2.3. Layers in GIS
A digital map of one layer in the "not official standard" ESRI format is represented by three files. The most important is the so-called shape file, which has the extension .shp. This file contains the geographical coordinates of geoobjects in vector form and the color table. The index file connected to the shape file is supplied with the extension .shx and its role is to decrease the execution time of the operations where the shape file is involved. The third file is a database file with the extension .dbf. Character (or recently also graphical) data relating to a geoobject are included in a record of this file. The stored data can be visualized with a click on the geoobject in a layer map. The file extensions mentioned above are different in other GIS-IDE packages than in ESRI’s packages, but their logic is identical.
Besides the technical elements of GIS, the human element must not be forgotten. The technical means cannot be used without appropriate experts in information technology, geodesy and the specialists of the targeted thematic sector. An innovative, motivated staff with updated knowledge is the most important asset in GIS development.
3. G
EOINFORMATIONMODELSA geoobject (entity) is a set of geographical points having identical thematic data (e.g. a lake, a building, etc.). The
digital image of a geoobject is called a geomodel. The geo-information model is the totality of geomodels which have been introduced on a given territory to solve a geoinformation problem.
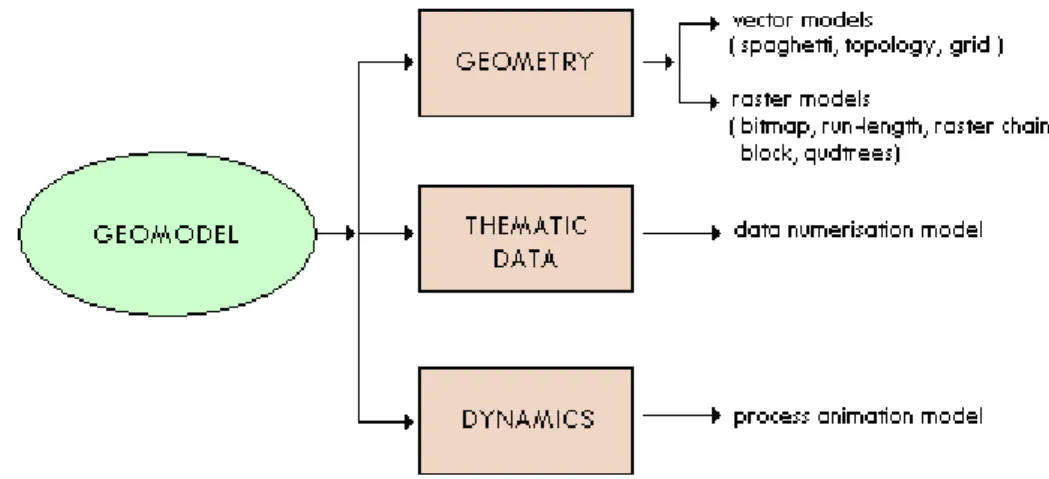
Three features of geoobjects are described by three types of geomodels, namely:
1. geometry, 2. thematic data,
3. dynamics (see Fig. 1.3.1).
Fig. 1.3.1 Types of geomodels
The geographical position of the points, lines and polygons of geoobjects are described in the geometric models. The description has two forms: vector and raster. The geometric vector model holds the coordinates of points, lines and vertices of polygons in some geographical system. The coordinates are stored in compressed form using different coding systems. There are spaghetti, topology and grid models in accordance with the applied coding techniques. The raster geometric model is a digital image stored usually also in compressed form. In accordance with the compressing method there are run-length, raster chain, block and quadtrees model.
The thematic data relating to geographical positions are the most important type of geomodels. The object of GIS in essence is to store, visualize and analyze these data. There are two sorts of data model, namely restrictive and non- restrictive. The first is either a binary or multiple-choice system while the latter one is always a multiple-choice system.
The numerisation model of a binary system is simple since it has either two values, 1 and 0. It is more complex in the case of multiple-choice systems. The data, regardless of whether they are numerical or not, are grouped in classes and a number is coupled to each class. Colors are also assigned to classes for graphical visualization in color tables.
The time variation of geomodels is described by a series of interlaced maps. The preparation of this kind of animation is tiresome and time-consuming work, and therefore is rarely applied in practice.
The problem-solving mathematical model of a geoinformation problem is the mathematical phrasing of the conceptual model. The conceptual model describes the target, the relevant thematic data including their optimal values corresponding to the target. The task is to find those geographical locations where the "common optimum" of values appears. The mathematical model contains the identification, characterization, and numerisation of the relevant data and a composite object function f (T(x)) where the geographic location is denoted by x and the thematic data by T(x).
The extrema of the object function, i.e. the solution of the following equation:
d ( f (T(x)) ) / d x = 0 ,
is the sought locations. From a mathematical point of view it is an inverse problem. Since function T(x) is not known, the equation cannot be analytically solved. However, the graphical forms are given by geomodels, therefore a graphical solution is possible.
Shaping a geoinformation model
The flow chart for shaping a geoinformation model is depicted in Fig. 1.3.2 and the process is demonstrated by a playful model, "Happy Cows", elaborated by Miguel Calvo.
Fig. 1.3.2 Flow chart of the process of preparing a geoinformation model
1) Task: Where is the optimal pasture of cows that makes them happy (therefore provides the owners the maximum yields of milk)?
2) The conceptual model: the optimal pasture should have good quality of grass and a close water source and should not have stony and sloping terrain.
3) The mathematical model of the problem is developed in two steps:
Identification, characterization of relevant thematic data:
Cows do not like stony terrain (restrictive, binary)
Cows do not like sloping terrain (restrictive, multiple choice) Cows like a close water source (non-restrictive, multiple choice) Cows like good quality grass (non-restrictive, multiple choice) Numerisation and the object function:
Thematic Data Notation Character Value Numerical Value
Soil T restrictive stony
not stony
0 1
Slope L restrictive
greater than 20%
between 10-20%
between 0-10%
0 0.5 1
Water V non- restrictive
farther than 1 km between 0.5-1 km closer than 0.5 km
0.2 0.5 1
Grass quality F non- restrictive
medium good excellent
0.5 0.75 1
The object function f and the equations of extrema are:
f = T*L* (V+F)
T*L* d(V(x)+F(x)) / dx = 0
4) Since functions T(x), L(x), V(x), F(x) are not known, the above equation will be solved graphically in GIS. Four polygon geomodels (jigsaw map layer) will be developed:
a soil map layer with 2 categories of soil (stony, not stony);
a slope map layer with 3 categories of slopes (<10%, 10-20%, 20%<);
a water access map layer with 3 categories of access (1km<, 0.5-1km, <0.5km);
a grass quality map layer with 3 categories of grass (medium, good, excellent).
The solutions of the problem are the overlapping common areas (sections) of different models at different values. One value (1) is acceptable from the soil model, 2 values from the slope model and 3 values from the rest, i.e. 1x2x3x3=18 combinations for acceptable sections one can get. Obviously the best are the sections with the following parameters:
(not stony), (slope<10%), (water access<1km), (excellent grass). The demonstrating example is depicted in the animation shown in Fig. 1.3.3.
ANIMATION
1.3.1. Animation "Happy Cows"
4. A
REACOVEREDBYGIS
A GIS is classified according to the area covered. There are global systems covering the whole Earth, like environmental monitoring or resource exploration systems. The next level consists of regional systems. They were established to cover a larger region or a country. For example, the cadastre of Hungary belongs to this category.
Moving from larger to smaller territory, one arrives at the local systems. A GIS for the public services in a city can be mentioned here as example. Several professional sectors like mining and the petrol industry already have or are developing regional or local GIS connected to their fields. Accordingly, professional users more frequently use a regional or local level GIS, although the recent popularity of global Google-Earth GIS has started to change this tendency. The classification of GIS according to the covered territory is depicted in Fig. 1.4.1.
Fig 1.4.1. Classification of Geographical Information Systems according to the area of coverage
Obviously, the area coverage of a GIS is determined by the task to be solved. However, the coverage has an impact on the techniques of data acquisition and on the applied geometrical geomodel.
Digitális Egyetem, Copyright © Havasi István, Bartha Gábor, 2011