Application of the European Basic Safety Standards Directive in Underground Mines: A Comprehensive Radioecology Study in a
Hungarian Manganese Mine
AUTHOR AMIN SHAHROKHI
DOCTORAL SCHOOL OF CHEMISTRY AND ENVIRONMENTAL SCIENCES
SUPERVISOR
DR. TIBOR KOVÁCS (Ph.D.)
INSTITUTE OF RADIOCHEMISTRY AND RADIOECOLOGY UNIVERSITY OF PANNONIA
VESZPRÉM
2018
DOI:10.18136/PE.2018.696
Application of the European Basic Safety Standards Directive in Underground Mines: A Comprehensive Radioecology Study in a Hungarian Manganese Mine
Thesis for obtaining a PhD degree
in the Doctoral School of Chemistry and Environmental Sciences of the University of Pannonia
Written by:
Amin Shahrokhi
Supervisor: Dr. Tibor Kovács (Ph.D.)
I propose for acceptance ( yes / no ) ….…...….
(signature) The candidate has achieved ……….… % at the comprehensive exam,
I propose the thesis for acceptance as the reviewer:
Name of reviewer: …... yes / no
……….
(signature) Name of reviewer: …... yes / no
….……….
(signature) The candidate has achieved …... % at the public discussion.
Veszprém, ……….
Chairman of the Committee Labelling of the PhD diploma …...
………
President of the UCDH
I
DEDICATION
Thanks to my loving parents, who guided me to where I am today, who taught me that the best kind of
knowledge to have is that which is learned for its own sake, who taught me the way of life and who being my
guiding light in the darkness
This thesis is dedicated to my parents for their love, endless support and encouragement
،مردام و رد پ ،یهلا ه ت شر ف ود ه ب م ید ق ت هژاو چ ی ه ا پ نا ش تامحز هک تس ی ن ی نادرد ق ل پا ق یا
Amin Shahrokhi
II
ACKNOWLEDGEMENTS
I would like to express my special appreciation and thanks to my enthusiastic supervisor, Dr. Tibor Kovács, who without his patient guidance, teaching, insightful criticisms and
insightful ideas, this dissertation could not have been completed
Thanks to my committee chairmen for their countless hours of reflecting, reading, and most of all patience throughout the entire defence process
Thanks to Dr. József Kaizer, Dr. Janja Vaupotic, Dr. Zoltán Németh, Dr. Edit Tóth - Bodrogi and Dr. Ákos Horváth, the comprehensive exam committee members for their
patience time and consideration during exam time
Thanks to Dr. Norbert Kávási, and Dr. Begy Róbert Csaba for agreeing to review and be the references of the current thesis
Thanks to Dr. Miklós Hegedűs for the useful comments as a pre-reviewer of the current thesis, and thanks to all my colleagues in the Institute of Radiochemistry and
Radioecology at the University of Pannonia for their help
Thanks to Dr. Tamás Vigh as consultant of the current thesis
III
TABLE OF CONTENTS
DEDICATION ... I ACKNOWLEDGEMENTS ... II TABLE OF CONTENTS ... III LIST OF FIGURES ... V LIST OF TABLES ... VII
ABSTRACT ... 1
KIVONAT ... 2
РЕЗЮМЕ ... 3
INTRODUCTION ... 4
1.1. Basic of Radiation ... 5
1.2. Radon & Health Risk ... 10
1.3. Radon & Underground Miners ... 15
1.4. Radon & Dose ... 20
1.5. Radon & Regulations ... 25
1.6. Radon Monitor Devices ... 29
1.7. EU-BSS and Reuse of Manganese Ore Mining Residue ... 33
1.8. Background of the Study ... 35
MATERIALS AND METHODS ... 37
2.1. Description and Geology of Úrkút Manganese Mine ... 38
2.2. Radon in Air ... 44
2.2.1. Active Monitoring ... 44
2.2.2. Passive Monitoring ... 46
2.3. Gamma Spectrometry, Radon Emanation & Exhalation ... 52
2.3.1. Gamma Spectrometry ... 54
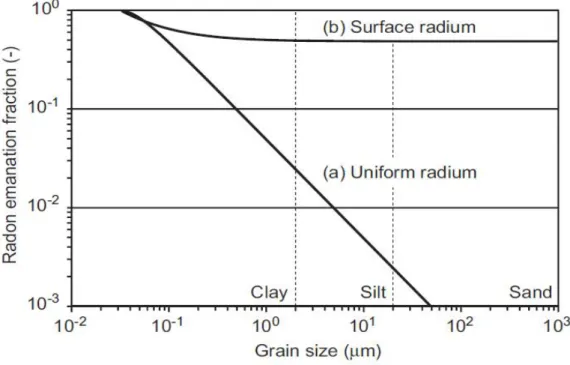
2.3.2. Determination of Radon Emanation Factor ... 56
2.3.3. Radon Exhalation ... 59
2.4. Radon in Water ... 62
2.5. Radon Exposure & Dosimetry ... 67
2.5.1. Radon Exposure ... 67
2.5.2. Determination of Attached, Unattached Fraction & Equilibrium Factor ... 69
2.5.3. Determination of Dose Conversion Factor ... 71
2.5.4. Estimation of Effective Dose ... 72
2.6. Manganese Ore Mining Residue ... 74
IV
RESULTS AND DISCUSSIONS ... 75
3.1. Routes of Radon Exhalation into the Mine Atmosphere ... 76
3.1.1. Radon in Mine Water ... 76
3.1.2. Radon Exhalation ... 84
3.2. Radon Concentration in Air ... 93
3.2.1. Radon in Air Passive Monitoring ... 93
3.2.2. Radon in Air Active Monitoring ... 98
3.2.3. Performance of New Developed Mitigation System ... 101
3.3. Radon Exposure & Personal Dosimetry ... 105
3.4. Manganese Ore Mining Residue ... 113
SUMMARY ... 117
BIBLIOGRAPH ... 120
THESES ... 128
TÉZISPONTOK ... 130
V
LIST OF FIGURES
Figure 1- Schematic image of radiation damage to cell ... 6
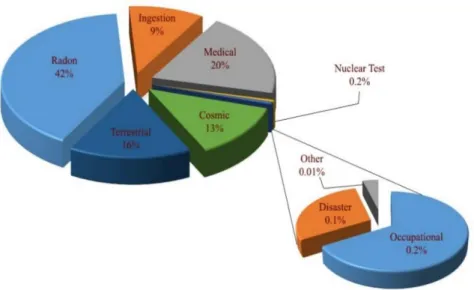
Figure 2- Radiation sources and distribution of average exposure to the population ... 7
Figure 3- The Uranium decay chain focusing on radon ... 9
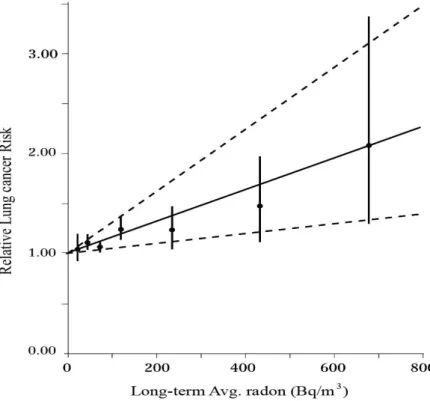
Figure 4- Correlation between radon exposure level and lung cancer risk ... 11
Figure 5- The series of steps from radon exposure to effective dose ... 20
Figure 6- Processes of defining attached & unattached progenies ... 21
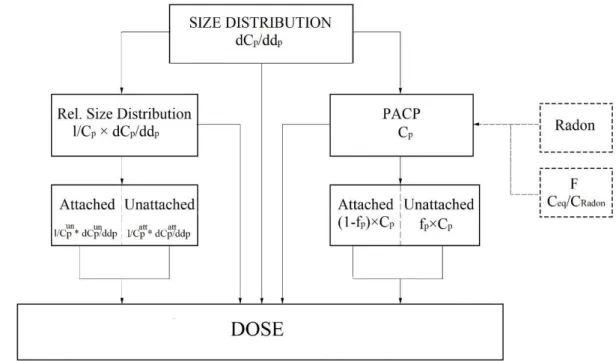
Figure 7- Parameters to estimate the dose from radon short-lived decay products ... 22
Figure 8- Unattached fraction vs particles surface area ... 23
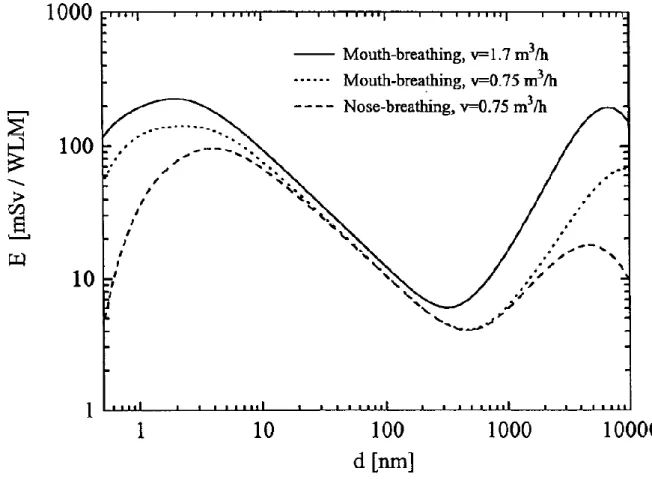
Figure 9- Dose conversion factors based on the breathing behaviour and particle size ... 24
Figure 10- TESLA radon monitor kit ... 30
Figure 11- Location of the Jurassic Manganese mineralization of Hungary ... 39
Figure 12- Scheme of Úrkút mine ventilation system ... 42
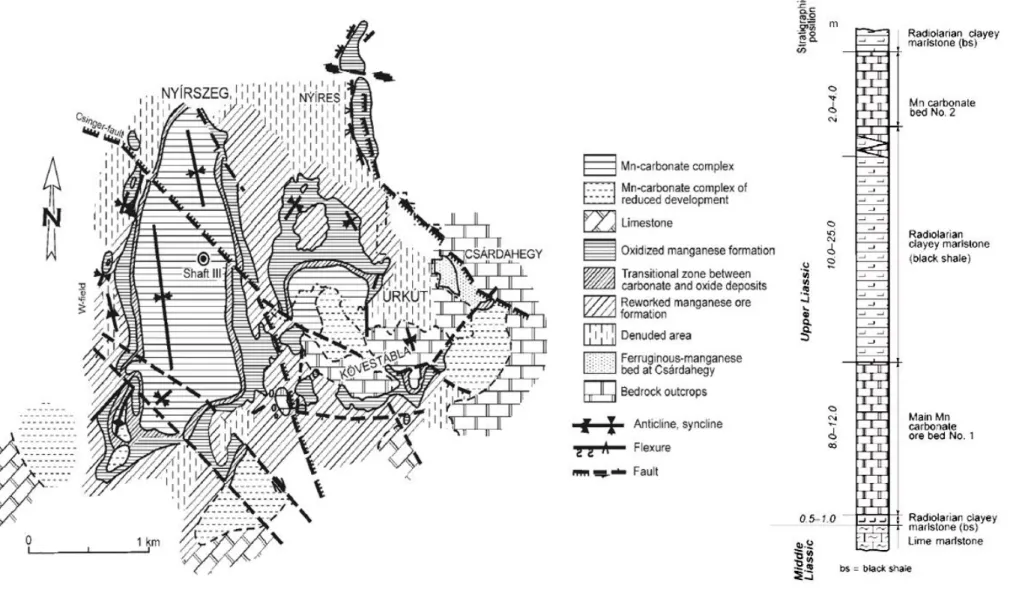
Figure 13- Idealized section and geological map of the Úrkút manganese mineralization . 43 Figure 14-Measurement locations using active radon monitoring ... 45
Figure 15- Passive radon measurement locations... 47
Figure 16- CR-39 Calibration System ... 50
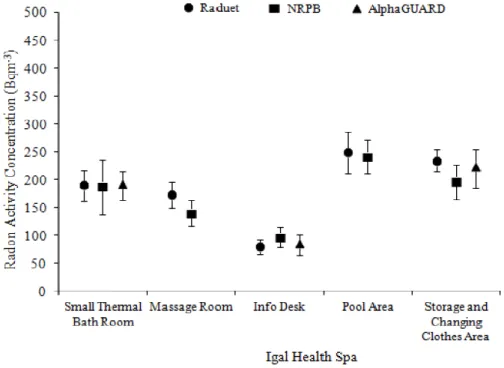
Figure 17- The performance of the three different radon detectors in Igal Health Spa ... 51
Figure 18- Megascopic of radon emanation, diffusion and exhalation process; ... 53
Figure 19- The gamma spectrometry efficiency graph ... 56
Figure 20- Microscopic scheme of radon emanation phenomenon and probability. ... 57
Figure 21- The relation between radon emanation fraction and grain size ... 58
Figure 22- Radon exhalation measurement based on the can method) ... 61
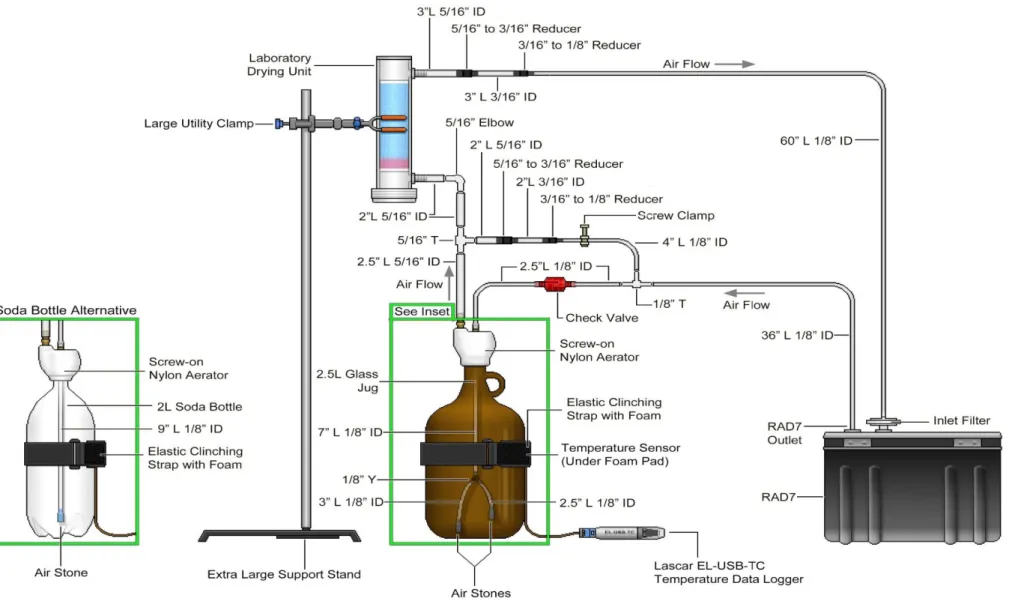
Figure 23- Rad7 radon monitor – Aqua kit to measure radon concentration in water ... 64
Figure 24- aerosol sampling head installed on SARAD EQF3220 ... 70
Figure 25- Influence of the unattached fraction (fp) on the DCF (E)... 71
Figure 26- Distribution of radon in the Úrkút mine water samples (Spring) ... 81
Figure 27- Distribution of radon in the Úrkút mine water samples (Summer) ... 81
Figure 28- Distribution of radon in the Úrkút mine water samples (Autumns) ... 82
Figure 29- Distribution of radon in the Úrkút mine water samples (Winter) ... 82
Figure 30- Released radon in function of the age of the broken wall ... 86
Figure 31- Distributions of K-40 concentration among the rock samples ... 89
Figure 32- Distributions of R-226 and Th-232 concentration among the rock samples ... 90
Figure 33- areal radon exhalation from the rock samples in terms of thickness ... 92
Figure 34- Integrated seasonal average radon concentrations the mine (Spring) ... 94
Figure 35- Integrated seasonal average radon concentrations in the mine (Summer) ... 94
Figure 36- Integrated seasonal average radon concentrations the mine (Autumns) ... 95
Figure 37- Integrated seasonal average radon concentrations the Úrkút mine (Winter) ... 95
Figure 38- Seasonal average radon concentration and outdoor temperature... 97
Figure 39- 5 days continues radon monitoring in measurement locations ... 99
Figure 40- Image of optimized mobile mitigation system at Úrkút mine ... 102
Figure 41- Performance of using mobile radon mitigation system; ... 103
Figure 42- A plot of 5 days unattached factor at three working locations ... 107
Figure 43- DCF values based on breathing behaviour and calculated the fun ... 109
VI
Figure 44- Morphological attributes as a function of firing temperature ... 113 Figure 45- Plot of cumulative pore volume and radon exhalation and emanation ... 114 Figure 46- Cumulative pore volume distribution of fired manganese clay ... 116
VII
LIST OF TABLES
Table 1- Lung cancer risk factors and their contribution towards causing lung cancer ... 12
Table 2- Rising the lung cancer relative to an increase of radon every 100 Bq·m-3 ... 14
Table 3 - Lung cancer rate among the miners in terms of radon exposure ... 16
Table 4- Summarized indoor radon concentration in the different mines ... 18
Table 5- Radon exposure and related lung cancer death rate (Colorado miners’ cohorts) . 19 Table 6- Historical updates on dose coefficient by ICRP ... 27
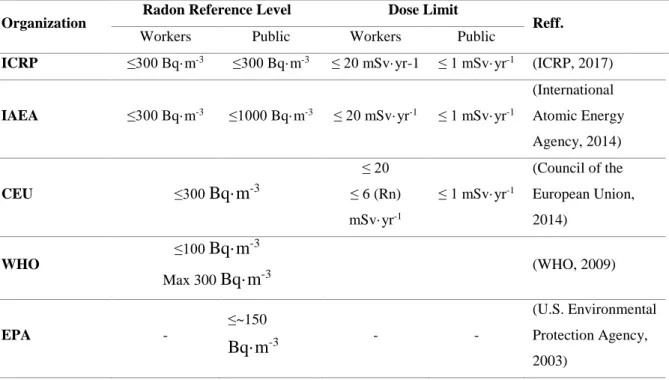
Table 7 - Radon reference level in workplaces and public area ... 28
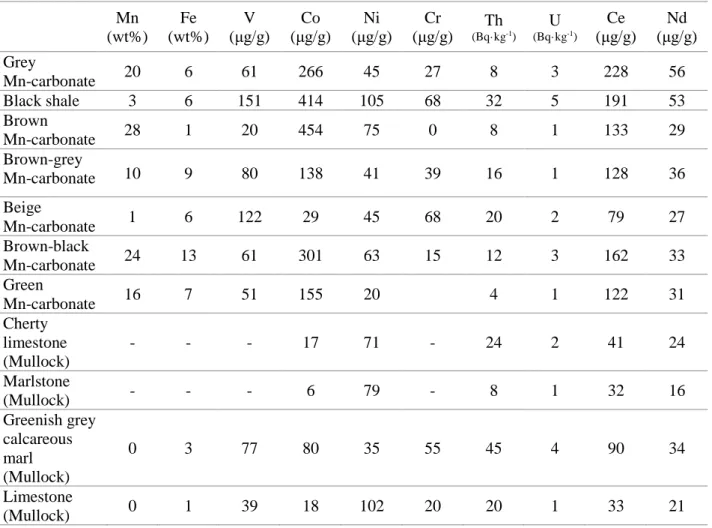
Table 8- The average values of element composition of the Úrkút manganese ... 40
Table 9- The specifications of the radon source (Pylon 2000A) used in this study ... 49
Table 10- The comparison of different methods for measuring radon in water ... 66
Table 11- Monthly concentration of radon in mine water at sampling locations in 2013 ... 77
Table 12- Monthly concentration of radon in mine water at sampling locations in 2014 ... 78
Table 13- Monthly concentration of radon in mine water at sampling locations in 2015 ... 79
Table 14- Statistical analysis of data corresponding to radon concentrations in water ... 80
Table 15- Surface radon exhalation from 5 different walls location in the Úrkút mine ... 85
Table 16- Concentrations of natural radionuclides in the mine rock samples (Bq·kg-1) ... 88
Table 17- Comparison of the Ra-226 and U-238 concentration among rock samples... 90
Table 18- Areal radon exhalation from rock samples in terms of sample thickness ... 91
Table 19- Seasonal & annual Rn-222 concentration in mine environment ... 96
Table 20- Compare the data obtained from this study with other studies ... 100
Table 21- Radon concentration after using optimised mitigation system (Bq·m-3) ... 104
Table 22- The radon concentration that miners were exposed in terms of months ... 106
Table 23- The Annual average of unattached factor in three working locations ... 107
Table 24- The annual average of equilibrium factor (F) at three working locations... 108
Table 25- The calculated DCF compared to the value given by ICRP (mSv·WLM-1) ... 110
Table 26- The effects of actual and recommended parameters on dose estimation ... 111
Table 27- Radon exhalation and emanation in terms of firing temperatures ... 114
1
ABSTRACT
The author carried out a comprehensive radioecology study in an underground manganese mine in Hungary, regarding recent changes on European Basic Safety Standard and the new introduced radon dose conversion factor by International Commission on Radiological Protection. The annual integrated averages radon concentration in the whole mine area measured using CR-39 based detector (NRPB) as 824±42, 874±45 and 1050±85 Bq·m-3 for years 2014, 2015 and 2016, respectively; Radon concentration during working hours using AlphaGUARD and TESLA measured between 450±65 and 650±83 Bq·m-3. The author measured the average dissolved radon concentration in the mine water samples as 3±0.4 Bq·L-1, regarding to the low contact surface of water and forced ventilation capacity, this route of entering radon to the mine air is negligible. The areal radon exhalation from mine walls at 5 different galleries using based CR-39 can method (radon accumulation chamber) measured in the range of 0.7±0.1 and 1.5±0.2 mBq·s-1·m-2. Using gamma spectrometry (HPGe detector) the black shale, underlayer black shale and carbonate ore show high values of Ra-226 compared to other samples, additionally the highest exhalation rate found from these three rock types. The author found that exactly after mining activity, radon increase dramatically with an average about 5900±420 Bq·m-3; Therefore, the ore fragmented during the course of mining operations stated as the main route of entering of radon into the mine air. Using the new developed mitigation system, radon concentration successfully reduced on that specific area to below 300 Bq·m-3 with an average of 250±41 Bq·m-3. During working hours, the annual average unattached and equilibrium factor measured using SARAD EQF3220 and Pylon WLx, at workplaces where selected miners for dosimetry were mainly worked, calculated between 0.15±0.04, 0.3±0.05 (average of 0.21±0.04) as unattached factor, and between 0.35±0.1 and 0.55±0.2 (average of 0.42±0.1) for equilibrium factor. The annual exposures to radon measured using personal dosimetry between 247±31 and 277±36 Bq·m-3 with an average of 261±33 Bq·m-3 for 10 miners; The dose conversion factor (DCF) calculated based on the field measurements between 16±9 and 25±10 mSv·WLM-1 (average of 20±9 mSv·WLM-1). Then, the calculated DCF applied to estimate the effective dose in the range of 5.6±0.7 to 7.6±0.9 mSv·y-1 (geometric mean: 6.7±0.9 mSv·y-1). The author found in the radioecology point of view, the manganese mining residue can be reused in building material industries (brick production, ceramic industry).
2
KIVONAT
A szerző egy átfogó radiológiai felmérést végzett el az úrkúti mangánbányában a radonra vonatkozó új nemzetközi ajánlások (EU irányelv – új referenciaszint, ICRP – dózisbecslési paraméterek) miatt. 2014 és 2016 között CR-39 nyomdetektorokat alkalmazva meghatározta a bányában az éves radon koncentrációt, amely rendre 824±42, 874±45 és 1050±85 Bq·m-3 volt. Folyamatos mérési módszerrel (ALPHAGuard, TESLA) meghatározta a munkaidőben mérhető átlagos radon koncentrációt (450±65 – 650±83 Bq·m-3). A radon lehetséges származási helyét keresve megvizsgálta a vízben oldott radon értékét, amely átlagosan 3±0,4 Bq·L-1-nek adódott. Ezt, valamint a kicsi érintkezési felületet a víz és levegő között, valamint a mesterséges szellőztetés mértékét megállapította, hogy a vízből a levegőbe jutó radon mennyisége elhanyagolható. Passzív mérési módszert alkalmazva meghatározta 5 különböző vágatban a bányafalból történő radon exhalációt, amelynek értékei 0,7±0,1 és 1,5±0,2 mBq·s-1·m-2 közé estek. A bánya geológiai struktúráját alkotó kőzettípusokat gamma-spektrometriával vizsgálta. Az eredmények alapján megállapította, hogy a fekete pala, fekürétegi fekete pala és karbonátos érc, amelyek a bányászott érc fő alkotói, nagyobb mennyiségben tartalmaznak természetes radioknuklidokat, összehasonlítva a meddőkőzetekkel. Emellett a radon exhaláció értékek is magasabbak. A szerző meghatározta a radon koncentráció értékeket az aktív bányászati tevékenységeket követően a levegőben és jelentősen megnövekedett értékeket kapott (5900±420 Bq·m-3). Ezeket figyelembe véve megállapította, hogy a bányalevegőben lévő radon fő bejutási útvonalai a frissen hajtott vágatok. A szerző kidolgozott egy új radon szint csökkentő beavatkozási módszert, amelyet alkalmazva a koncentráció sikeresen lecsökkenthető 300 Bq·m-3 alá (átlagosan 250±41 Bq·m-3). A szerző meghatározta a bányalégtérben a tapadt és nem tapadt frakció arányát (0,15±0,04 – 0,3±0,05) SARAD EQF3220 monitorral és az egyensúlyi tényezőt (0,35±0,1 – 0,55±0,2) a Pylon WLx alkalmazásával. CR-39 alapú személyi doziméterrel meghatározta 10 bányász esetében az éves radonexpozíciót (247±31 és 277±36 Bq·m-3). A terepi mérések alapján a szerző meghatározta a dóziskonverziós tényezőt (16±9 és 25±10 mSv·WLM-1). A saját eredményei alapján kapott paraméterekkel elvégezte a dózisbecslést, ahol az éves effektív dózis 5,6±0,7 és 7,6±0,9 mSv·év-1 közé esett. A szerző megvizsgálta a bányában keletkező meddő újrafelhasználásnak lehetőségét radioökológiai szempontból.
Megállapította, hogy a visszamaradt agyag felhasználható az építőanyag gyártásban (pl.:
téglagyártás).
3
РЕЗЮМЕ
Автором было проведено комплексное радиоэкологическое исследование подземных разрабатываемых месторождений марганца в Венгрии с учетом последних изменений Европейских Основных Стандартов по Безопасности и недавно введенных коэффициентов перерасчета дозы радона. Ежегодная интегрированная средняя концентрация радона в области месторождения, измеренная с помощью детектора на основе CR-39 (NRPB), составляла 824±42, 874±45 и 1050±85 Бк·м-3 в 2014, 2015 и 2016 г соответственно; концентрация радона во время рабочего времени, измеренная AlphaGUARD и TESLA TSR2 равнялась 450±65 и 650±83 Бк·м-3. В образцах шахтной воды автором была измерена концентрация растворенного радона, она составила 3±0.4 Бк·л-1, вследствие небольшой поверхности соприкосновения и мощности искусственной вентиляции, влияние данного источника на общий уровень радона в воздухе шахты является незначительным. Поверхностное выделение радона шахтными стенами, измеренное в 5-ти галереях методом на основе CR-39 (камера накопления радона), колебалось в диапазоне от 0,7±0.1 до 1,5±0.2 мБк·с-1·м-2. Гамма- спектрометрия (детектор ОЧГ) темных сланцев, подстилающих темных сланцев и углекислой руды показала высокие значения Ra-226 в этих трех типах пород по сравнению с другими образцами, а также повышенный уровень выделения и эманации. Автор обнаружил, что именно после горной деятельности уровень радона резко возрастает и его среднее значение достигает 5900±420 Бк·м-3; поэтому руда, фрагментированная в ходе горных работ указывается как основной источник радона в воздухе шахты. После использования новой разработанной системы снижения концентрация радона на этой территории успешно снизилась и не превышала 300 Бк·м-3, средний показатель составлял 250±41 Бк·м-3. В рабочее время средний свободный и равновесный коэффициент измерялся с использованием SARAD EQF3220 и Pylon WLx на рабочих местах, где работали отдельные шахтеры для личной дозиметрии, показатели составили 0,15±0,04 – 0,3±0,05 (средний 0,2±0,04) и 0,35±0.1 - 0,55±0.1 (средний 0,2±0,1) соответственно. Ежегодная экспозиционная доза радона, измеренная при личной дозиметрии, составляла от 247±31 до 277±36 Бк·м-3, среднее значение - 261±33 Бк·м-3 для 10 шахтеров; Коэффициент перерасчета дозы составлял 16±9 - 25±10 мЗв·WLM-1, со средним значением 20±9 мЗв·WLM-1. Эффективная доза рассчитывался в диапазоне от 5,6±0,7 до 7,6±0,9 мЗв·г-1 (среднее геометрическое 6,7±0,9 мЗв·г-1). Рассматривая результаты с точки зрения радиоэкологии, автор полагает, что остаточные продукты добычи марганца могут быть повторно использованы в производстве строительных материалов (кирпич, керамика и т. д.).
4
INTRODUCTION
5 1.1. Basic of Radiation
Radiation is a fact of life, where different radionuclides are inhaled or ingested by the human from the air, food, and water daily. Radiation is often categorized as either ionizing or non-ionizing depending on the energy of the radiated particles; Ionizing radiation is radiation that carries enough energy to liberate electrons from atoms or molecules (enough energy to break chemical bonds), thereby ionizing them. Examples of this type of radiation are cosmic rays, X rays and the radiation emitted from radioactive materials. Non-ionizing is a form of radiation that does not carry enough energy to ionize atoms or molecules (it is located at the low end of the electromagnetic spectrum), including electric and magnetic fields, radio waves, microwaves, infrared, ultraviolet, and visible radiation.
People are constantly exposed to ionizing radiations, which arise from both naturally occurring sources, also called background radiation (e.g. cosmic radiation, solar radiation, internal radiation and radon) and sources with an artificial origin, also called man-made sources (e.g. medical and nuclear medicine; military purposes; consumer products, nuclear power plants; human error and unplanned events such as power plant accidents) on a daily basis.
Exposure to ionizing radiation is divided into three type of exposure situations: 1- Existing exposure situations, which happens when the sources of radiation exist when a decision on control has to be taken; 2- Planned exposure situations, resulting from a planned operation or exposure from a source under a controlled activity where radiological protection can be planned in advance, and exposures can be reasonably predicted; 3- Emergency exposure situations, it happens when exposure arises from an unexpected event and an accident, when control of a source is lost (Unexpected situations that may require urgent protective actions).
However, exposure to radiation is categories by itself depending on exposure groups into occupational, public, and medical (International Atomic Energy Agency, 2014; ICRP, 2007).
Exposure to Ionizing radiation can result both cancer and non-cancer health effects on human, each of which differs greatly in the shape of the dose–response curve, latency, persistency, recurrence, curability, fatality and impact on quality of life. For dose limitation purposes, the International Commission on Radiological Protection (ICRP) has classified such diverse effects into tissue reactions known as non-stochastic/deterministic and stochastic effects (cancer/heritable effects). Reducing the risks of stochastic effects needs to
6
set an effective dose limits that it is based on the detriment-adjusted nominal risk coefficients, assuming a linear non-threshold (LNT) dose response and a dose and dose rate effectiveness factor (DDREF) of 2; However, equivalent dose limits aim to avoid tissue reactions (vision-impairing cataracts and cosmetically unacceptable non-cancer skin changes) and are based on a threshold dose (Nobuyuki & Yuki, 2014). In other words, deterministic effects have a threshold of dose and severity of the effect is dose-related, while, stochastic effects are a probability of an effect increases with dose, does not have a threshold of dose and severity of the effect does not related to dose.
The health risks of exposure to ionizing radiation are well known; Interacting a charged particle with a materials' atom and losing energy causing cellular tissue to become ionized or excited and produces charged water molecules. In other words, exposure to ionizing radiation may produce highly reactive chemically free radicals (e.g. hydroxyl radical), break chemical bonds and damage DNA as result of being directly ionized, or via interacting with free hydroxyl radicals; Figure 1. shows a schematic image of radiation damage to living cells. (International Atomic Energy Agency, 2004).
Figure 1- Schematic image of radiation damage to cell
7
Approximately 80% of human radiation exposure comes from naturally occurring sources, while the remaining 20% branches from man-made sources, while radon is the most significant source of natural radiation exposure to humans; Figure 2. Shows sources and distribution of average radiation exposure to the world’s population (UNSCEAR, 2010).
Depending on the type, energy of ionizing radiation and exposure time, the biological effects of radiation may vary from case to case. The risk of biological harm from radiation is the dose that human organs and tissues receive and known as an absorbed radiation dose called "Sievert" (Sv). Radiation toxicity involves exposure to ionizing radiation, most commonly in the alpha, beta and gamma which causes damage at the chromosomal and cellular levels.
On average, human radiation exposure due to all-natural sources amounts to about 2.4 mSv a year, however this amount might be changed to over than 4.2 according to new introduced ICRP radon dose conversion factor (but there is no any valid reference for this value) and it can vary depending on the geographical location and human activity divided into general population and workers.
In buildings (such as dwellings, schools, offices etc.) in addition to the radon from ground, the building materials (mainly bricks, types of cement, gypsum etc.) are a source of radiation exposure by releasing radioactive elements (Rn-222 and Rn-220, decays of radium and thorium) into the air;
Figure 2- Radiation sources and distribution of average exposure to the population
8
In workplaces, the exposure source can be divided into natural sources and man- made sources. In underground workplaces (such as mines, caves), addition to the background radiation, workers can encounter both external (gamma radiation from uranium and thorium series, and potassium in the ground) and internal (radon and thoron exhalates from the ground and their decay products) exposure to radiation (Australian Uranium Association and Australia. Department of Resources, Energy and Tourism, 2009;
International Atomic Energy Agency, 2014).
External doses occur when the body is exposed to radioactive material outside the body; this is primarily a concern for gamma radiation. Internal doses occur from exposure to radioactive material taken into the body by inhalation or ingestion; this is a main concern for radon and its alpha emitted decay products at workplaces.
The gamma radiation originates mainly from a few decay products of U-238 and Th- 232, particularly Pb-214, Bi-214, Ac-228, and Tl-208. Gamma rays are penetrating electromagnetic radiation travelling at great speed. Gamma rays do not have a charge or mass; they are a highly penetrating form of radiation that can cause secondary (indirect) ionizations when their energy is transferred to atomic particles such as electrons. In most exposure scenarios related to underground mining (especially uranium mining and processing), gamma rays may be a concern, the same as radon would be a radiation hazard.
Gamma radiation is the second source of indoor radiation exposure from building materials. It has the potential to increase the risk of cancer by varying degrees for most tissues and organs, however, gamma radiation has a much lower ionizing ability when compared to that of an alpha particle. During mining and processing operations, gamma emitted radionuclides in the ground, waste or tailings can produce a significant gamma radiation hazard in mines, near waste areas or tailings. Additionally, using mining residue – e.g. fly ash, phospho-gypsum, phosphorus slag, tin slag, copper slag, red mud (residue from aluminium production), clay (residue from mining such as manganese mining), residue from steel production – in industries to produce building materials can increase both external and internal indoor radiation exposure from building materials (Kovács, et al., 2017; Council of the European Union, 2014).
On the other hand, Radon with symbol "Rn" and atomic number 86 is a colourless, odourless, chemically inert, naturally occurring radioactive gas fairly soluble in water and organic solvents, and is a decay product of radioactive elements, such as uranium, which are
9
found in in soil and rock. Rn-220 (known as Thoron) and Rn-222 (known as Radon) are the most important isotopes of radon in view of radiation protection, as only these two isotopes of radon are found in significant concentrations in the environment. "Radon" is used to refer to Rn-222 (a decay product of Ra-226, Figure 3) and its short-lived decay products and, when focuses are specifically on the gas, it is referred to as Rn-222. Radon, as the heaviest naturally occurring gaseous element with a half-life of 3.8, is the most stable isotope among other isotopes of this family and it is a major contributor to the ionizing radiation dose received by the general population from natural origin sources. As radon is chemically inert, it has been used as a tracer in different areas of science, such as environmental studies. Rn- 222 exhalates from rocks, soils and building materials (as main sources), and accumulates in enclosed areas e.g. underground mines or buildings. Soil gas infiltration and building materials (mainly productions that use mining residue) are recognized as the most important sources of residential radon; however, water can be another source of indoor radon. (WHO, 2009).
Figure 3- The Uranium decay chain focusing on radon
Radon is a decay product of Ra-226, which is belong to the U-238 decay chain, therefore it seems to be obvious to correlate the ground/soil gas radon concentration with the activity concentrations of uranium and/or radium in the soil. Rnn-222 is the only gas formed during this series, thus, allowing it to move out of the rocks and soils where uranium/radium is typically found into the air.
10 1.2. Radon & Health Risk
Radon was classified as a human carcinogen by the International Agency for Research on Cancer in 1988 (IARC 1988). Radon is a lung cancer-causing gas, according to the World Health Organization in 2009, with the proportion of related radon-exposed, the lung cancers estimated between 3% and 14%, depending on the concentration of exposure, period of exposure and other committed risk factors; However, radon is not harmful by itself, as its short-lived decay products are responsible for most of the hazard.
Rn-222 is chemically inert, therefore almost all inhaled radon is rapidly exhaled, but short-lived decay products (Po-218 and Po-214) immediately deposit onto the tissue of the lungs, thereby densely ionizing alpha particles emitted by deposited decay products and interacting with biological tissue causing cellular tissue and DNA damage. (Lecomte, et al., 2014; U.S. Environmental Protection Agency, 2003). The atoms of radon short-lived decay products (either radon decay products generated during breathing or inhaled attached and unattached progenies from air) deposit in the bronchial tissue and continue to irradiate the lung tissues for prolonged periods. After alpha decay of radon, the newly generated short- lived radon decay products naturally tend to attach themselves to aerosol particles in the air e.g. dust, water molecules, etc.; This process is known as the "attachment process" and the decayed product after attachment process is referred to as an "attached progeny", if generated short-lived radon decay products remain as a cluster and are not joined with any existing aerosols, they are called "unattached progenies" and described by a parameter known as the unattached fraction; for furthermore details refer to section 1.4. at the current study and Figure 6.
The theory of cancer generally can be expressed as an uncontrolled growth of abnormal cells that have DNA damage, since even a single alpha particle can cause a major genetic damage to a cell via direct or indirect way, and exposure to radon at any level can increase significantly the risk of lung cancer (UNSCEAR, 2012). Regarding to the recent studies, it was indicated that the risk of lung cancer may increase by raising the exposure radon level, i.e. WHO stated that per each 100 Bq·m-3 increase radon concentration (on average, over time) the chance of developing lung cancer can increase by 16% (WHO, 2009); Hence, no advised level may exist to assure radon does not have the potential to cause lung cancer below a specific recommended level; For further details refer to Tables 2. & 5.
and cited published paper.
11
Radon-exposure is stated as the second most frequently reported cause of lung cancer, after tobacco smoke; Radon is an inevitable risk factor, thus it may significantly increase the risk of lung cancer among smokers (Tirmarche, et al., 2010); In the other words, in case of lung cancer risk, exposure to radon is inevitable, but smoking is an optional and avoidable factor, meaning "smoking may significantly increasing the risk of lung cancer next to the exposure radon level".
Figure 4. shows a relative risk of lung cancer versus long-term average residential radon concentration based on a European pooling study (Darby, et al., 2005).
Figure 4- Correlation between radon exposure level and lung cancer risk
From a public health perspective view, low and moderate radon concentrations are the most likely cause of lung cancers, rather than high radon concentrations, as generally fewer people are exposed to high radon concentrations, and exposure to high radon concentration for a long period can generally occur in case of occupational working in caves, underground mines, oil industries etc. To support this fact, a study had been done and indicated an inverse relationship between radon exposure level and the lung cancer rate; It was found that by exposing to moderate cumulative radon, lung cancer rates rose among the miners while it decreased again at high cumulative exposures. It was found that after exclusion of cumulative exposures above 3200 WLM, the lung cancer rate increased
12
approximately linear with increasing cumulative radon exposure. It could not be by chance as the size of the increment per unit increase in exposure varied by more than a factor of ten between the studies (BEIR, 1999; WHO, 2009). However, other factors also need to be considered for the increase of lung cancer rates, i.e. duration of exposure, breathing behaviour, size of the areole, distribution etc.
It was also found that not only is there an increase in the lung cancer death rate per WLM varied with time since exposure (as the most deaths happened in the period 5-14 years after exposure), but also varied with the exposed person's age, as the death rate due to lung cancer was higher at younger ages (BEIR, 1999; WHO, 2009).
Table 1. shows some risk factor and their contribution towards causing lung cancer among the general population, who are usually exposed to indoor radon (dwelling, office or enclosed publication area) mainly from building materials and the ground (Sethi, et al., 2012).
Table 1- Lung cancer risk factors and their contribution towards causing lung cancer
Risk Factor Contribution Lung cancer Relative Risk Smoke (Tobacco) 92% (Men)
78% (Women) 40
Radon 3% - 15% 2 - 10
Second-hand Smoke 2% - 3% 2
Genetic 1% - 3% 1 - 4
Studies using different modelling systems and risk factors were indicated that radon may cause 3 to 14% of all lung cancers in a single country, all depending on the risk factors such as smoke consumption, as well as the average radon concentration in a country. (World Health Organization, 2009). However, genetics (race) is not widely yet used as a risk factor in epidemiological studies, though it may count as an important risk factor. For example, if we look at Table 2, where the results of two different geographic studies are summarized, the relative increasing lung cancer risk per each 100 Bq·m-3 increase is not the same nor as in internal or international group, i.e. the risk between genders in both groups is not equal,
13
and this difference can even be seen in the same gender of different group; However, to state this idea, it is required to know if all conditions were the same at the time of studying between two groups.
It should be taken into consideration that risk of lung cancer due to radon is different between occupational (such as miners) and public exposure, as miners are generally also exposed to other lung carcinogens, i.e. aerosols, silica, Arsenic, mycotoxins and other hazardous chemical compounds exist on the ore. In addition to this is radon, which is a source of uncertainty in modelling and estimating lung cancer risk not only from the occupational radiation protection point of view but also with applying the epidemiologic studies of miners to the general population (Council National Research, 1999).
Table 2. shows summarized results of some international pooling studies about the risks of lung cancer from indoor radon (Krewski, et al., 2005; Krewski, et al., 2006; Darby, et al., 2005; Darby, et al., 2006).
There is no evidence to show that exposure to radon may have other side effects, such as other forms of cancer, respiratory diseases, or general physical symptoms (Darby, et al., 1995), however, some studies conducted a radon exposure causing diseases other than lung cancer; Harley & Robbins based on An epidemiologic study in Denmark from 1968 to 1994 found a weak, but statistically significant link between radon exposure and acute childhood lymphoblastic leukaemia (Harley & Robbins, 2009); Another study in the USA indicated that exposure to radon could be a significant risk factor for pancreatic cancer in several different American ethnic (Reddy & Bhutani, 2009). Additionally, according to Smith et al., and Řeřicha et al., further studies are required to find out if there is any relation between radon and leukaemia (Řeřicha, et al., 2006; Smith, et al., 2007).
14
Table 2- Rising the lung cancer relative to an increase of radon every 100 Bq·m-3 based on the European and North American pooling studies (adopted from WHO, 2009;)
Study Based on the European Population Study Based on the American Population Risk of Lung Cancer Risk Increase (%) (95% CI*)
Men (Min, Max) Women (Min, Max) Men (Min, Max) Women (Min, Max)
11 (4, 21) 3 (-4, 14) 3 (-4, 24) 19 (2, 46)
Age at lung cancer occurrence (years)
Under 55 55 to 65 65+ Under 60 60 to 64 65 to 69 70 to 74 75+
~0 (0, 20) 14 (3, 31) 7 (1, 16) 2 (<0, 35) 80 (13, 257) 2 (-5, 28) 33 (1, 102) -2 (-10, 30) Smoking Habitat
Current Smoker Ex-smoker Non-smoker Other Cigarettes Smoker
7 (-1, 22) 8 (0, 21) 11 (0, 28) 8 (-3, 56) 10 (-9, 42) 10 (-2, 33)
Overlay: increased Percentage based on each 100 Bq·m-3 increase
8 (3, 16) 11 (0, 28)
*CI = confidence interval, p-values less than 0.05 denote statistical significance
15 1.3. Radon & Underground Miners
As discussed previously, radon as a radioactive gas is an inert gas that can migrate from soils and rocks and accumulate in enclosed areas (i.e. underground mines and caves) however, radon as itself is not a concern; its short-lived alpha emitter decay products are responsible for human tissue damage, as it was found that in the miners, about 40% of all lung cancer deaths may be due to radon progeny exposure, 70% of lung cancer deaths in never-smokers, and 39% of lung cancer deaths in smokers (Lubin, et al., 1995).
Radon presented in the mine atmosphere is almost always prevalent and relatively unavoidable in underground mines, where the source of radon can come from trace concentrations of uranium presents on the ground (ore, host rock, organic material, and soils) or through the exhalation from radon/radium contained groundwater. Therefore, the radon concentration in an underground mine environment mainly depends on emissions of radon from the ore body, broken ore, host rock and underground water.
Radon was the first occupational natural environmental carcinogen gas that identified among miners. Lung cancer has been seen to occur in uranium and underground miners for many years. In the last decades, several epidemiological studies have been done to determine the potential risk factors for underground excavation workers, for the development of irreversible occupational respiratory diseases, such as silicosis and lung cancer (Anjos, et al., 2010). Several studies indicated that exposures to the short-lived progeny of radon significantly increases the risk of lung cancer among miners in uranium and other underground mines (Editorials, 1932; Tomásek, et al., 1994; Saccomanno, et al., 1996; Kreuzer, et al., 2010).
For the first time, it was in the sixteenth century that some signs of increased mortality from respiratory disease among certain groups of underground miners in central Europe were seen, while nobody had any idea and information about the disease and causing reason, nor any evidence of a link between disease and radon concentration in the mines.
Finally, in the nineteenth century, it was understood that the disease was, in fact, lung cancer.
Radon was introduced as the first suspected primary cause of these cancers in radon-exposed miners, following studies radon's causal role in lung cancer became firmly established in the 1950s, further details about the history of radon, lung cancer and underground miners history can be found in the already published paper elsewhere (BEIR, 1999).
16
Table 3. shows the summarised results of some studies about the epidemiologic, miners' exposure and the lung cancer rates for different mines (U.S. Environmental Protection Agency, 2003).
Table 3 - Lung cancer rate among the miners in terms of radon exposure
Location Mine Miner
(Person)
Rn Exposure Bq·h-1·m-3 (EEC)
Lung cancer (Person)
China Tin 13,649 182 936
Czechoslovakia Uranium 4,320 125 701
Colorado Plateau Uranium 3,347 369 334
Ontario Uranium 21,346 20 285
Newfoundland Fluorspar 1,751 247 112
Sweden Iron 1,294 52 79
New Mexico Uranium 3,457 71 68
Canada Uranium 6,895 13 56
Canada Uranium 1,420 155 39
Australia Uranium 1,457 5 31
France Uranium 1,769 38 45
Cohort design has generally been used for modelling and estimation of lung cancer rates related to radon exposure among miners; In cohort design, all miners in a mine are identified during a particular period. Therefore, it is easier to follow up miners over time, regardless of whether they remain employed in the mine or not. The vital status of each miner is established at the end of the follow-up period. If a miner has died, related information i.e. date and reason of death, average radon exposure, age, smoking habitat, medical histories etc. are collected, including the previous primary collected data, and the death rate from lung cancer based on recorded information is calculated. However, there is a problem that the quality of the exposure assessment was low and exposure to radon was usually estimated retrospectively e.g. first years of mining when the exposures were highest, and no radon measurements were performed (WHO, 2009). In the first several studies, simply the influence of smoking on developing lung cancer was not considered as a risk factor due to a lack of evidence, therefore, miners' smoking habits were not questioned when the cohort was set up.
17
As it shows in Table 5. (EPA, 2016), lung cancer risk for smokers is increased two times greater in each 100 Bq·m-3 radon concentration level. Studies show underground miners who exposed to high concentrations of radon during working time, have consistently demonstrated an increased risk of lung cancer for both smokers and non-smokers (Tables.
3). Several studies have been done to indicate the relation between radon exposure and lung cancer among the miners, for instance, Table 5. shows an epidemiological case study on the correlation between Colorado miners' cohorts, radon exposure and cancer death (Leenhouts, 1998).
Regarding the condition of many mines' result in annual exposure to radon progenies, it is of the same order of magnitude as that experienced in a large number of houses around the world e.g. in case of miners if a mine worker had continuous exposure to 1 working level month for a year (WLMAnnual) in a mine, this is comparable to exposure over 1 year in a dwelling with a radon concentration of 230 Bq·m-3 (Tirmarche, et al., 2012; Axelsson, et al., 2015).
However, the inhalation hazard in mines is principally due to radon ans thoron, though the distribution of aerosol particles in the mine air as a predominant factor on the ratio of attached and unattached fractions cannot be ignored regarding their features of changing the equilibrium factor value, resulting in different dose conversion factor.
On the other hand, results of recent studies show that the remaining radon in enclosed area for a longer period generated higher concentration of radioactive decay products of radon, therefore, a rapid air change can quickly reduce the radon gas concentration from the atmosphere and result in a lower quantity of radon decay products building up, in addition to reducing aerosol concentration. Therefore, the concentration of radon progeny, e.g. within underground mines, depends on the fresh air exchange rate and ventilation (Schroeder &
Evans, 1969). Regarding the radon concentration in underground workplaces, Table 4.
summarized indoor radon concentration among several different mines.
18
Table 4- Summarized indoor radon concentration in the different mines
Country Mine Indoor Radon
(Bq·m-3) Reference
Kosovo
Stanterg (complex mine) 302±20
(Hodolli, et al., 2015) Artana (Lead-zinc mine) 191±6
Hajvali (Lead-zinc mine) 463±19
Badovc (Zinc mine) 527±35
Pakistan Punjab (Coal mine) 63±24 - 782±215
(Qureshi, et al., 2000) Balochistan (Coal mine) 48±12 - 343±128
Australia
Gold mine 39 - 59 (49±14)
(Hewson & Ralph, 1994)
Gold mine 137 - 156
(147±13)
Nickel/Gold 20 - 26 (22±3)
Nickel/Gold mine 52 - 74 (65±12)
Coal mine 86 - 386
(220±150)
Coal mine 106 - 166
(136±42) Lead-Zinc mine 30 - 37 (34±2)
Britain Coal mine 22 - 518 (Duggan, et al., 1968)
Iran
Robat-Karim (Manganese mine)
1332±236 (no ventilation)
(Ghiassi-Nejad, et al., 2002)
Venarge-Qom
(Manganese mine) 10±2.6
Nakhlak (Led mine) 188±74
Pabdana (Coal mine) 146 -520 (320) India Godavarikhani
(Coal mine) 144 ± 61 (Rao, et al., 2001)
Turkey
Boron mine 51 - 117
(Yener & Küçüktas, 1998)
Coal mine 31 - 185
Chromium mine 10 - 35
19
Table 5- Radon exposure and related lung cancer death rate (Colorado miners’ cohorts) Radon exposure (WLM working level months) Smoking Habitat (Cigarettes per Day)
Min. Max. Avg.
Min.-Max. ‣ Avg. ‣
0 0
1 – 11 6
12 – 23 18
24 – 35 30
36 – 49 42
M D M D M D M D M D
0 49 25 91 1 90 3 96 4 44 0 16 2
50 99 75 82 0 67 1 99 1 40 1 10 0
100 199 150 131 0 113 2 141 8 60 4 19 1
200 399 300 160 0 161 10 237 22 123 10 26 0
400 799 600 141 6 184 13 278 30 126 25 30 6
800 1599 1200 107 9 174 10 228 34 104 24 27 5
1600 3199 2400 84 12 109 16 156 46 69 19 19 5
3200 6400 4800 23 4 24 7 60 18 21 9 7 3
M = Number of Individuals; D = Lung Cancer Deaths;
20 1.4. Radon & Dose
As it was explained previously, radiation can cause damage to the human tissues in either direct or indirect way; This potential of impact is measured in terms of time-integrated exposures known as a "dose", e.g. the amount of energy deposited in the body from exposing to radiation is expressed as a dose and can be classified as absorbed dose, equivalent dose and effective dose (Mattsson & Söderberg, 2013); Figure 5. shows a schematic representation of the series of steps from radon exposure to effective dose (Müller, et al., 2016).
Figure 5- The series of steps from radon exposure to effective dose
The lung absorbed dose (DLung) is determined by biokinetic models. The lung equivalent dose (HLung) and the effective dose (E) are obtained by the radiation weighting factor WR
(changed or unchanged) and the tissue weighting factor (WLung), respectively.
Since radon is the largest contributor to radiation dose from natural sources, therefore, measurements of indoor radon should be performed regularly. A value of about 3 mSv·y-1 can be calculated using the latest recommended values published by ICRP as an average annual effective dose to the general population due to inhalation of radon and its progenies (ICRP, 2017).
Occupational exposure to radon and its short-lived decay products is defined as Working Level "WL" and refers to the concentration of short-lived decay products of radon in equilibrium with 3746 Bq·m-3 of Rn-222; So that, 1 WL is equivalent to the combination of radon short-lived decay products in one cubic meter of air with the potential of emitting 1.3·108 MeV or 20.83 µJ·m-3 (3.6·10-3 J·h·m-3) of potential alpha particle energy; The amount of ionising radiation emitted depends on radon in equilibrium with the decay of its daughters (ICRP, 2010).
21
Following the previous explanation, if an individual were exposed to 1 WL during a working month of 170 hours which is expressed as a Working Level Month (WLM) a factor of dose calculation. Regarding this, the inhalation doses resulting from the exposure to radon is related directly to the equilibrium factor (the ratio between the concentration of radon and its decay products), and the length of exposure. Received dose of radiation is usually measured in milli-Sievert per year (mSv·y-1) as the SI derived unit (ICRP, 2010).
Since the inhalation dose from the exposure to radon is directly associated with the short-lived radon decay products, measuring radon progenies in addition to radon measurement is very important. After radon decays, the freshly formed progeny quickly attaches to existing aerosol particles, thereby giving rise to a consecutive activity size distribution, for more details refer to sections 1.2. at the current thesis and Figure 6.
Figure 6- Processes of defining attached & unattached progenies
Calculation of effective dose from inhaled radon and its short-lived decay products follows the same formula for both public and occupational, but the difference is on the value of each parameter of the formula (Figure 7.), i.e. equilibrium factor (F) is an important
22
parameter on estimating dose, but this value changes depending on the conditions of ventilation, activity, location etc., for example, the equilibrium factor for outdoor, indoor and mine are 0.6, 0.4 and 0.2, respectively; these values are given literally and for a precise assessment it needs to be measured directly, while in some cases obtained value would be either much higher or much lower than given values.
Figure 7- Parameters to estimate the dose from radon short-lived decay products
Another important parameter in dose calculation is unattached and attached factor;
These values are used to calculate the dose conversion factor. As equilibrium factor, dose conversion factor is given by some organisations such as ICRP, etc., using epidemiological models (ICRP, 2017); However, these values may differ from the real values and for precise dose estimation it is necessary to calculate dose conversion factor based on field measurements, as it depends on attachment process and attachment process directly depends on environmental conditions; Figure 8. (Ruzer, 2011) shows experimental results of correlation between the unattached fraction of radon decay products and the aerosol surface area measured in these experiments; However, breathing behaviour, based on size distribution of the decay products, plays an important role to estimate dose conversion factor, (Figure 9. - source: Porstendörfer, 1996).
23
Figure 8- Unattached fraction vs particles surface area
The relation between (a) breathing behaviour and size distribution of the decay products and (b) the dose conversion factor, shows in Figure 9. and further information can be found on the published paper elsewhere (Porstendörfer, 1996). The dose curves show a great dependence on particle diameter with maxima at 1 nm to 5 nm and 4 µm to 10 µm.
Besides the dose conversion calculation, in the view of radiation protection, the ratio between ultrafine/unattached and attached is important as attached progenies (with the site of about 150 nm) may pass through the upper respiratory tract and exit after exhalation; on the other hand, a major part of the ultrafine progenies after passing the upper respiratory tract deposit in the alveoli and subjected to somatic transport processes (Ramola, et al., 2016).
24
Figure 9- Dose conversion factors based on the breathing behaviour and particle size
Therefore, the equilibrium factor and the unattached fraction, size distribution of the decay products, and breathing behaviour are significant parameters in determining the number of radioactive decay products of radon left in the lungs and estimation of effective dose.
25 1.5. Radon & Regulations
The potential health risk due to radiation has become a widespread concern by many international organizations in the past and recent years, and prompted the national and international health organisations to establish regular recommendations and recommended dose limits for both workers and the general public for different types of activities, however, due to the importance of radon (as a major source of exposure -both occupational and public- and as a risk factor of lung cancer) outside of dose limit, extra recommendations are issued about accumulation of radon concentration in workplaces and buildings for protection against radon and reducing the risk of lung cancer caused by inhaled radon.
The International Commission on Radiological Protection (ICRP), the World Health Organization (WHO), the International Atomic Energy Agency (IAEA), the U.S.
Environment Protection Agency (EPA), the European Atomic Energy Community (EAEC), the United Nations Scientific Committee on the Effects of Atomic Radiation (UNSCEAR) and the Occupational Safety and Health Administration (OSHA) are the well-known organisations that regularly recommend certain interventions concerning the accumulation of radon in workplaces or public area as regulation or suggestion, however, some countries set up their own regulations and recommendation level.
As a major of public health concern due to exposure to radon, the EPA introduced a primary action level of 4 pCi·L-1 (~150 Bq·m-3), thus, any radon concentration above this level needs mitigation to reduce radon. To find out which level is more appropriate (not only in view of public protection, but also in case of cost-effectiveness) five different radon concentration levels as 2, 3, 4, 8, and 20 pCi·L-1 (approximately 75, 110, 150, 300 and 740 Bq·m-3, respectively) were examined for preparing the guideline; It was observed, the higher value did not reduce the risk posed by exposure to radon nearly as much as did lower concentration; Therefore, EPA decided to limited the action level ranging between 2 to 4 pCi·L-1 (~75 to ~150 Bq·m-3); Then, after more examinations, 4 pCi·L-1 (~150 Bq·m-3) was chosen as action level due to its incrementally cost-effectiveness (the average cost per life saved by using this level of action is about $700,000, the amount, when compared to other government programs and regulations (such as highway safety, air-transportation safety, and occupational safety) is very low) and also EPA believed this level is easily and technically achievable in most of the homes using inexpensive mitigation methods. The action level value continues to be valid up to now and is considered a mitigation when indoor radon
26
concentrations exceed 150 Bq·m-3. Additionally, EPA works on relative-risk projection models to estimate the risk of radon exposure to the public health. For instance, lifetime risks of fatal lung cancer due to radon exposure at 4 pCi·L-1 (~150 Bq·m-3) was estimated to be 1.6·10-3 and 3·10-2 for individuals of never-smokers and smokers, respectively. The approximate annual of lung-cancer deaths caused by indoor radon for the US population was calculated about 14,000 deaths (National Research Council, 1999).
Meanwhile, the International Atomic Energy Agency, in accordance with the IAEA Safety Standard Series No. GSR Part 3, recommends that radon concentrations should not exceed 300 and 1000 Bq·m-3 for the public and workers, respectively.
The International Commission on Radiological Protection (ICRP) is one of the internationally recognised organisations in preparing and drafting recommendations and a source of guidance for radiation protection policies and national’s regulations. ICRP basically classified its guidance in two circumstances of exposure: (A) when radiation source is resulting from human activity and increases the overall exposure, which is known as practices; (B) when radiation source exists that calls interventions; Indoor radon in existing buildings due to pre-existing natural sources is an example of interventions. ICRP has recently published two reports about radon and exposure to its progenies; Report 115 "Lung Cancer Risk from Radon and Progeny and Statement on Radon" was published in 2010 focusing on lung cancer risk due to radon and its short-lived decay products' inhalation; a second one was published in 2014 named "Radiological Protection Against Radon Exposure" (Report 126) an updated guidance on radiological protection against radon exposure and control of levels of exposure within dose estimates. Until last year, effective dose arising from radon and its short-lived decay products' inhalation had been calculated using epidemiological approach, but in 2017, ICRP introduced new reference dose coefficients for radon and radon progeny calculated using both ICRP biokinetic and dosimetry models validated for indoor workplaces and mines. The reference dose coefficients following inhalation of radon and radon progeny based on epidemiological approach have been updated several times during a short period until 2017 that the latest value was introduced. For the calculation of doses following inhalation of radon and radon progeny in underground mines and in buildings, in most circumstances, the ICRP recommends a dose coefficient of 10 mSv·WLM-1 (3 mSv per mJ·h·m3), Table 6. shows some historical updates on dose coefficient (Marsh, et al., 2017; ICRP, 2017). The reference level value of 300 Bq·m-3 is recommended both for dwellings and workplaces.
27
Table 6- Historical updates on dose coefficient by ICRP
Exposed population Fatal cancer risk per WLM
Conversion Factor
(mSv·WLM-1) Reference Public
Workers 2.8·10-4 4
5
Publication 60 & 65 (1991 &1993) Public
Workers 5·10-4 9
12
Publication 103 & 115 (2007 & 2010)
Public & Workers 5·10-4 10 Publication 137
(2017)
Recently, the council of the European Union prepared the new European Basic Safety Standards (EU BSS, Basic Safety Standards Directive entered force on 6 February 2014), and established a new regulation to set the limit on the effective dose for public exposure at 1 mSv in a year and 20 mSv in a single year for occupational. A reference level of 1 mSv per year was applied to indoor external exposure to gamma radiation emitted by building materials (in addition to outdoor external exposure) and building materials should be monitored to assure that the activity concentration index (I) not exceed 1 (Council of the European Union, 2014). EU countries must ensure compliance by 6 February 2018, i.e.
Hungary as a member State of the European Union has to establish a national reference level of ≤300 Bq·m-3 for indoor radon concentration in workplaces by 2018 (Council of the European Union, 2014).
Additionally, it was recommended that the annual average radon concentration should not exceed 300 Bq·m-3 at dwellings and workplaces (including underground workplaces where radon concentration may exceed to several thousand Bq·m-3) and the dose received from inhaled radon may not be greater than 6 mSv per year, and it was referred to the ICRP to estimate the dose, however, in ICRP-137, based on new epidemiological modelling, the effective dose from radon at 300 Bq·m-3 is equal to 4 mSv.
The impact of the new EU-BSS will be important for many EU member states, including Hungary, since it implies for the first time an obligation to develop a regulatory frame to actively work on reducing the radon exposure not only of workers but also of the public, and lowering the reference level for the annual average activity concentration in air