INTRODUCTION
T
he National Curriculum for Basic Education (NCBE) in Namibia requires students to develop into scientific literate citizens (Namibia Ministry of Education, 2010).According to the NCBE, one of the components of scientific literacy is the understanding of the nature of scientific knowledge.
The nature of science entails what makes science different from other disciplines. In other words, it characterizes scientific knowledge that is derived from how the knowledge is developed (Lederman et al., 2014). However, the assessment of scientific knowledge in Namibian schools does not include this aspect of scientific literacy. All assessments mainly focus on subject content knowledge and hardly focus on assessing students’ understanding of the characteristics of scientific knowledge and knowing, which is essentially the development of their scientific epistemic beliefs.
Since this aspect of scientific literacy is not assessed in schools, there are limited means through which to ascertain the extent to which the ideals of the national curriculum are being met. One way to ascertain students’ understanding of the nature of scientific knowledge and knowing is to assess their scientific epistemic beliefs. Advancing students’ beliefs about the nature of scientific (BANOS) knowledge and knowing has featured prominently in recent research in science education (Chen, 2012; Chen et al., 2014; Conley et al., 2004; Tsai et al., 2011). However, no studies appear to have been conducted in Namibia.
The main aim of this research was to develop and validate a new questionnaire “BANOS” for assessing Grade 12 students’
scientific epistemic beliefs based on the eight-dimensional theorization of the nature of science. This age group was chosen as previous studies have argued that it was difficult to measure epistemological thinking among younger students (Conley et al., 2004). The research endeavored to answer the following questions:
1. What is the reliability and construct validity of the BANOS questionnaire?
2. What is the factorial validity of the theorized eight- dimensional nature of science?
Namibia as a developing nation needs to keep abreast with the rest of the world in terms of educational reforms, particularly, in science education. Studies related to scientific epistemic beliefs do not appear to have been done in Namibia. This research is, hence, pioneering in this context as it attempts to instigate students’ science learning in Namibian basic education, particularly, using cross-sectional design. Scientific epistemic beliefs are individual domain-specific beliefs about scientific knowledge and the acquisition of such knowledge.
These beliefs have an important role in several aspects of academic learning and achievement (Leal-Soto and Ferrer- Urbina, 2017; Paechter et al., 2013).
Theoretical Background
Scientific literacy consists of different components, namely content knowledge, nature of science, and scientific inquiry.
This research study focuses on the nature of science The purpose of this study was to validate a new questionnaire for assessing students’ beliefs about the nature of science (BANOS). Existing instruments have limitations in terms of psychometric validity. A new questionnaire termed “BANOS” was developed to address such limitations. The BANOS is based on dimensions of the nature of science as a theoretical framework. The BANOS was administered to 860 Grade 12 students in Namibia, using the paper-and-pencil method. Data analysis employed reliability analysis, exploratory factor analysis (EFA), confirmatory factor analysis (CFA), and parallel analysis. The reliability of the BANOS was α = 0.87. EFA revealed a final interpretable five-factor structure, and the factor solution accounted for 67.73% of the total variance. However, parallel analysis revealed that only four factors had eigenvalues that were statistically significant and the resultant scree plot also supported the retention of four factors. CFA results showed that the measurement model had a poor statistical fit for the data. These findings indicate that the eight-dimensional framework could not be confirmed at EFA level. However, the BANOS had adequate construct validity and reliability.
Results are discussed in terms of intricate similarities among the dimensions of nature of science.
KEY WORDS: nature of science; scientific epistemic beliefs; Namibia; beliefs about the nature of science; validity
Exploring the Factorial Validity of the Beliefs about Nature of Science Questionnaire
Simson N. Shaakumeni1*, Benő Csapó2
1Doctoral School of Education, University of Szeged, Szeged, Hungary, 2Research Group on the Development of Competencies, Institute of Education, University of Szeged, Szeged, Hungary
*Corresponding Author: shaakumeni@edu.u-szeged.hu
ABSTRACT
component. Although it has been shown to be difficult to define (Hillman et al., 2016), Lederman et al. (2002) described it as
“the epistemology and sociology of science, science as a way of knowing or the values and beliefs inherent to the development of scientific knowledge” (p. 498). With regard to this view of scientific epistemology, students should develop certain habits of mind such as believing that scientific knowledge:
(1) Can change over time (tentative), (2) empirically-based (based on observations of the natural world), (3) there is no one way of doing science called “the Scientific Method,”
(4) subjective, (5) influenced by imagination and creativity, (6) socially and culturally embedded, (7) observation and inference are different, and (8) theories and laws are distinct kinds of scientific knowledge (Abd-El-Khalick et al., 2017;
Abd-El-khalick and Lederman, 2000). Although the eight- dimensional theorization has been criticized by some science educators as being too general, over-simplified, prescriptive, and narrow (Irzik and Nola, 2011; Mathews, 2012; Dagher and Erduran, 2016; Grandy and Duschl, 2008), it is still a useful framework for assessing science students’ BANOS. There has been considerable consensus about this theorization among scholars (Chen, 2012; McComas, 2008; Niaz, 2008; Osborne et al., 2003) as well as clarification from the proponents of this theorization in response to criticisms (Lederman et al., 2014).
While this eight-dimensional hypothesized theory has been validated through an interpretivist approach, its validity has not been demonstrated psychometrically, thus inhibiting the confidence in its use. Moreover, research following this theorization found that students and teachers do not possess appropriate conceptions of the nature of science (Bell et al., 2003; Khishfe and Abd-El-Khalick, 2002; Moss et al., 2001).
Conley et al. (2004) proposed that students’ scientific epistemic beliefs have four dimensions: (1) Source (science comes from authority or experts), (2) certainty (science knowledge has one right answer), (3) development (science knowledge is changing), and (4) justification (science knowledge depends only on evidence from experiments). Epistemological beliefs span from naive to sophisticated (Kampa et al., 2016).
Literature has revealed that it is generally difficult to measure epistemic beliefs using self-reporting instruments (DeBacker et al., 2008; Schraw et al., 2002; Tsai et al., 2011); however, domain-specific epistemic belief studies have produced favorable results (Kampa et al., 2016; Kaya, 2017; Liang and Tsai, 2010; Lindfors et al., 2019).
Scientific literacy such as inquiry skills and the understanding of the nature of scientific knowledge ought to develop in students implicitly. Implicit approach assumes that “students’
participation in authentic scientific investigations in itself would help students develop more accurate understandings of the nature of scientific inquiry and knowledge” (Bell et al, 2011, p. 415). However, the literature shows that this approach has not been effective in facilitating students’ and teachers’
understanding of the nature of science (Gess-Newsome, 2002;
Lederman et al., 2013; McDonald, 2010). Despite students’ and teachers’ views about the nature of science have been studied
extensively in the past two decades, it has not been possible to locate any studies concerning Namibia.
Moreover, there is no shortage of instruments for exploring students’ views about the nature of science (Lederman et al., 1998). However, many existing instruments have some limitations in terms of psychometric validity as they are based solely on qualitative validations. Qualitatively validated questionnaires such as the “views of nature of science”
(VNOS) developed by Lederman et al. (2002) have become a popular choice for researchers. This open-ended questionnaire has several versions A, B, and C. The versions are meant for use at different grade levels. Each version focuses on a particular dimension of the nature of science and was validated through response coding through interviews. Although the validation method used is sound, one version is not suitable for capturing multiple dimensions of a student’s BANOS. The use of VNOS is also time-intensive in terms of essay response coding and follow-up interviews (Hillman et al., 2016) which may not be favorable for every researcher. The BANOS questionnaire was developed not only to address such limitations but also to consider the cultural context of Namibia.
METHODS
Instrument and Sample
A new 28-item Likert scale questionnaire termed “BANOS”
was developed. This questionnaire is new in the sense that although ideas for possible items were obtained from existing scales in the literature, no similar questionnaire exists. The theoretical framework for the development of the instrument for assessing BANOS was based on the eight general dimensions of the nature of scientific knowledge as proposed by Lederman and others. (Lederman et al., 2002;
Lederman et al., 1998; Lederman et al., 2014; McComas et al., 1998). The items are declarative statements describing particular dimensions of the nature of scientific knowledge.
Respondents give their personal level of belief or agreement with the five-point Likert scale (Cohen et al., 2007), namely 1 = strongly disagree, 2 = disagree, 3 = not sure, 4 = agree, and 5 = strongly agree. The statements are also in the form of nuanced views of respondents about the nature of science obtained from the literature (Chen, 2006; Dogan and Abd-El- Khalick, 2008; Khishfe and Abd-El-Khalick, 2002; Summers and Abd-El-Khalick, 2017; Vhurumuku, 2010). The statements were all worded positively so that a high score indicates more sophisticated BANOS and knowledge.
The survey was administered to a sample of 860 (52% male and 48% female) secondary school students in Namibia, using the paper-and-pencil method. The mean age of students was mean
= 18.3 and standard deviation = 1.32. Sampling was inherently purposive because the aim of the study was not to generalize findings but rather to obtain a sufficient sample suitable for advanced statistical analysis to examine psychometric properties of the questionnaire. All participating students were in senior secondary level (Grade 12). On average, students
spent approximately 13 min to complete the questionnaire.
English is the official language in Namibia and all items in the questionnaire were presented in English.
Procedure
After obtaining ethical approval from the supervising university’s institutional review board as well as permission from the gatekeepers of the Ministry of Education in Namibia, informed consent forms were signed by participating students in conjunction with their parents or guardians. Data were collected at the beginning of the first school trimester in January. This was deemed the best time to visit schools as they have just started their academic program. Moreover, this was also in conformity with stringent conditions attached to the research permission, not to disturb academic activities.
Scientific epistemic beliefs (BANOS and knowing) were measured with self-report questionnaires using pencil-and- paper method.
The sample was randomly split into two: 503 students’ scores were used for exploratory factor analysis (EFA) by means of principal components and 357 students were used confirmatory factor analysis (CFA). This was done because it is advisable to use different samples for EFA and CFA (Cabrera-Nguyen, 2010;
Henson and Roberts, 2006; Worthington and Whittaker, 2006).
Data Analysis
Ordinal scales were analyzed as if they were the interval (Glynn et al., 2011). In this case, items are assumed to be generally parallel indicators of the underlying latent variable (DeVellis, 2003).
Data were analyzed using Cronbach’s alpha coefficient (Summers and Abd-El-Khalick, 2017), using the Statistical Package for the Social Sciences version 25 to determine the reliability of responses. EFA using principal component
extraction and varimax rotation (Henson and Roberts, 2006) was used to assess the questionnaire factor structure. CFA in AMOS version 25 was used to assess the measurement model fit using the χ2/df, root-mean-square error of approximation (RMSEA), standardized root mean square residual (SRMR), Tucker-Lewis index (TLI), and comparative fit index (CFI) as fit indices (Glynn et al., 2011; Teo, 2013). Construct validity was assessed considering two criteria: Convergent and discriminant validity (Cristobal et al., 2007).
RESULTS AND DISCUSSIONS
Reliability
Reliability is a measure of how well the items in a scale measure the same construct (Streiner, 2003). This measure is commonly estimated using Cronbach’s alpha reliability coefficient. Streiner (2003) suggested that the alpha coefficients of 0.70 and higher are ideal for research tools. Based on the results from EFA, items that were loading on multiple factors were systematically culled, resulting in the final 16 items and five factors. The reliability of scores on the resultant 16-item questionnaire determined using Cronbach’s alpha coefficient was 0.87. Reliability of individual factors ranged from 0.72 to 0.83 (Table 1). These results suggest that the questionnaire had good overall reliability for the sample used.
Construct Validity Convergent validity
Convergent validity measures the level of correlation of multiple variables of the same construct that are in agreement (Ab Hamid et al., 2018). To establish convergent validity, factor loadings of indicator variables, composite reliability (CR), and the average variance extracted (AVE) should be used (Ab Hamid et al., 2018). The recommended thresholds for these measures are that the AVE should be above 0.50 and the CR should be 0.70 and above (Huang et al., 2013). Convergent validity was evaluated using AVE and CR values computed using Microsoft Excel (Gaskin, 2016) and factor loadings from CFA computed in AMOS. The AVE values for the five factors model ranged from 0.46 to 0.64. The CR values ranged from 0.75 to 0.81 (Table 2).
Although the AVE value for one factor was below the acceptable minimum cutoff point of 0.50 (empirical = 0.46), convergent validity may be adequate because all latent factors had CR values above 0.70 (Fornell and Larcker, 1981).
Table 2: Five‑factor model CR, AVE, MSV, and correlations
Latent factors CR AVE MSV 1 2 3 4 5
Subjectivity 0.77 0.52 0.55 0.72
Empirical 0.81 0.46 0.37 0.58 0.68
Sociocultural 0.81 0.59 0.33 0.56 0.50 0.77
Scientific methods 0.75 0.50 0.55 0.74 0.61 0.56 0.71
Tentativeness 0.78 0.64 0.29 0.54 0.32 0.38 0.48 0.80
The diagonal numbers in italic are the square root of the AVE values. MSV: Maximum shared variance, AVE: Average variance extracted, CR: Composite reliability
Table 1: Reliabilities
Subscales Mean SD Number
of items
Cronbach’s alpha
Subjectivity 9.9 3.0 5 0.72
Empirical 16.5 5.1 3 0.83
Sociocultural 8.84 3.0 3 0.76
Scientific methods 10.6 2.8 3 0.72
Tentativeness 6.5 2.8 2 0.75
BANOS 52.2 11.6 16 0.87
BANOS: Beliefs about the nature of science
Malhotra and Dash (2011) also argued that the AVE is often too strict and validity can be established through CR alone.
Discriminant validity
The extent to which latent factors differ from each other empirically defines discriminant validity (Hair et al., 2016).
This means that a latent factor should explain the variance of its own indicators better than the variance of other latent factors (Ab Hamid et al., 2018). Discriminant validity was assessed by comparing the square root of the AVE with the correlation of latent factors (Hair et al., 2016). The square root of the AVE should be >0.50 (Fornell and Larcker, 1981) and greater than inter-latent factor correlations within the model (Hair et al., 2010). The maximum shared variance (MSV) was also compared to the AVE values. The AVE values should be greater than the MSV values for each latent factor (Rebelo- Pinto et al., 2014). As evident in Table 2, not all latent factors met the requirements and their discriminant validity may not be adequate. For the five-factor model, although the square root of
the AVE for all latent factors was >0.50, it was not greater than inter-latent factor correlations for all factors. The square root of AVE for subjectivity was less than its correlation to scientific methods (Table 2). The MSV values for the two factors (subjectivity and scientific methods) were greater than the AVE values which are contrary to recommendations. However, for the four-factor model (Table 3), all latent factors support the requirements and discriminant validity of all latent factors was adequate, and thus, construct validity was confirmed.
EFAEFA is meant for cases where the relationships between the observed and latent variables are uncertain (Glynn et al., 2011).
It was necessary to apply EFA to assess the factorability of the eight-dimensional theorization of nature of science. The assessment of the correlation matrix for the 16 items was found to be appropriate for factor analysis by means of a Bartlett’s test of sphericity, χ2 = 3055.17, df = 120, p < 0.01, and the Kaiser- Meyer-Olkin measure of sampling adequacy, KMO = 0.84. These tests of normality and sampling adequacy indicated that the correlation matrix was of acceptable quality (Glynn et al., 2011).
EFA (n = 503) using principal component extraction with varimax rotation produced a final interpretable five-factor structure consisting of 16 items after the culling of cross-loading items, and the factor solution accounted for 67.73% of the total variance. The five factors retained based on eigenvalues
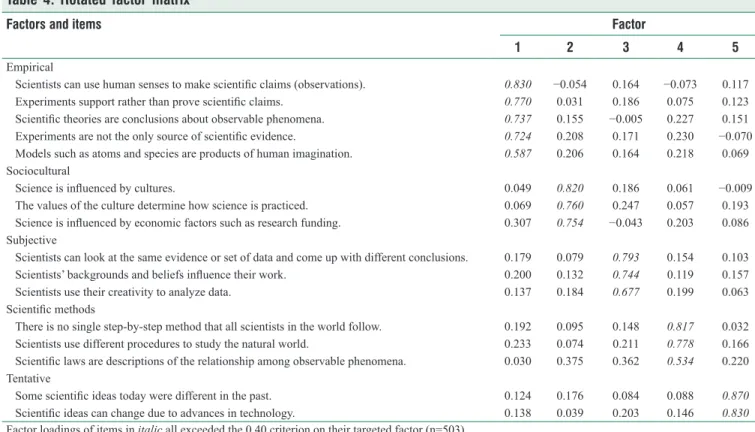
>1, and the percentage of variance were empirical (5.49, 34.30%), sociocultural (1.78, 11.13%), subjectivity (1.36, 8.50%), scientific methods (1.19, 7.44%), and tentativeness (1.02, 6.37%). Table 4 shows the rotated factor loadings.
Table 3: Four‑factor model CR, AVE, MSV, and correlations
Latent factors CR AVE MSV 1 2 3 4
Subjectivity 0.82 0.43 0.42 0.66
Empirical 0.82 0.48 0.32 0.56 0.69
Sociocultural 0.81 0.59 0.42 0.65 0.49 0.77 Tentativeness 0.78 0.64 0.33 0.57 0.34 0.38 0.80 The diagonal numbers in italic are the square root of the AVE values.
MSV: Maximum shared variance, AVE: Average variance extracted, CR: Composite reliability
Table 4: Rotated factor matrix
Factors and items Factor
1 2 3 4 5
Empirical
Scientists can use human senses to make scientific claims (observations). 0.830 −0.054 0.164 −0.073 0.117
Experiments support rather than prove scientific claims. 0.770 0.031 0.186 0.075 0.123
Scientific theories are conclusions about observable phenomena. 0.737 0.155 −0.005 0.227 0.151
Experiments are not the only source of scientific evidence. 0.724 0.208 0.171 0.230 −0.070
Models such as atoms and species are products of human imagination. 0.587 0.206 0.164 0.218 0.069 Sociocultural
Science is influenced by cultures. 0.049 0.820 0.186 0.061 −0.009
The values of the culture determine how science is practiced. 0.069 0.760 0.247 0.057 0.193
Science is influenced by economic factors such as research funding. 0.307 0.754 −0.043 0.203 0.086
Subjective
Scientists can look at the same evidence or set of data and come up with different conclusions. 0.179 0.079 0.793 0.154 0.103
Scientists’ backgrounds and beliefs influence their work. 0.200 0.132 0.744 0.119 0.157
Scientists use their creativity to analyze data. 0.137 0.184 0.677 0.199 0.063
Scientific methods
There is no single step-by-step method that all scientists in the world follow. 0.192 0.095 0.148 0.817 0.032
Scientists use different procedures to study the natural world. 0.233 0.074 0.211 0.778 0.166
Scientific laws are descriptions of the relationship among observable phenomena. 0.030 0.375 0.362 0.534 0.220 Tentative
Some scientific ideas today were different in the past. 0.124 0.176 0.084 0.088 0.870
Scientific ideas can change due to advances in technology. 0.138 0.039 0.203 0.146 0.830
Factor loadings of items in italic all exceeded the 0.40 criterion on their targeted factor (n=503)
However, using the eigenvalue >1, criteria only may not be sufficient to decide on the number of factors to retain (Cabrera- Nguyen, 2010). Hence, parallel analysis was also employed.
This procedure entails randomly ordering the respondents’ item scores and conducts a factor analysis on both the original data set and the randomly ordered scores. The number of factors to retain is determined by comparing the eigenvalues determined in the original data set and in the randomly ordered data set.
The factors are retained if the original eigenvalue is larger than the eigenvalue from the random data (Worthington and Whittaker, 2006).
The analysis revealed that only four factors (Table 5) had eigenvalues that were statistically significant for retention at p = 0.05 (O’Connor, 2000). The resultant scree plot also shows that only four factors can be seen at or above the intersections
of the graphs, thus supporting the retention of four factors (Figure 1).
CFAUsing a separate sample of 357 students, CFA was performed on the 16 items to validate the measurement model, in which convergent and discriminant validity was assessed. The assessment of the model fit was done using the standardization method where all covariances were set to 1.0 (Teo, 2013). The goodness of fit of the measurement models (hypothesized five and four-factor models) was assessed by three absolute (χ2, RMSEA, and SRMR) and two incremental (TLI and CFI) fit indices. The Chi-square statistic assesses the extent to which the proposed model varies from the data (Glynn et al., 2011).
Its p-values are acceptable when they are non-significant, indicating adequate model fit. However, this index is sample dependent, and hence, it is recommended that it should be divided by the degrees of freedom (χ2/df), (Garson, 2015) and the resultant values are in a recommended range of 1.0–3.0 (Glynn et al., 2011).
The RMSEA and the SRMR are independent of the sample size but are sensitive to model misspecification and adequate fit values should be 0.06 and 0.08 or less, respectively (Teo, 2013). The TLI and the CFI are incremental indices with a recommended cutoff value of 0.95, indicating goodness of fit;
however, values >0.90 are acceptable (Hooper et al., 2008).
Maximum likelihood (ML) estimation was used to estimate the model’s parameters and fit indices.
CFA (n = 357) results showed that the five-factor model had poor statistical fit for the data, with the following fit indices:
χ2/df = 0.5024, TLI = 0.80, CFI= 0.85, RAMSEA = 0.11, and SRMR = 0.07. However, the four-factor model had better statistical fit for the data, though still below recommended thresholds, with the following fit indices: χ2/df = 4.163, TLI = 0.85, CFI = 0.88, RAMSEA = 0.09, SRMR = 0.06.
It is not surprising that a better measurement model had less factors than hypothesized. Conley et al. (2004) also found that students’ scientific epistemic beliefs had four dimensions.
Moreover, some of the dimensions were highly correlated. High correlations among epistemic belief scales point to redundancy in the measurement. In this sample, the highest correlation in the five-factor model was between subjectivity and scientific methods (r = 0.74) and between sociocultural and subjectivity (r = 0.65) in the four-factor model. However, proponents of the eight-dimensional theorization had acknowledged that the dimensions of nature of science were intricately intertwined (Summers and Abd-El-Khalick, 2017).
CONCLUSION
This study sets out to assess the factorial validity of the hypothesized eight dimensions underlying nature of science.
The findings indicate that the eight-dimensional model that had been qualitatively suggested could not be supported at EFA level. This could be attributed to the inherent similarity Table 5: Raw data eigenvalues, means, and percentile
random data eigenvalues
Number of items Raw data Means Random data
1 5.488* 1.317 1.381*
2 1.780* 1.250 1.295*
3 1.359* 1.200 1.240*
4 1.191* 1.155 1.190*
5 1.018 1.114 1.144
6 0.830 1.077 1.105
7 0.684 1.042 1.072
8 0.558 1.008 1.037
9 0.520 0.975 1.001
10 0.461 0.942 0.970
11 0.428 0.909 0.937
12 0.421 0.876 0.903
13 0.349 0.842 0.871
14 0.343 0.807 0.838
15 0.322 0.767 0.802
16 0.249 0.720 0.760
*p=0.05
Figure 1: Scree plot
among the dimensions of nature of science. However, the questionnaire had adequate construct validity and reliability though it had poor fit statistics values lower than the recommended thresholds, except for the χ2/df and SRMR (Hair et al., 2016). It can be concluded that the questionnaire showed potential to be psychometrically valid. However, it needs to be examined for possible flaws that affected the measurement model fit. Furthermore, some methodological limitations may have influenced the findings of this study. First, students were not interviewed to ascertain the accuracy of interpretation of the questionnaire items. It was assumed that students interpreted the items as expected. Second, the indices of model fit obtained from CFA might be biased due to departure from multivariate normality (Cabrera-Nguyen, 2010).
ACKNOWLEDGMENT
The corresponding author of this article is on Stipendium Hungaricum Scholarship Program of the Hungarian government in collaboration with the Namibian government through the Namibian Students Financial Assistance Fund.
REFERENCES
Ab Hamid, M.R., Sami, W., & Mohmad, S.M.H. (2018). Discriminant validity assessment : Use of fornell and larcker criterion versus HTMT criterion. Journal of Physics, 890, e012163.
Abd-El-Khalick, F., & Lederman, N.G. (2000). Improving science teachers’
conceptions of nature of science: A critical review of the literature.
International Journal of Science Education, 22(7), 665-701.
Abd-El-Khalick, F., Myers, J.Y., Summers, R., Brunner, J., Waight, N., Wahbeh, N., & Belarmino, J. (2017). A longitudinal analysis of the extent and manner of representations of nature of science in U.S. high school biology and physics textbooks. Journal of Research in Science Teaching, 54(1), 82-120.
Bell, R.L., Blair, L.M., Crawford, B.A., & Lederman, N.G. (2003). Just do it? Impact of a science apprenticeship program on high school students’
understandings of the nature of science and scientific inquiry. Journal of Research in Science Teaching, 40(5), 487-509.
Bell, R.L., Matkins, J.J., & Gansneder, B.M. (2011). Impacts of contextual and explicit instruction on preservice elementary teachers’
understandings of the nature of science. Journal of Research in Science Teaching, 48(4), 414-436.
Cabrera-Nguyen, P. (2010). Author guidelines for reporting scale development and validation results. Journal of the Society for Social Work and Research, 1(2), 99-103.
Chen, J.A. (2012). Implicit theories, epistemic beliefs, and science motivation: A person-centered approach. Learning and Individual Differences, 22(6), 724-735.
Chen, J.A., Metcalf, S.J., & Tutwiler, M.S. (2014). Motivation and beliefs about the nature of scientific knowledge within an immersive virtual ecosystems environment. Contemporary Educational Psychology, 39(2), 112-123.
Chen, S. (2006). Development of an instrument to assess views on nature of science and attitudes toward teaching science. Science Education, 90(5), 803-819.
Cohen, L., Manion, L., & Morrison, K. (2007). Research Methods in Education. 6th ed. New York: Routledge.
Conley, A.M.M., Pintrich, P.R., Vekiri, I., & Harrison, D. (2004). Changes in epistemological beliefs in elementary science students. Contemporary Educational Psychology, 29(2), 186-204.
Cristobal, E., Flavián, C., & Guinalíu, M. (2007). Perceived e-service quality (PeSQ). Managing Service Quality, 17(3), 317-340.
Dagher, Z.R., & Erduran, S. (2016). Reconceptualizing the nature of science for science education. Science and Education, 25, 147-164.
DeBacker, T.K., Crowson, H.M., Beesley, A.D., Thoma, S.J., &
Hestevold, N.L. (2008). The challenge of measuring epistemic beliefs:
An analysis of three self-report instruments. Journal of Experimental Education, 76(3), 281-312.
DeVellis, R.F. (2003). Scale Development: Theory and Applications. 2nd ed.).
Thousand Oaks, CA: Sage.
Dogan, N., & Abd-El-Khalick, F. (2008). Turkish grade 10 students’ and science teachers’ conceptions of nature of science: A national study.
Journal of Research in Science Teaching, 45(10), 1083-1112.
Fornell, C., & Larcker, D.F. (1981). Evaluating structural equation models with unobservable variables and measurement error. Journal of Marketing Research, 18(1), 39-50.
Garson, G.D. (2015). Structural Equation Modelling. Asheboro, NC:
Statistical Associates Publishers.
Gaskin, J. (2016). Validity master: Stats Tools Package. Available from:
http://www.statwiki. kolobkreations.com. [Last retrieved 2108 Dec 18].
Gess-Newsome, J. (2002). The use and impact of explicit instruction about the nature of science and science inquiry in an elementary science methods course. Science and Education, 11(1), 55-67.
Glynn, S.M., Brickman, P., Armstrong, N., & Taasoobshirazi, G. (2011).
Science motivation questionnaire II: Validation with science majors and nonscience majors. Journal of Research in Science Teaching, 48(10), 1159-1176.
Grandy, R., & Duschl, R. (2008). Consensus: Expanding the scientific method and school science. In: Duschl, R., & Grandy, R., (Eds.), Teaching Scientific Inquiry: Recommendations for Research and Implementation.
Rotterdam, The Netherlands: Sense. p304-325.
Hair, F. Jr, Hult, G.T.M., Ringle, C., & Sarstedt, M. (2016). A Primer on Partial Least Squares Structural Equation Modeling (PLS-SEM).
Thousand Oaks, CA: Sage Publications.
Hair, J., Black, W., Babin, B., & Anderson, R. (2010). Multivariate Data Analysis. 7th ed. Upper Saddle River, NJ, USA: Prentice-Hall, Inc.
Henson, R.K., & Roberts, J.K. (2006). Use of exploratory factor analysis in published research: Common errors and some comment on improved practice. Educational and Psychological Measurement, 66(3), 393-416.
Hillman, S.J., Zeeman, S.I., Tilburg, C.E., & List, H.E. (2016). My attitudes toward science (MATS): The development of a multidimensional instrument measuring students’ science attitudes. Learning Environments Research, 19(2), 203-219.
Hooper, D., Coughlan, J., & Mullen, M.R. (2008). Structural equation modelling : Guidelines for determining model fit. The Electronic Journal of Business Research Methods, 6(1), 53-60.
Huang, C.C., Wang, Y.M., Wu, T.W., & Wang, P.A. (2013). An empirical analysis of the antecedents and performance consequences of using the moodle platform. International Journal of Information and Education Technology, 3(2), 217-221.
Irzik, G., & Nola, R. (2011). A family resemblance approach to the nature of science for science education. Science and Education, 20, 591-607.
Kampa, N., Neumann, I., Heitmann, P., & Kremer, K. (2016). Epistemological beliefs in science-a person-centered approach to investigate high school students’ profiles. Contemporary Educational Psychology, 46, 81-93.
Kaya, G.I. (2017). The relations between scientific epistemological beliefs and goal orientations of pre-service teachers. Journal of Education and Training Studies, 5(10), 33-42.
Khishfe, R., & Abd-El-Khalick, F. (2002). Influence of explicit and reflective versus implicit inquiry-oriented instruction on sixth graders’ views of nature of science. Journal of Research in Science Teaching, 39(7), 551-578.
Leal-Soto, F., & Ferrer-Urbina, R. (2017). Three-factor structure for epistemic belief inventory: A cross-validation study. PLoS One, 12(3), 1-16.
Lederman, J.S., Lederman, N.G., Bartos, S.A., Bartels, S.L., Meyer, A.A., & Schwartz, R.S. (2014). Meaningful assessment of learners’
understandings about scientific inquiry - The views about scientific inquiry (VASI) questionnaire. Journal of Research in Science Teaching, 51(1), 65-83.
Lederman, N.G., Abd-El-Khalick, F., Bell, R.L., & Schwartz, R.S. (2002).
Views of nature of science questionnaire: Toward valid and meaningful assessment of learners’ conceptions of nature of science. Journal of Research in Science Teaching, 39(6), 497-521.
Lederman, N.G., Antink, A., & Bartos, S. (2014). Nature of science, scientific inquiry and socio-scientific issues arising from genetics: A pathway to
developing a scientifically literate citizenry. Science and Education, 23(2), 285-302.
Lederman, N.G., Lederman, J.S., & Antink, A. (2013). Nature of science and scientific inquiry as contexts for the learning of science and achievement of scientific literacy nature of science and scientific inquiry as contexts for the learning of science and achievement of scientific literacy. International Journal of Education in Mathematics Science and Technology, 1(3), 138-147.
Lederman, N.G., Wade, P.D., & Bell, R.L. (1998). Assessing the nature of science: What is the nature of our assessments? Science and Education, 7(6), 595-615.
Liang, J.C., & Tsai, C.C. (2010). Relational analysis of college science-major students’ epistemological. International Journal of Science Education, 32(17), 2273-2289.
Lindfors, M., Winberg, M., & Bodin, M. (2019). The Role of students’
scientific epistemic beliefs in computer-simulated problem solving.
Scandinavian Journal of Educational Research Online, 63(1), 124-144.
Malhotra, N.K., & Dash, S. (2011). Marketing Research: An Applied Orientation. London: Pearson Publishing.
Mathews, M.R. (2012). Changing the focus: From nature of science to features of science (FOS). In: Khine, M.S., (Ed.), Advances in Nature of Science Research: Concepts and Methodology. Dordrecht, The Netherlands: Springer. p3-26.
McComas, W.F. (2008). Seeking historical examples to illustrate key aspects of the nature of science. Science and Education, 17(2-3), 249-263.
McComas, W.F., Almazroa, H., & Clough, M.P. (1998). The nature of science in science education: An introduction. Science and Education, 7, 511-532.
McDonald, C.V. (2010). The influence of explicit nature of science and argumentation instruction on preservice primary teachers’ views of nature of science. Journal of Research in Science Teaching, 47(9), 1137-1164.
Moss, D.M., Abrams, E.D., & Robb, J. (2001). Examining student conceptions of the nature of science. International Journal of Science Education, 23(8), 771-790.
Namibia Ministry of Education. (2010). The National Curriculum for Basic Education. Okahandja, Namibia: National Institute for Educational Development.
Niaz, M. (2008). What “ideas-about-science” should be taught in school science? A chemistry teachers’ perspective. Instructional Science, 36(3), 233-249.
O’Connor, B.P. (2000). SPSS and SAS programs for determining the number of components using parallel analysis and Velicer’s MAP test. Behavior Research Methods, Instruments and Computers, 32(3), 396-402.
Osborne, J., Collins, S., Ratcliffe, M., Millar, R., & Duschl, R. (2003).
What “ideas-about-science” should be taught in school science? A delphi study of the expert community. Journal of Research in Science Teaching, 40(7), 692-720.
Paechter, M., Rebmann, K., Schloemer, T., Mokwinski, B., Hanekamp, Y., &
Arendasy, M. (2013). Development of the oldenburg epistemic beliefs questionnaire (OLEQ), a German questionnaire based on the epistemic belief inventory (EBI). Current Issues in Education, 16(1), 1-18.
Rebelo-Pinto, T., Pinto, J.C., Rebelo-Pinto, H., & Paiva, T. (2014). Validation of a three-dimensional model about sleep: Habits, personal factors and environmental factors. Sleep Science, 7(4), 197-202.
Schraw, G., Bendixen, L.D., & Dunkle, M.E. (2002). Development and validation of the Epistemic Belief Inventory (EBI). In: Hofer. K., &
Pintrich, P.R., (Eds.), Personal Epistemology: The Psychology of Beliefs about Knowledge and Knowing. Mahwah, NJ, US: Lawrence Erlbaum Associates Publishers. p261-275.
Streiner, D.L. (2003). Starting at the beginning : An Introduction to Coefficient Alpha and Internal Consistency. Journal of Personality Assessment, 80(1), 99-103.
Summers, R., & Abd-El-Khalick, F. (2017). Development and validation of an instrument to assess student attitudes toward science across grades 5 through 10. Journal of Research in Science Teaching, 55(2), 172-205.
Teo, T. (2013). Examining the psychometric properties of the epistemic belief inventory (EBI). Journal of Psychoeducational Assessment, 31(1), 72-79.
Tsai, C.C., Jessie, H.H.N., Liang, J.C., & Lin, H.M. (2011). Scientific epistemic beliefs, conceptions of learning science and self-efficacy of learning science among high school students. Learning and Instruction, 21(6), 757-769.
Vhurumuku, E. (2010). The impact of explicit instruction on undergraduate students’ understanding of the nature of science. African Journal of Research in Mathematics, Science and Technology Education, 14(1), 99-111.
Worthington, R.L., & Whittaker, T.A. (2006). Scale development research:
A content analysis and recommendations for best practices. The Counseling Psychologist, 34(6), 806-838.