KENESEI, ZSÓFIA., KESZEY, TAMARA: (2014): An enhanced SERVQUAL approach to measure service quality in higher education, In: Bigné, E. (szerk.): Paradigm
Shifts & Interactions, European Marketing Academy & University of Valencia, Spain., pp. 148-155.
(ISBN:978-84-370-9453-3)
Abstract
This paper explores the factors of service quality in higher education and how they contribute to the overall satisfaction and behavioral intentions of students. Our research has three facets. The first is a conceptual issue: using different instrument for the measurement of academic and administrative quality as opposed to an overall assessment of quality. The second is a measurement issue: measuring directly disconfirmation instead of separately measuring perception and expectation. The third issue concerns the concept of minimum service quality level versus an ideal one (zone of tolerance), and their inferences with the disconfirmation concept.
Keywords: Service quality, SERVQUAL, higher education, zone of tolerance Track: Marketing of Public and Non-profit Organisations
Introduction
Higher education is internationalized through the mobility of instructors and students. In the frame of the Erasmus program, for example, more than 230,000 students study abroad and 50,000 academic and staff members visit partner universities annually (ec.europa.eu). On the other hand quality assurance programs are established throughout the world in higher education (Quinn et al., 2009; Harvey and Williams, 2010). Scholars agree that the measurement of service quality is important from a theoretical perspective and also as a trigger of achieving superior performance. However development of the right measurement tool is still a challenge.
Traditionally, the original SERVQUAL measurement instrument has been used with some industry specific modifications (e.g. Firdaus, 2006). However, in spite of its’ academic relevance, less attention has been devoted on how these modifications actually change measurement results (Finn and Kayande, 2004). In most of the cases of the use of SERVQUAL tools in higher education, the original Expectation-Perception approach is utilized, without taking into account the psychometric concerns of computed differences. On the other hand, the concept of the zone of tolerance (ZT) raises the question of the basis of expectation formation.
The purpose of our paper is to give an alternative approach to measuring service quality in higher education context by using SERVQUAL scale, where we measure disconfirmation directly compared to ideal and minimal requirements of students.
SERVQUAL in HE
There is an increasing need from higher education institutions to improve service quality.
Therefore significant efforts are devoted to implement quality assurance initiatives (summary by Quinn et al., 2009). Surprisingly, scholars have yet failed to establish a consensus on how to measure service quality in higher education context Former studies use the gap analysis method based on the disconfirmation paradigm (Parasuraman et al., 1991; 1994; Parasuramann et al., 1988) and measures perceptions and expectations using the calculated difference for quality assessment (Long et al., 1999; Lampey, 2001; Ibrahim et al, 2013). Whereas some researchers are opting for the use of importance-performance analysis approach that – besides measuring the perceptions – also captures the importance weights of the different dimensions (Angell et al., 2008; Wright and O’Neill, 2002), Other scholars based on work by Cronin and Taylor (1994) measure only the performance as a proxy of service quality (Bayraktarouglu and Atrek, 2010;
Firdaus, 2006). Attempts to compare different measures in terms of measurement accuracy fail to reach conclusive results as there is an ongoing debate regarding the performance outcomes of various measure approaches (Firdaus, 2006 has favoured HEdPerf, while Brochado, 2009 has found SERVPERF and HEdPerf to perform best). The aim of this paper is to provide a measurement approach that avoids the psychometric problems of the gap analysis (see later) by using direct measurement of disconfirmation.
An issue that appears from time to time in research articles about HE quality is the difference between academic and administrative quality. Although we did not find any paper on the direct comparison, there are some articles where administrative quality is included in the assessment.
Most of these studies use the same questionnaire and include questions on administrative staff and academics or questions on academic aspects and administrative aspects at the same time (see e.g.Ledden, 2011; Mai (2005); Ibrahim et al.2013, Firdaus, 2006; Tan and Kek, 2004). However we did not find any result that distinguishes the evaluation of the two type of “frontline” in higher education: lecturers and administrative staff. Our claim is that in the case of higher education there is a difference in the quality perception of the core product (teaching) and that of the supplementary or facilitator services (administration). On the other hand, both are important factors in the overall satisfaction of students. This approach has general implications for those kinds of services where there are distinct front line employees for core and supplementary services (e.g. health care or higher education).
Our claim is based on the assumption that there is a difference in the quality perception of administrative staff and academic staff in student evaluations. We suggest that the general
evaluation of university service quality does not give as accurate a result as the separate measurement of administration and teaching.
Proposition 1a: Quality perception is significantly different for administrative and educational quality in higher education.
Direct vs. indirect measures of disconfirmation
Brown et al. (1993) and Peter et al. (1993) have criticized the SERVQUAL method of using difference scores. Other research has confirmed these concerns (Smith, 1994; Van Dyke et al., 1997) and suggests using a measured disconfirmation over a computed one. Based on an extensive study, Dabholkar et al. (2000) found that measured disconfirmation outperforms computed disconfirmation in all of the criteria used. They suggest employing direct measures of disconfirmation over a separate measurement of perceptions and expectations if the goal is to measure the gap and provide process improvement ideas to management (they suggest performance only type measurement in other cases).
In spite of these research results service quality research in a HE context have used the computed gap scores and only few apply direct measurement (Ledden,2011). As our own previous research results support these concerns, we suggest accepting these research results and suggestions of the above research and propose that direct measurement is adequate in the HE context and gives a proper model fit.
Proposition 2: The direct measurement of disconfirmation gives a good model fit in the HE context.
Expectations and zone of tolerance
The gap model and any measurement of the difference between expectations and perceptions calls attention to the question of what the basis of expectations are in this comparison. Zeithaml et al. (1993, 1996) distinguishes between concepts of desired service level, minimum service level and actual service level. Further, Parasuraman (2004) conceptualized the concept of “zone of tolerance” as the difference between the adequate (minimum) and desired (ideal) level of service. If service experience falls between these two levels, then customers will be satisfied. If perceived service quality is higher than the top level of the zone, they will perceive an exceptionally high quality, and if it is under the bottom level, they will be unsatisfied. Results on the usefulness of this concept in identifying the key areas that the service provider needs to focus quality improvement efforts on are numerous in academic research (summary in: Stodnick and Marley, 2013). One type of research, such as Zeithaml et al. (1996), Teas and DeCarlo, (2004) and Yap and Sweeny (2007), has used dummy variables to measure service perception bellow or above the ZOT. Their results, although mixed in indicating that the positive relationship between perceived quality and satisfaction or loyalty, are not always different across the zone of tolerance. In other words, all changes in quality worth being equal, i.e. higher quality leads to higher satisfaction in every case. In a longitudinal study, Stodnick and Marley (2013) have demonstrated the existence of the tolerance zone, and suggested that exceeded expectations result in higher satisfaction, while not meeting expectations, satisfaction decrease can be huge.
Other researches have calculated the zone of tolerance as a difference, either as one construct (ZOT) or two constructs, such as MMS (the Measure of service superiority) and MSA (the Measure of Service Adequacy), with the formulation of the constructs being the computed difference scores (Parasuraman et al., 1994; Walker and Baker, 2000; Nadiri et al., 2009).
In spite of the positive results, psychometric concerns of difference scores exist. To overcome this problem we suggest measuring direct disconfirmation in both contexts, compared to the ideal and to the minimum level of expectations. Following the suggestions presented above and to incorporate the concept of ZOT, we use the direct measurement of perceptions compared to the minimum level of expectation and the direct measurement of perceptions compared to the ideal level of service quality. We propose that there is a difference between the two measures (suggesting the existence of a tolerance zone) and that there is a difference in the explanatory power of the two models based on the two types of measurement.
Proposition 3: There is a difference between the explanatory power of the ideal level disconfirmation and minimal level disconfirmation model.
Measurement model
The context of our research is the well established quality – satisfaction - behavioral intentions relationship (Cronin, et al. (2000)). As our purpose is not the validation of the model, we have merely applied it in the higher education context. On the basis of our model specifications, we state 3 hypotheses based on our proposed research model.
H1: The higher students rate their quality perception compared to their expectations, the higher their satisfaction.
H2: The more satisfied students are, the higher their loyalty will be.
H3: The higher students rate their quality perception compared to their expectations, the higher their loyalty will be.
Method
Undergraduates (N=288) of a European public university completed the study. Course credits were offered as incentives. Participants were randomly assigned to the questionnaires on either general service quality of the university, SQ of the educational work and staff, or SQ of the administrative work and staff1. All three groups filled in a questionnaire using the SERVQUAL scale on their perception of SQ compared to their minimal requirements and compared to their ideal level of SQ.
To measure the constructs in our conceptual framework we used seven-point Liker-type multi- item scales. Higher education service quality was measured with the original SERVQUAL scale developed by Parasuramann et al. (1991). As our goal is not to test the reliability of the scale in HE context we accept it as the most widely used instrument for SQ measurement (even though we are aware of the controversial issues of SERVQUAL, see Van Dyke et al., 1999; Buttle, 1996). Service quality was defined as a second order factor with 5 first order reflective factors (Parasuraman et al., 2005) specified by scale items as reflective indicators of the latent construct composed by16 items. Satisfaction has been measured with one single item: “I am satisfied with my choice of studying on this university” (Bergkvist and Rossiter, 2007). Loyalty was measured with 3 items based on the work of Zeithaml et al. (1996). We were using identical scale items for measuring HE service quality compared to the minimal and ideal requirements. All Cronbach alpha values – where applicable - were above 0.70, the threshold recommended by Nunnaly (1978). We ran a single CFA grouping for all the multi-item measures. The model thus specified showed a good fit (CMIN=2.063/2.298; GFI=0.923/0.924; AGFI=0.886/0.875;
CFI=0.971/0.970; RMSEA=0.060/0.067; PCLOSE=0.072/0.013) for minimal and ideal requirements, respectively. All factor loadings are statistically significant and above 0.50 (Anderson and Gerbing 1988). After assessing our measurement models, we checked for construct validity. All constructs show acceptable values of composite reliability (>.60). The average variance extracted (AVE) values are greater than 0.50 (Bagozzi and Yi 1988), and the square of the inter-correlation between two constructs is less than the AVE estimates of the two constructs for all pairs of constructs signalling discriminant validity (Fornell and Larker 1981).
Analysis and results
We tested our hypotheses using a set of methods combining structural equation modelling analysis; multi-group analysis and independent samples t-tests. First we present the results of the model fit, then we present our results based on our propositions.
1 Example of questions:
General quality: „ Compared with your minimal/ideal service level XYZ University’s service level is …(much lower…same…much higher) in : Employees giving you prompt service.”
Educational quality: „ Compared with your minimal/ideal service level XYZ University’s educational service level is …(much lower…same…much higher) in: Lecturers giving you prompt service.”
Administrative quality: „ Compared with my minimal/ideal service level XYZ University’s administration service level is …(much lower…same…much higher) in: Administrative staff giving you prompt service.”
Based on our reference model we stated 3 hypothesis that were tested by SEM using SPSS Amos 20. Our results (Table 1) support H1 as service quality has a significant positive effect on satisfaction (b=.38; p<.001). H2 is also supported as more satisfied students tend to be more loyal (b=.93; p<.001). H3 however is not supported as service quality in our sample does not have a direct positive impact on loyalty (b=.00; p=n.s.).
Table 1 Comparison of service quality perception, structural equation modelling of HE service quality compared to minimal and ideal requirements
SEM Perception of service quality compared to minimal
Perception of HE service quality compared to ideal
Standardized regression weights
SQ=>sat 0.35*** 0.42***
sat=>loyalty 0.92*** 0.89***
SQ =>loyalty -0.03 0.02
Model Fit of SEM χ2(624)/df=1.943; GFI=.83; AGFI=.85, CFI=.93; RMSEA=.041, PCLOSE=1.00
χ2(624)/df=2.494; GFI=.78; AGFI=.71, CFI=.90; RMSEA=.051, PCLOSE=.27 Notes: *** p-value < 0.01; ** p-value < 0.05; * p-value < 0.10
Table 1 presents our result on our second and third propositions. The results show that direct measurement of the differences between expectations and perceptions gives good model fit in both cases (compared to minimal or ideal) suggesting that this type of measurement of disconfirmation is a viable alternative to the computed difference type of measurement with the advantage of using only one scale thus avoiding the psychometric concerns of computed difference (Brown et al. (1992) and Peter et al. (1993).
On the other hand, our results show better fit for the “minimal” model (χ2 difference is significant for SEM results (∆χ2=352 (1); p<0.01), and all of the fit indexes perform better).
This result suggests that although both measurement models work well, using the “minimal”
level approach gives better estimates of the relationship between the antecedent SQ variables and the dependent variables.
Our first proposition suggests that there is a difference between educational and administrative quality perception in case of higher education. To check this statement we first compared the three models (general quality assessment, educational quality assessment, administrative quality assessment based on the perception compared to minimal requirements) and found no difference in the regression weights (Table 2) suggesting that all three model gives the same results on the relationship between quality perception and satisfaction-loyalty (none of the z-scores is significant).
Table 2 Comparison of differences of regression weights across sub-samples for the model of service quality compared to minimal requirements
Standardized regression weights
Unstandardized regression weights z score comparsion
Total Total General Education Admin General/
Education
Education/
Admin
Admin/
General SQ=>sat 0.38*** 0.915*** 1.067*** 1.077*** 0.688** 0.027 -1.112 0.878 sat=>loyalty 0.93*** 0.852*** 0.812*** 0.843*** 0.911*** 0.359 0.847 -1.192
SQ =>loyalty 0.00 0.003 -0.078 0.108 0.004 1.012 -0.676 0.418
Model fit χ2(624)/df=1.943 GFI=.83; AGFI=.85, CFI=.93; RMSEA=.041, PCLOSE=1.00 Notes: *** p-value < 0.01; ** p-value < 0.05; * p-value < 0.10
On the other hand comparing the means of the SQ dimensions (Table 3) resulted significant differences in the overall quality assessment (averaging all the items of the SQ scale) and for three dimensions of the scale (averaged item means).
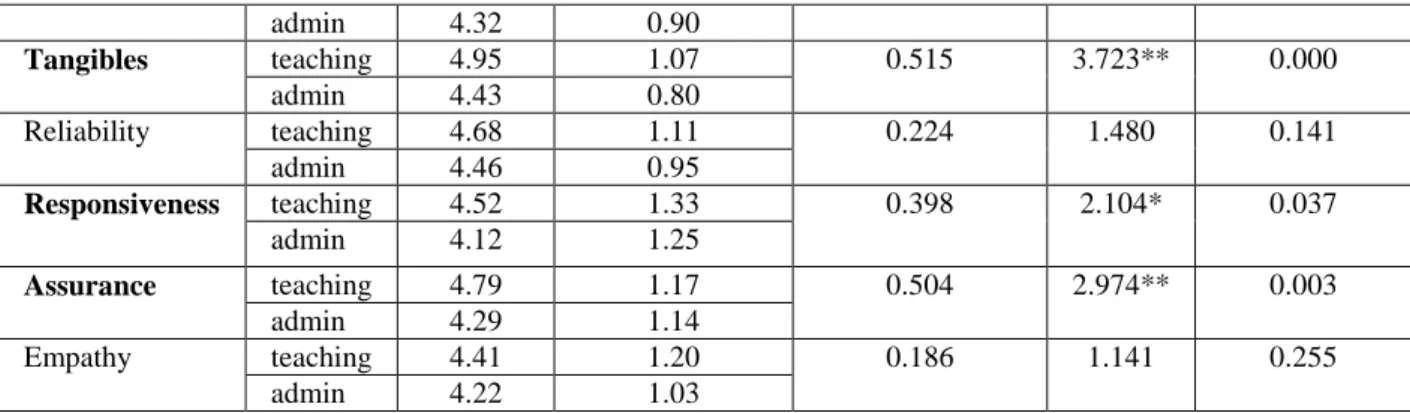
Table 3 Comparison of service quality means across sub-samples for the model of service quality compared to minimal requirements
SQ dimensions Type Mean Std. Deviation Mean Difference t-value Sig. (2-tailed)
SQ (all items) teaching 4.69 1.05 0.363 2.531* 0.012
admin 4.32 0.90
Tangibles teaching 4.95 1.07 0.515 3.723** 0.000
admin 4.43 0.80
Reliability teaching 4.68 1.11 0.224 1.480 0.141
admin 4.46 0.95
Responsiveness teaching 4.52 1.33 0.398 2.104* 0.037
admin 4.12 1.25
Assurance teaching 4.79 1.17 0.504 2.974** 0.003
admin 4.29 1.14
Empathy teaching 4.41 1.20 0.186 1.141 0.255
admin 4.22 1.03
** p<0.01; * p<0.05
Table 3 shows that administrative quality is lower for all dimensions, while the difference is significant only in case of Tangibles, Responsiveness and Assurance. This result provides support for our proposition. There is difference in the perception of SQ concerning educational versus administrative quality, but the difference is mainly in the appearance of physical facilities and personnel (tangibles), in the willingness to help and provide prompt service (responsiveness) and in the knowledge and courtesy of employees (assurance). The dimensions of accurate service (reliability) and caring and individualized attention (empathy) resulted no difference between the two sub-groups. Due to space constraints we do not report the numbers on the difference between the general evaluation and the specific service oriented evaluation (teaching – administration) but we can state that educational SQ is significantly different only in the assurance dimension, while administration SQ is different in the tangibles and reliability dimensions from the general assessment of service quality.
Discussion, future directions and limitations
First, this research shows that direct measurement of the gap model gives good model fit and a viable option instead of the computed difference measurement method. Second, this study found that based on the Zone of Tolerance concept, there is a difference in the ideal and minimal level of accepted service. Based on our results, measure of perceptions compared to adequate (minimally expected) level of service gives better model fit thus more suitable to measure the relationship between service quality, satisfaction and loyalty. Our results on the service quality scores (that may of course differ at each university) offer important implications for higher education and other service companies that have different staff and different procedures for the core service and supplementary services (e.g. health care) in terms of the importance of measuring the quality perception for both type of services. The general assessment of quality perceptions (as it is proposed in the original SERVQUAL scale) may be misleading and can give mixed and sometimes misleading result for quality improvement programs.
Our study has several limitations. First, our sample is relatively small and specific. Second, ideal and minimal expectations were measured by the same respondents. Third, concerning our results on the quality perception difference between academics and staff must be elaborated. While our research highlights important aspects of quality measurement in higher education, the result should be tested in other institutions and on a broader sample. On the other hand this research is focusing primarily on the public sector (state owned higher education institutions) thus the results may not be adequate for privately owned institutions. The difference between administration and educational quality in case of a privately owned (and often equipped with better organized and paid staff) may diminish. Still it is a question to be addressed.
References
Angell, R. J., Heffernan, T. W., & Megicks, P. (2008). Service quality in postgraduate education. Quality Assurance in Education, 16(3), 236–254.
Barnes, B. R. (2007), Analysing Service Quality: The Case of Post-Graduate Chinese Students. Total Quality Management, 18(3), 313–331.
Bayraktaroglu, G., and Atrek, B. (2010). Testing the superiority and dimensionality of SERVQUAL vs. SERVPERF in higher education. The Quality Management Journal, 17(1), 47–59.
Bergkvist, L.and Rossiter, J.R.,(2007): The predictive validity of multiple-item vs single item measures of the same construct. Journal of Marketing Research 44 (2), 175–184.
Brochado, A.(2009): Comparing alternative instruments to measure service quality in higher education. Quality Assurance in Education Vol. 17 No. 2, pp. 174-190
Brown, T. J., G. A. Churchill, Jr., and J. Paul Peter (1993), "Improving the Measurement of Service Quality," Journal of Retailing, 69 (Spring).
Buttle, Francis (1996): SERVQUAL: review, critique, research agenda. European Journal of Marketing 30,1 8-32 Cronin, J. J., Brady, M. K., and Hult, T. M. (2000). Assessing the effects of quality, value,. As our purpose is not the
customer satisfaction on consumer behavioral intentions in service environment. Journal of Retailing, 76(2), 193–
216.),
Cronin, J. J., & Taylor, S. A. (1994). SERVPERF versus SERVQUAL: reconciling performance-based and perceptions minus expectations measurement of service quality. Journal of Marketing, 58(1), 125–131.
Dabholkar, P. A.; Shepherd, C. D.; Thorpe, D. I. (2000): A Comprehensive Framework for Service Quality: An Investigation of Critical Conceptual and Measurement Issues Through a Longitudinal Study. Journal of Retailing.
Summer, Vol. 76 Issue 2, 139-184
Finn, Adam and U. Kayande (2004): Scale modification: alternative approaches and their consequences. Journal of Retailing 80, 37–52
Firdaus, A. (2006), “The development of HEdPERF: a new measuring instrument of service quality for the higher education sector”, International Journal of Consumer Studies, Vol. 30, No. 6, pp. 569-81.
Harvey, Lee , J. Williams (2010): Fifteen Years of Quality in Higher Education. Quality in Higher Education, Volume 16, Issue 1, 3-36
Hill, F. M. (1995). Managing service quality in higher education: the role of the student as primary consumer. Quality Assurance in Education, 3(3), 10–20.
Ibrahim, E., L. Wei Wang and A. Hassan (2013): Expectations and Perceptions of Overseas Students towards Service Quality of Higher Education Institutions in Scotland. International Business Research; Vol. 6, No. 6; 20-30
Mai, L.-W. (2005). A comparative study between UK and USA: The student satisfaction in higher education and its influential factors. Journal of Marketing Management 21(7/8), 859–878.
Lampley, J. H. (2001). Service quality in higher education: expectations versus experiences of doctoral students.
College and University, 77(2), 9–14.
Ledden, L., S. P. Kalafatis, and A. Mathioudakis (2011): The idiosyncratic behaviour of service quality, value, satisfaction, and intention to recommend in higher education: An empirical examination. Journal of Marketing Management, Vol. 27, Nos. 11–12, October, 1232–1260
Nadiri, H., Kandampully, J. and Hussain, K. (2009), “Zone of tolerance for banks: a diagnostic model of service quality”, Service Industries Journal, Vol. 29 No. 1, pp. 1547-64.
Parasuraman, A. (2004). Assessing and improving service performance for maximum impact: Insights from a two- decade-long research journey. Performance Measurement and Metrics, 5(2), 45–52.
Parasuraman, A., Zeithaml, V. A., and Berry, L. L. (1988). SERVQUAL: a multiple-item scale for measuring consumer perceptions of service quality. Journal of Retailing, 64(1), 12–40.
Parasuraman, A., Berry, L. L., and Zeithaml, V. A. (1994). Reassessment of expectations as a comparison standard in service quality measurement: implications for future research. Journal of Marketing, 58(1), 111–124.
Parasuraman, A., Zeithaml, V.A., Malhotra, (2005): A.: E-S-QUAL: A Multiple-Item Scale for Assessing Electronic Service Quality. Journal of Service Research 7, 213–234
Peter, J. P., Churchill, jr., G. A.and Brown, t. J. (1993) :Caution in the use of difference scores in consumer research.
Journal of Consumer Research, Vol. I, March, 655-662
Quinn, Anita G. Lemay, P. Larsen and D. M. Johnson (2009): Service quality in higher education. Total Quality Management, Vol. 20, No. 2, February , 139–152
Sander, P., Stevenson, K., King, M., & Coates, D. (2000). University students’ expectations of teaching. Studies in Higher Education, 25(3), 309–323.
Stodnik, M., and K. A. Marley (2013): A longitudinal study of the zone of tolerance. Managing Service Quality Vol. 23 No. 1, pp. 25-42
Teas, R. and DeCarlo, T. (2004), “An examination and extension of the zone-of-tolerance model: a comparison to performance-based models of perceived quality”, Journal of Service Research, Vol. 6 No. 3, pp. 272-86.
Yap, K. and Sweeney, J. (2007), “Zone-of-tolerance moderates the service quality-outcome relationship”, Journal of Services Marketing, Vol. 21 No. 2, pp. 137-48.
Van Dyke, T.P. and V.R. Prybutok, L.A. Kappelman (1999): Cautions on the use of the SERVQUAL measure to assess the quality of information systems services. Decision Sciences, 30 (3) (1999), pp. 877–891
Walker, J. and Baker, J. (2000), “An exploratory study of a multi-expectation framework for services”, Journal of Services Marketing, Vol. 14 No. 5, pp. 411-29.
Wright, C., and O’Neill, M. (2002). Service quality evaluation in the higher education sector: an empirical investigation of students’ perceptions. Higher Education Research & Development, 21(1), 23–39.
Zeithaml, V.A., Berry, L.L. and Parasuraman, A. (1996), “The behavioral consequences of service quality”, Journal of Marketing, Vol. 60 No. 2, pp. 31-46.