T
Szilárd Hegedűs – Csaba Lentner
Comparative Analysis of Budgetary Indicators of European Municipal
Subsystems in the Post-Crisis Term between 2009–2018
Summary: The aim of our research was to analyse trends in the fiscal indicators of municipalities in the countries of the European Union and the European Economic Area. To that end, we examined the municipal fiscal indicators between 2009 and 2018 across 31 European countries that report regularly to Eurostat. In our research, we sought answers to three main yet related research questions.
Ad 1. How has the crisis affected the operation of European municipal systems? Ad 2. In which way has it influenced the different groups of countries defined in public law and European regional context? Ad 3. How did the characteristics of the local authorities governed by public law changed, that is, how did the classical system characteristics change evaluated by fiscal indicators in the light of the crisis and the crisis management measures made in response to it? We used methods of descriptive statistics, as well as cluster analysis and variance analysis to verify our hypotheses. In our study, we concluded that the crisis has made a significant impact on local government fiscal indicators, however, it had a different impact on the post-Soviet region, the Mediterranean region and the Scandinavian countries. The Rhine (public law) model has proved to be the most crisis-resistant. It has been proved that the specifics described by fiscal indicators do not fully correspond to the municipal system models under public law. At the end of our research, the characteristics of the Hungarian local governmental system following the municipal reform were presented.
KeywordS: financing local governments, budgetary indicators, economic crisis, crisis management, European local governments, Hungary JeL codeS: H71, H72, H73, H74
doI: https://doi.org/10.35551/PFQ_2020_1_8
The crisis escalating in 2007–2008 created massive problems in the eu, and government budgets and their local subsystem have not remained immune to this trend, either. Many times, the crisis management measures came with the transformation of the regulatory
environment and the implementation of reforms, as the fiscal crisis management also allowed for the implementation of comprehensive measures. The experiences of the 10 years following the outbreak of the crisis provided sufficient information for us to evaluate the long-term impacts of the crisis in europe, and, within the same, in Hungary.
E-mail address: lentner.csaba@uni-nke.hu
The novelty of the study is brought by the fact that we can analyse the impacts generated by the crisis and the period following the same on the fiscal indicators of the municipal subsystem of the countries examined, and then based on that, the impact on the models under public law and interpreted on an european regional basis and how it transformed their system characteristics. The importance of local subsystems varies by country, yet the territorial units of the government budget have an important role in performing public duties, as this level is in contact with citizens in the most direct manner and so a direct impact influences the quality of life of the population through the public services provided.
REvIEW oF lITERATURE
in the course of reviewing the literature, we examined two dimensions that are important from the point of our topic. One of them is the municipal system models and the other one is the factors and regulatory environment influencing the fiscal variables of the local government subsystem.
The european local governments can be categorised into system models by different characteristics, out of which the literature mentions three main categories:
• the Federeal (Rhein) model,
• the Mediterranean model,
• the Scandinavian model (Aggod-Fekó, 2007).
The Federal model1 is typically a transition between the more distinctive Scandinavian and Mediterranean models. While the Scandinavian2 model is characterised by large municipalities, significant extent of public duties and availability of budgetary resources, the southern, Mediterranean3 model is characterised by the strong division of municipal levels, the weak obligation of
local governments to fulfil public duties and limited revenues (Loughlin, Seiler, 2001;
Proud’homme, 2006). The examination of these characteristics is related to the third research goal.
in addition to these aspects, the local governments can also be defined from a geopolitical point of view. This way, we can differentiate between countries from post- Soviet regions, Southern european countries and developed Western and Northern european countries. We considered these decisive factors in answering our second research question.
De Melo (2000) evaluated the impact of budgetary transfers on the system and fiscal decentralisation of municipalities. He found that in the 30 examined countries, the quality of intergovernmental relations has a dominant impact on fiscal variables and the balance of the budget of local authorities.
After the economic crisis, many countries decided to introduce budgetary rules for the preservation of the financial 'health' of the local level (denilson, Guo, 2015).
The methods of these were the following:
• balanced local budget and/or defined reduction target: Austria, estonia, Finland, Greece, italy, the Netherlands, Poland, Portugal, Slovakia, Spain, Sweden, united Kingdom: england, Scotland and Wales,
• the regulation of taking out loans:
Belgium, Croatia, France, Luxembourg, Slovenia, united Kingdom: Northern- ireland, Romania,
• the combination of the two: The Czech Republic, denmark, Germany, Hungary, ireland, Latvia (Vértessy, 2019). understanding the regulatory environment is used in elaborating our first aim.
The most characteristic changes took place in two out of the examined countries.
in Hungary,4 balanced budget-planning
was introduced in the framework of a constitutional reform, and taking out loans was subjected to approval. italy incorporated the constitutional budgetary stability into the regulation of local governments (Bethlendi, Lentner, 2018; Geißler et al., 2018).
RESEARcH METHodology
We applied secondary testing in our analysis, in the course of which we sought to find out to what extent the budgetary indicators of local governments have changed between 2009 and 2018. to that end, we divided the examined interval into two sections. We have averaged the fiscal variables of the countries’ municipal systems. in the analysis of the specific years, the mean (as a method of descriptive statistics) was very close to the median, and so the statistical indicator characterises well the examined population. The first section was between 2009 and 2013, which is the period of the financial crisis and recovery from the same. The second section is the term between 2014 and 2018, encompassing the relatively consolidated period after the crisis. So we reduced the time horizon from the ten years of data to two periods. The delineation of periods have special Hungarian aspects, too, as the new municipal regulation was fully effective from 2014 and certain consolidation measures were also effected. The variables examined:
• the revenues of the municipal sector in GdP percentage (LGRavg0914 and LGRavg1418),
• the balance of the budget of the municipal sector in GdP percentage (calculation of BLavg0913 and BLavg1418: balance/
GdP),
• local centralisation rate – the rate of municipal revenues within general government revenues in GdP percentage (calculation of LGRevRate0913 and
LGRevRate1418: revenues of the municipal sector/total general government revenue),
• expenditures of the municipal sector in GdP percentage (LGexpavg0913 and LGexpavg1418),
• local tax revenues in GdP percentage (calculation of LGtaxR0913 and LGtaxR1418: local tax revenues/GdP),
• taxation autonomy (calculation of tiratio0913 and tiratio1418: local tax revenues/revenues of the municipal sector).
We subjected the generated fiscal variables to descriptive statistical tests for the two terms (as seen in their names), and we performed a Ward-type hierarchic cluster analysis, standardising the variables by Z-Scores, which is the most popular method in social research.
Following the Ward-procedure we fixated the centres of clusters with K-means procedure.
For the validation of clusters, we applied variance analysis. The source of data was the eurostat database, from which we took the variables as basis and we calculated the derived variables from them.
in addition, as the test sample made it possible, we also calculated difference variables, and marked the original variables with d. We performed descriptive statistical analysis and cluster analysis on the difference variables.
We applied an SPSS program package for our tests.
We formulated three hypotheses in our study:
H1. Our first hypothesis is that the crisis also had a negative impact on the local subsystem through national economy, and this is also shown by the examined fiscal variables (revenues, local taxes, balance of the budget).
We examined the first hypothesis with a descriptive statistical method.
H2. in our second hypothesis, we suggest that the crisis had a different impact on the various geographical and political regions of
europe, the local authorities applied different crisis management strategies and different functions of public finances were put into focus. We tested this with cluster analysis and a descriptive statistical method.
H3. According to our third hypothesis, the general characteristics of municipal system models under public law are less justifiable by economic indicators. We examined this with a cluster analysis.
However, we would like to emphasise that the economic schools are divided in terms of whether it is possible to forecast the future from past data (Móczár, 2017/a; 2017/b), therefore, we put the revelation and identification of patterns in the focus of this study.
RESEARcH RESUlTS
The statistical analysis and its results
We start the presentation of the secondary research with the descriptive statistical analysis of the examined variables: in the course of this, we examine the median, the mean, standard deviation and decimates – decades.
The first two columns of the table show the revenues of local governments. The GdP- proportionate minimum value is 0.7% and 0.4% in the two periods, both low values were observed in Malta, which indicates that the municipal sector plays an insignificant role in financing public duties. in both period variables of the examined period, the revenue of the municipal sector took the maximum value in denmark.
The data shows that the average value of municipal revenues follows decreasing tendencies in the two periods, and the decrease is of a small extent: it dropped from 10.7% to 10.4%. The percentile shows the maximum value of the countries belonging to the specific decades. The growth rate of
revenues is the highest in two decades (8th and 9th decade). it can be observed in the two terms that the average value between 2014 and 2018 decreases in every decade except for the 9th. This is explained by the fact that in the period between 2009 and 2013, and, especially, during the years of the aggravation of the crisis, the GdP dropped in a significant part of european economies, based on which the revenues represented a higher share owing to the lower cost driver. in the other examined period, GdP growth exceeds the revenues of the local subsystem in the majority of examined countries – the decrease can be observed owing to this. Another dominant factor influencing municipal revenues is the statutory role of municipal subsystem in task performance, and the positioning of the entirety of the government budget.
typically, the revenues of local governments are the highest in Scandinavian countries, in denmark as already mentioned before, as well as in Sweden and Finland. Although it falls behind Scandinavian countries, but the revenues of the local level exceed the average of 31 countries in italy and the Netherlands.
The mean of the balances of the budget can be found in the third and fourth columns of Table 1. two distinct processes can be observed by analysing the data. On of them is that the crisis had a significant influence on the financial management of municipal subsystems,5 as in the period between 2009 and 2013, budget deficit was typical in 70% of the countries examined, i.e. in 21 countries. This means that in the years of the crisis, the possibilities of stabilisation function (reinvigorating against the deficit) were also used on a local level, which implies that they had higher expenditures along equal or decreasing levels of revenues. This is what happened in the Netherlands, Poland and Latvia. On the other hand, as a result of the budgetary restriction, the share of revenues decreased, or the tasks
increased, this way generating a deficit in financial management. The latter took place in Hungary,6 iceland and Romania. Therefore, it can be concluded that if the world economy or the economy of a country suffers a crisis, its spillovers will have a permanent effect on the operation and financial management of local governments. Out of two factors, the first effect, the local restriction function has permanent implications, since the permanent deficit is the most typical in the countries applying this solution: in the Netherlands,
Poland and Latvia. it was revealed from the analysis of background variables – budget deficit in the given year – that 2014 was the trend reversal: from that year onwards, the municipal subsystems of the majority of the countries examined managed to eliminate their deficit.
The period starting from 2014 seems like a new era, which is further supported by the fact that 65% of the examined countries, i.e. the municipal subsystems of 20 countries left off the positions characterised by deficit. This can The descripTive sTaTisTical analysis of The examined variables
lGravg0913 lGravg1418 blavg0913 blavg1418 lGrevrate0913 lGrevrate1418 lGexpavg0913 lGexpavg1418 lGtaxr0913 lGtaxr1418 Tiratio0913 Tiratio1418
N Available 31.0 31.0 31.0 31.0 31.0 31.0 31.0 31.0 31.0 31.0 31.0 31.0 No data
available
0.0 0.0 0.0 0.0 0.0 0.0 0.0 0.0 0.0 0.0 0.0 0.0
Mean 10.9 10.3 –0.2 0.0 0.3 0.2 10.9 10.3 3.7 3.8 0.3 0.3
Standard deviation 6.9 7.0 0.3 0.3 0.1 0.1 6.9 7.0 3.5 3.6 0.2 0.2
Minimum 0.7 0.4 –0.8 –0.6 0.0 0.0 0.7 0.4 0.0 0.0 0.0 0.0
Maximum 35.7 34.3 0.5 0.6 0.7 0.6 35.7 34.3 13.8 13.7 0.7 0.7
decades
10 3.8 2.6 –0.7 –0.5 0.1 0.1 3.8 2.6 0.5 0.4 0.1 0.1
20 6.7 5.9 –0.5 –0.1 0.2 0.1 6.7 5.9 0.8 0.8 0.1 0.1
30 7.3 7.1 –0.3 –0.1 0.2 0.2 7.3 7.1 1.3 1.2 0.2 0.2
40 8.3 7.9 –0.2 0.0 0.2 0.2 8.3 7.9 1.8 1.7 0.3 0.3
Median 9.9 8.7 –0.2 0.1 0.2 0.2 9.9 8.7 2.6 2.8 0.3 0.4
60 11.2 9.9 –0.1 0.1 0.3 0.3 11.2 9.9 4.1 3.8 0.4 0.4
70 12.3 11.6 –0.1 0.2 0.3 0.3 12.3 11.6 4.6 4.7 0.4 0.4
80 14.5 13.4 0.0 0.3 0.3 0.3 14.5 13.4 5.4 5.9 0.4 0.5
90 21.4 21.4 0.1 0.4 0.4 0.4 21.4 21.4 9.6 10.1 0.6 0.6
Source: own calculations based on Eurostat, from SPSS output
be traced back to two reasons. One of them is the strengthening of budgetary discipline typical in eu countries, and the penetration of rule-based budgetary practices implemented by member states. The latter has already started from 1995 with more or less impacts7 through the Stability and Growth Pact. According to the study of Kotia and Duarte (2016), the budget deficit was higher amongst the countries not applying budgetary rules in the course of the crisis or applying them only to a small extent, but the subnational budget rules increased from 2014. This is further supported by the factor that there is a significant growth in terms of the number of budgetary rules. The other reason can be traced back to the deficit of the municipal system of member states, that is the type of public law system (scope of tasks to be fulfilled by local governments) and government budget perception the given country has. in the period starting from 2014, the deficit of the local level prevailed in mainly the Scandinavian countries (Finland, iceland, Sweden, Norway) and the countries where local governments have a significant role, such as the united Kingdom and the Netherlands.
The rate of locally generated revenues within the total budget revenues measures the local centralisation rate. two factors can be concluded from the data examined:
on the one hand, it can be concluded that the previously established municipal public law position and the role fulfilled in task performance influences local centralisation rate, as it is primarily high in those municipal systems where the municipal sector’s tasks are significant, including the Scandinavian countries, italy and Poland.
The decrease of local centralisation rate can be observed as a general tendency in the period starting from 2014, as the local centralisation rate only increased in 3 countries to a smaller extent based on the examination of the difference variables (Table 2).
Similar values and tendencies can be observed in the examination of expenditures as in the case of revenues, therefore, we will not analyse this in detail.
Comparing the two periods, the rate of tax revenues of the local subsystem took up a similar value in the course of examining distribution, and, therefore, no substantial rearrangement took place. The average value was 3.7%, a slight increase can be observed.
The primary explanation for this is that in the countries where the rate of local tax revenues compared to GdP exceeds the average of the 31 examined countries, the tax revenues typically show an increase in the examined period. This process can be observed in the Czech Republic, where tax revenues increased with 17% during the examined period calculating with the base ratio, and in iceland, where the rate of growth was 16% expressed with base ratio, which can be explained by the transformation of central budgetary transfers and the increase of property tax. Local tax revenues also increased in Latvia during the examined period. in iceland, local revenues dropped significantly during the years of the crisis, and then increased from 2014 onwards. in Latvia, the level of local tax revenues started to increase after 2013 following the stagnation during the crisis, while a substantial increase took place in 2010, after which growth became constant during the period subject to our study. The local tax revenues of the local governments of France, Norway, Spain and Finland produced significant expansion. in these countries, the local tax revenues increased in the years of the crisis, simultaneously to the reduction of central transfers (Geißler et al., 2018).
Naturally, not only growth can be observed amongst local tax revenues by examining in a long time series, but decrease, too. in ireland, starting from 2014, local revenues halved, from the (already low) 1% value. The reason for this is that the tax levied on the value of
real estates reduced as a result of the decrease of the market value of the real estates, and there are no other shared tax revenues in the municipal system (Geißler et al., 2018).
A considerable decrease took place in Slovenia, where the reason was the reduction of sharing the shared tax revenues, personal income tax and real property tax (Klun- Stamburk, 2015).
in Hungary, the crisis made an impact on local tax revenues, which affected the business tax calculated based on net sales revenues adversely owing to the sensitivity of the tax to economic trends, and the reduction of personal income tax revenues during the period of the crisis. After the 2013 reform, shared tax revenues decreased significantly.
in relation to the financing of local governments, it is a requirement set out in the european Charter of Local Self-Governments (Charter)8 that the largest possible rate of revenues should be financed by sui generis revenues, which can typically be the follo- wings:
• local taxes,
• budgetary transfers,
• fees paid by the population,
• capital revenues.
Based on Section 3 of Article 9 of the Charter, local tax base is a key issue, as 'at least part of the financial resources of local authorities shall derive from local taxes and charges of which, within the limits of statute, they have the power to determine the rate.'
descripTive sTaTisTical analysis for difference variables
dr dbl drrate dexp dTxr dTi
N Available 31.0 31.0 31.0 31.0 31.0 31.0
No data available
0.0 0.0 0.0 0.0 0.0 0.0
Mean –0.6 0.3 0.0 –0.6 0.1 0.0
Standard deviation 1.0 0.3 0.0 1.0 0.3 0.0
Minimum –3.7 –0.3 –0.1 –3.7 –0.4 0.0
Maximum 1.4 0.8 0.0 1.4 0.7 0.1
decades 10 –2.3 0.0 –0.1 –2.3 –0.2 0.0
20 –1.3 0.0 0.0 –1.3 –0.1 0.0
30 –1.0 0.1 0.0 –1.0 –0.1 0.0
40 –0.7 0.2 0.0 –0.7 0.0 0.0
Median –0.4 0.2 0.0 –0.4 0.0 0.0
60 –0.3 0.3 0.0 –0.3 0.1 0.0
70 –0.1 0.4 0.0 –0.1 0.2 0.0
80 0.1 0.5 0.0 0.1 0.4 0.1
90 0.5 0.7 0.0 0.5 0.5 0.1
Source: own calculations based on Eurostat, from SPSS output
We examined compliance with the Charter with the taxation autonomy (ti) variable.
The descriptive statistical analyses revealed that the average value of the 31 european countries reporting to eurostat was 0.3% in both periods examined, so tax revenues have a 30% share within local government revenues.
taxation autonomy is low in estonia and Latvia, as they finance local budget in 5%.
The value is low in Germany, too (4%), but this can be traced back to the tax potential of medium-level provincial governments.
tax autonomy is the highest in two Scandinavian countries, in iceland and
Norway, but the rate is also outstanding in Latvia (here the rate of taxes within total revenues increased owing to the decrease of total revenues), in France, in italy and in Spain. By comparing the two periods, taxation autonomy reduced in 5 countries, and the rate of taxation autonomy increased significantly, exceeding 5% in 7 countries. it is a typical process in these countries that both the tax revenues and municipal revenues increased, but the increase of former exceeded the latter, except for Latvia. in addition to the countries presented at the examination of basic variables, the rate of increase of taxation autonomy is
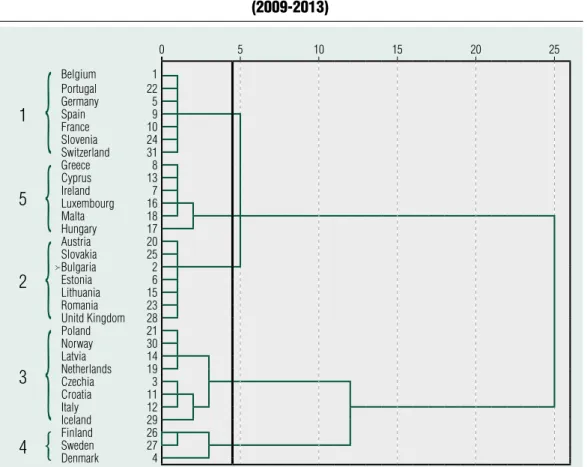
Figure 1 The resulT of The dendoGram for The variables of The firsT period
(2009-2013)
0 5 10 15 20 25
1
Belgium 1
Portugal 22
germany 5
Spain 9
France 10
Slovenia 24
Switzerland 31
5
greece 8
cyprus 13
Ireland 7
luxembourg 16
Malta 18
Hungary 17
2
Austria 20
Slovakia 25
Bulgaria 2
Estonia 6
lithuania 15
Romania 23
Unitd Kingdom 28
3
Poland 21
Norway 30
latvia 14
Netherlands 19
czechia 3
croatia 11
Italy 12
Iceland 29
4
FinlandSweden 2627denmark 4
Source: own calculations based on Eurostat, from SPSS output
{ {
{ {
{
considerable in Portugal, the Czech Republic and Hungary, although this was the result of the reduction of the cost driver, i.e. the total revenues in all three cases.
We performed a cluster analysis for grouping the countries, the result of which is shown by Figure 1 and Figure 2, as well as Table 3 and Table 4 necessary for their interpretation.
during the first cluster analysis, we marked the line of clustering under 5th iteration, with which we considered the creation of 5 clusters justified. We named and examined in detail the clustering criteria based on their main descriptive statistical variables.
The first cluster includes Belgium, Portugal, Germany, Spain, France, Slovenia The disTribuTion of The main indicaTors of The clusTer analysis i.
Ward method lGravg 0913
blavg 0913
lGrevrate 0913
lGexp 0913
lGtaxr 0913
fdratio 0913
1 N 7 7 7 7 7 7
Mean 8.1857 –0.1686 0.1904 8.1857 3.4971 0.4269
Median 7.44 –0.2 0.1796 7.44 3.02 0.4212
Standard deviation 1.84661 0.06094 0.03151 1.84661 0.97348 0.07207
2 N 7 7 7 7 7 7
Mean 9.2257 –0.2314 0.2476 9.2257 0.9514 0.1033
Median 9.66 –0.24 0.2488 9.66 0.78 0.1056
Standard deviation 1.8988 0.10057 0.05864 1.8988 0.50818 0.0464
3 N 8 8 8 8 8 8
Mean 13.38 –0.49 0.3157 13.38 5.0925 0.3896
Median 13.3 –0.6 0.3144 13.3 5.02 0.3809
Standard deviation 1.62657 0.27692 0.03261 1.62657 2.0428 0.16723
4 N 3 3 3 3 3 3
Mean 27.7 –0.2667 0.5236 27.7 11.9133 0.4441
Median 24.48 –0.12 0.4825 24.48 12.08 0.4297
Standard deviation 6.99031 0.30746 0.11989 6.99031 1.99523 0.11387
5 N 6 6 6 6 6 6
Mean 4.44 0.1333 0.1074 4.44 1.05 0.2064
Median 4.22 0.07 0.0999 4.22 0.91 0.2288
Standard deviation 3.43372 0.205 0.07593 3.43372 0.84425 0.1072
Total N 31 31 31 31 31 31
Mean 10.9245 –0.2168 0.2518 10.9245 3.6748 0.3032
Median 9.88 –0.2 0.2314 9.88 2.6 0.3382
Standard deviation 6.91564 0.28148 0.12878 6.91564 3.46962 0.17182 Source: own calculations based on Eurostat, from SPSS output
and Switzerland. Based on the descriptive statistics and the variance analysis, the group can be considered homogenous. They are characterised by the fact that the local government subsystem is in deficit in every country and their revenues and expenditures only exceed median and mean in the case of one country (France). The local tax revenues are average in these countries, but give a dominant share of the total municipal revenues.
The second cluster includes Austria, Slovakia, Bulgaria, estonia, Lithuania, Romania and the united Kingdom. These countries are also characterised by a local
government system in deficit, revenues and expenditures corresponding to the mean of the examined countries, and a below average local tax revenues and taxation autonomy rate.
The countries in the third cluster are the Czech Republic, Croatia, italy, Latvia, the Netherlands, Poland, iceland and Norway.
This group is characterised by the highest extent of deficit, municipal revenues and local tax revenues exceeding the mean and the value of the previous two groups, and a local taxation autonomy level exceeding the mean.
The fourth group is characterised by the fact that they achieved the highest values in
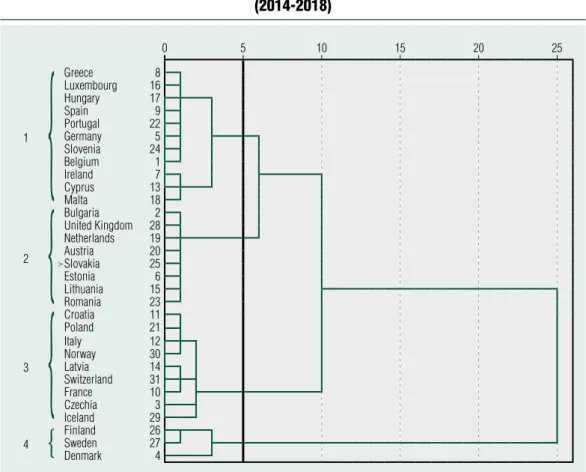
Figure 2 The resulT of The dendoGram for The variables of The second period
(2014-2018)
0 5 10 15 20 25
1
greece 8
luxembourg 16
Hungary 17
Spain 9
Portugal 22
germany 5
Slovenia 24
Belgium 1
Ireland 7
cyprus 13
Malta 18
2
Bulgaria 2
United Kingdom 28 Netherlands 19
Austria 20
Slovakia 25
Estonia 6
lithuania 15
Romania 23
3
croatia 11
Poland 21
Italy 12
Norway 30
latvia 14
Switzerland 31
France 10
czechia 3
Iceland 29
4 Finland 26
Sweden 27
denmark 4
Source: own calculations based on Eurostat, from SPSS output
{ {
{ {
almost all examined indicators. The cluster consisting of Finland, Sweden and denmark is characterised by homogeneity, the highest values achieved in terms of revenues, expenditures, local tax revenues, and taxation autonomy. This group is also characterised by deficient operation, with the second biggest deficit out of the 5 clusters.
The revenues and expenditures of the local level as well as the revenues of the municipal sector within the total revenues are the lowest in the fifth group. The level of local tax revenues and the taxation autonomy indicator
is the second lowest in this group (after the 2nd group). However, a curiosity on top of all of that is that in this group, the budget position of the municipal subsystem of every country in the group consisting of ireland, Greece, Cyprus, Luxembourg, Malta and Hungary is positive (is in a surplus).
The test proceeding of the cluster analysis is the variance analysis, which revealed a significant difference for the variables in terms of all groups examined. The fourth group differs from all the other clusters based on the Scheffe post-hoc test.
The disTribuTion of The main indicaTors of The clusTer analysis ii.
wm1418 lGravg
1418
blavg 1418
lGrevrate 1418
lGexp 1418
lGtaxr 1418
fdratio 1418
1 N 11 11 11 11 11 11
Mean 4.9709 0.2182 0.1146 4.9709 1.925 0.3347
Median 5.86 0.2 0.1348 5.86 2.2 0.3235
Standard deviation 2.7243 0.16185 0.05813 2.7243 1.29962 0.14624
2 N 8 8 8 8 8 8
Mean 9.165 0.045 0.2352 9.165 0.9906 0.106
Median 8.74 0.02 0.2344 8.74 0.925 0.1076
Standard deviation 1.98157 0.18323 0.04805 1.98157 0.5288 0.0478
3 N 9 9 9 9 9 9
Mean 12.0667 –0.0639 0.2731 12.0667 5.7083 0.4846
Median 12.1 –0.06 0.272 12.1 5.775 0.4603
Standard deviation 2.57699 0.34462 0.04078 2.57699 1.58676 0.13005
4 N 3 3 3 3 3 3
Mean 27.3467 -0.28 0.5204 27.3467 12.075 0.4523
Median 25.04 -0.44 0.4972 25.04 12.275 0.4534
Standard deviation 6.17221 0.42332 0.1136 6.17221 1.7088 0.09434
Total N 31 31 31 31 31 31
Mean 10.2787 0.0434 0.231 10.2787 3.7645 0.3306
Median 8.68 0.06 0.22 8.68 2.8 0.3575
Standard deviation 6.96075 0.29205 0.12979 6.96075 3.58146 0.1866 Source: own calculations based on Eurostat, from SPSS output
We considered the creation of 4 clusters justified for the period between 2014 and 2018. The four clusters differ from each other significantly in the individual analysis of the variables, which we tested with variance analysis.
The first group is characterised by the lowest revenues and expenditures of the local level amongst the groups, however, every country examined in this country is in surplus. The revenue of local level in these countries within general government revenue is the lowest in these countries, the same as local tax revenues, however, taxation autonomy is the second lowest. The countries belonging to the first group: Belgium, Germany, ireland, Greece, Spain, Cyprus, Luxembourg, Hungary, Malta, Portugal, Slovenia. in comparison with the previous period, this cluster shows the characteristics of the first and fifth cluster (with France and Switzerland belonging to the third cluster owing to their better indicators), however, except for the balance of the budget, the values of the group deteriorated in terms of every other indicator.
The values of the indicators of the second cluster approach the mean, but do not reach the same. At the same time, its number means that the value of its indicators are the second lowest, however, it is true for every country within this cluster that they have a budgetary position with a surplus. The second cluster completely equals the second cluster of the period between 2009 and 2013, complemented by the Netherlands, owing to the deteriorating indicators of the latter. The value of indicators deteriorated compared to the previous period in terms of revenues and expenditures, and improved in terms of the other indicators examined.
The third group is characterised by the fact that all of its indicators take up values reaching the mean, yet the municipal subsystem of all countries within the third group produced
budgetary values in deficit in terms of the four years examined, and taxation autonomy is the highest in this group. The cluster equals the third cluster of the previous period, complemented by France and Switzerland.
Local tax revenues, the indicator signing local tax autonomy and the balance of the budget increased significantly in the group, at the same time, the revenue and expenditure indicators deteriorated.
The fourth group completely equals the result of the clustering of the previous period, as it consists of the same members. This group is characterised by the facts that the revenue, expenditure level, the municipal revenues within general state revenues and the local tax revenues are the highest here. At the same time, budget deficit is the highest in this group amongst all the groups.
As the two periods qualify as a panel, it was possible to examine the changes of the two periods with difference. to that end, we calculated the values of the differences of the indicators between the two periods.
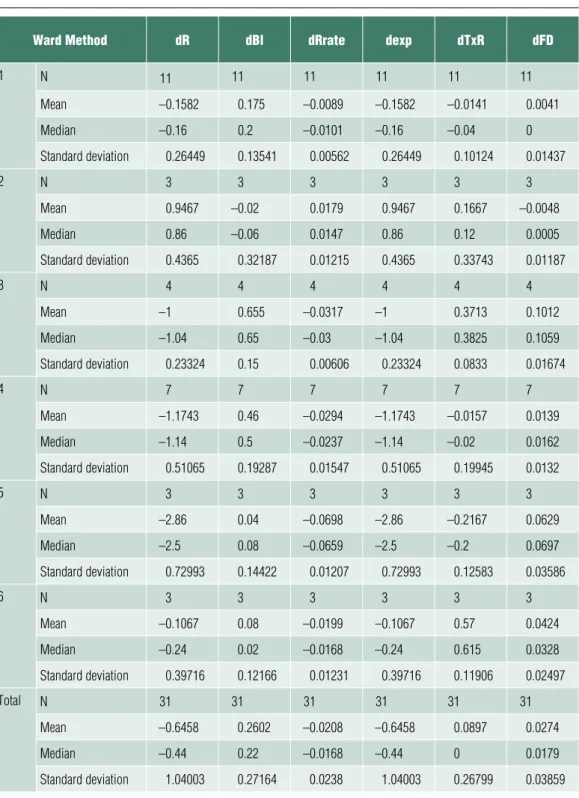
in the course of the cluster analysis, we considered the creation of 6 clusters justified, which we illustrated in Figure 3. The characteristics of the clusters are presented in Table 5.
The first group is characterised by the fact that the rate of revenues, expenditures and local revenues deteriorated in a significant part of the countries by comparing the two periods, however, they increased the balance of the budget. This group includes Belgium, Germany, estonia, Greece, Croatia, Luxembourg, Malta, Austria, Slovakia and Switzerland.
in the case of the second group, the balance of the budget and taxation autonomy declined, but they achieved a strong increase in terms of the other indicators. This group includes Bulgaria, Norway and Sweden.
The members of the third group are the
Czech Republic, Spain, Latvia and Portugal.
The revenues of municipalities, and, thus, the share of municipal revenues within public finances weakened in these countries, and so did budget expenditures as a result. in spite of these unfavourable factors, the balance of the budget of the municipal subsystem improved between the two periods, the local tax revenues also increased, and as a result, the share of local taxes within the municipal revenues grew, too.
The fourth group has quite similar characteristics as the previous group, with the difference that the improvement of the balance of the budget is of smaller extent in this group.
At the same time, local tax revenues dropped between the two periods. The study categorised
denmark, italy, Lithuania, the Netherlands, Poland, Romania and Slovenia into this group.
The fifth group is characterised by the fact that the values of the variables examined (except for the balance of the budget and the indicator measuring taxation autonomy) deteriorated significantly in all categories between the two periods. This group includes ireland, the united Kingdom and Hungary.
in the sixth group, the balance of the budget, the value volume of local tax revenues and the share of local tax revenues within municipal revenues increased, but the values of the other variables decreased. This group included France, Finland and iceland (See Table 5).
The resulT of The dendoGram for The difference variables
0 5 10 15 20 25
1
Belgium 1
Austria 20
Estonia 6
Slovakia 25
germany 5
greece 8
cyprus 13
Malta 18
luxembourg 16
croatica 11
Switzerland 31
2 Bulgaria 2
Sweden 27
Norway 30
6
Finland 26
Iceland 29
France 10
5 Ireland 7
United Kingdom 28
Hungary 17
3
latvia 14
Portugal 22
czechia 3
Spain 9
4
lithuania 15
Netherlands 19
Poland 21
Romania 23
denmark 4
Italy 12
Slovenia 24
Source: own calculations based on Eurostat, from SPSS output
{ { { {
{ {
Table 5 The disTribuTion of The main indicaTors of The clusTer analysis iii.
Ward method dr dbl drrate dexp dTxr dfd
1 N 11 11 11 11 11 11
Mean –0.1582 0.175 –0.0089 –0.1582 –0.0141 0.0041
Median –0.16 0.2 –0.0101 –0.16 –0.04 0
Standard deviation 0.26449 0.13541 0.00562 0.26449 0.10124 0.01437
2 N 3 3 3 3 3 3
Mean 0.9467 –0.02 0.0179 0.9467 0.1667 –0.0048
Median 0.86 –0.06 0.0147 0.86 0.12 0.0005
Standard deviation 0.4365 0.32187 0.01215 0.4365 0.33743 0.01187
3 N 4 4 4 4 4 4
Mean –1 0.655 –0.0317 –1 0.3713 0.1012
Median –1.04 0.65 –0.03 –1.04 0.3825 0.1059
Standard deviation 0.23324 0.15 0.00606 0.23324 0.0833 0.01674
4 N 7 7 7 7 7 7
Mean –1.1743 0.46 –0.0294 –1.1743 –0.0157 0.0139
Median –1.14 0.5 –0.0237 –1.14 –0.02 0.0162
Standard deviation 0.51065 0.19287 0.01547 0.51065 0.19945 0.0132
5 N 3 3 3 3 3 3
Mean –2.86 0.04 –0.0698 –2.86 –0.2167 0.0629
Median –2.5 0.08 –0.0659 –2.5 –0.2 0.0697
Standard deviation 0.72993 0.14422 0.01207 0.72993 0.12583 0.03586
6 N 3 3 3 3 3 3
Mean –0.1067 0.08 –0.0199 –0.1067 0.57 0.0424
Median –0.24 0.02 –0.0168 –0.24 0.615 0.0328
Standard deviation 0.39716 0.12166 0.01231 0.39716 0.11906 0.02497
Total N 31 31 31 31 31 31
Mean –0.6458 0.2602 –0.0208 –0.6458 0.0897 0.0274
Median –0.44 0.22 –0.0168 –0.44 0 0.0179
Standard deviation 1.04003 0.27164 0.0238 1.04003 0.26799 0.03859 Source: own calculations based on Eurostat, from SPSS output
The implications of the period
examined for the Hungarian municipal system
From the point of our subject, the first period (2009–2013) encompasses the period before the municipal reform as well as the transitional period, while the second period (between 2014–2018) is the interval following the entry into effect of the reform measures.
Out of the main indicators of Hungarian local governments, the revenues of the municipal sector decreased significantly, which decrease also continued after 2014. The same as the general government revenues, the revenues of the local level also dropped in the period subject to our study, mainly as a result of the decrease of central budget transfers. The balance of the budget was in deficit in the years 2009 and 2010, and had a surplus in the local government subsystem in the subsequent period. in 2018, a small scale deficit was observed in the sector. At the same time, the ratio of local tax revenues within total municipal revenues increased in the period examined, from 2011 onwards.
in the case of Hungarian local governments, bonds were issued at an increased rate from 2006, especially in the case of city, city of county status and county municipalities, as approx. 288 bonds were issued between 2006 and 2008 in said segment in the amount of HuF 286.5 billion, out of which short term bonds were issued in the amount of HuF 38.5 billion and long term bonds were issued in the amount of HuF 248 billion. As a result of the foregoing, the financial positions of local governments declined, however, the net financial assets of the sector showed an increase after 2010 – the negative values turned positive (Kovács, Csillik, 2012). in their study, Csiszárik-Kocsir (2008) and Fábián (2016) evaluated the consequences of the economic crisis also appearing in Hungary in
2008 on local governments. Csiszárik’s paper pinpointed that if the local governments had had stable tax revenues, the consequences of using external resources as a result of the crisis would have been less severe.
The debt consolidation examined on many occasions took place in the Hungarian municipal system, as a result of which the financial positions of local governments improved for the short term. A favourable change can be seen especially in the accounting-financial indicators of cities of county status, however, from9 2018, a small scale deterioration can be observed, with the rising of short term liabilities and the volume of debts. The accumulation of additional debts should be prevented by budgetary regulatory mechanisms, the success of which forms an important future research question, especially in light of the fact that the debts of the municipal subsystem take on the previous patterns once again. One of such patterns is the rise of unevenness of expenditure on capital formation with the approach of election cycles, which orbit is also followed by the increase of the long term debt volume. (Lentner, 2014)
The Hungarian local governmental system took a step from the classical public law categories and local government system models to the Mediterranean structure, but the current model does not follow the characteristics of the Southern model fully, due to the undivided nature of municipal levels and the state character of control. in addition to the quantitative analysis, the main characteristics of the Hungarian municipal system are as follows:
• state-governed development policy,
• higher degree of lawfulness control,
• centralised task performance environment,
• redivision and the firmer appearance of solidarity in the municipal system.
One of the reasons for state-governed development policy is that the capital
formation ability of the municipal subsystem is insufficient. That is, the surplus generated10 from operational revenues provides less coverage for self-funded developments, and the theoretical method of recognising amortisation does not provide capital coverage for developments11 but the uneven distribution of the governments own revenues can also be categorised here. The other reason is that the 'tender-oriented' development attitude also dominated municipal developments previously, which means that local authorities do not apply for goals corresponding to the previously announced economic programs adjusted to local needs, but for opportunities that have been announced in Hungarian invitations to tender and calls co-financed by the european union. it is true, although, that the programs announced by the local governments previously are also aligned to the opportunities appearing in calls for tender.
The role of self-financed or combined funding (own funds plus market loan) developments was insignificant, and mainly companies owned by local governments used it. The Modern Cities Program tried to break off with this tradition, where the development goals have been established with countercurrent planning, and in addition to the intentions of governmental economic policy, local needs were also considered. The Modern Village Program was established in a similar manner, which provides resources for the target areas regarded as urgent problems in small settlements (for example: road reconstruction, energy modernisation, real estate renovation).
Our opinion is that a favourable impact can be expected as a result of developments in municipal operation where such projects are implemented in which the operation will be the government’s task in the future, and where the operational budget will not be loaded by developments with substantial operational surplus costs. An example for this is road
reconstructions and the energetic renovation of property items.
The higher degree of lawfulness control is manifested in the controlling role of government offices, which was not present in the previous local government system at all or was present to a much smaller extent. in addition, the degree of control exercised by the State Audit Office of Hungary also grew12 in comparison with the previous more passive role.13 Another novelty from 2011 that the audit authorisation also includes the other segment of the dually structured municipal economy: the scope of local government owned companies.14 However, in addition to the increase of state control, the introduction (and the positive impacts) of the rule-based budgetary practice should also be mentioned (Kovács, 2017).
it is important in relation to the more centralised task performance environment that the task performance structure was transformed significantly: decentralisation was step-by-step replaced by centralisation taking place gradually in human care systems. The reduction of local government revenues is partly a result of the foregoing, as the financing structure was transformed in proportion to the cost ratios of mandatory tasks. An important argument for the centralisation of human infrastructure is that a significant part of local authorities was not able to create the funding aspects of operational conditions,15 and thus the financing of investments was not ensured either. Nevertheless Mötv (the act on Hungary’s local governments) provides opportunity for local authorities to perform the tasks assumed voluntarily, and certain local governments use this opportunity for settlement strategy purposes. The reform had an adverse effect on those settlements that had little or no own revenues. The numbers of task financing, however, which has remained unchanged since 2013, will soon need review
for the enforcement of the proper costs ratios.
in addition, the financing of certain specialised tasks should also be reviewed.
Reallocation manifests in the task financing subsidies depending on own revenues and in the introduction of solidarity contribution in 2017. The reason for this is that the local business tax is also dominant in the current system amongst sui generis revenues, which, however, has many unfavourable qualities:
first of all, it is sensitive to economic trends, and it correlates strongly with geographical development level, and, therefore, its revenue concentration is high, and concentrates at approx. 100 settlements. Accordingly, tax capacity is taken into consideration in task financing.
The Hungarian municipal system has become confined by a more regulated and more detailed control environment in the past decade. in addition, it has been trusted with less (more reasonable) public service tasks after the improvement of its load bearing capacity (state consolidation, central budgetary task and debt centralisation), but the financial safety of fulfilling such public tasks has increased, which marks a shift towards the Mediterranean model as a result of its size and duties. Yet, the Hungarian municipal public finances subsystem does not follow the characteristics of such model entirely, as it has more centralised features than the Mediterranean model.
coNclUSIoN
The first hypothesis of our study has been verified, as the balance of the budget of the municipal subsystems of the european countries examined were in deficit after the crisis, which was induced by the increasing total expenditures. Out of the countries examined, in the year of the spillover of thecrisis (2009), the budget was in deficit in every examined country, but after that, mainly after 2014, the balance of the budget turned to the positive territory. Therefore, the operation of local authorities from the four economic functions defined by Musgrave (1989) manifested in the stabilisation function through the measures taken in response to the crisis and in the strengthening of the local level allocation function. As a result, the local subsystem gained a more pronounced role in the performance of public tasks. in addition, the impacts of the crisis also manifested in the decrease of tax revenues, which is a typical symptom of a crisis, and which was not replaced properly by the budgetary transfers of the central budget. A conclusion that can be drawn from this is that local authorities also have a larger role in crisis management measures and budget stabilisation during a crisis, which appears in budgetary variables.
The second hypothesis has also been proved because a different crisis management strategy was implemented based on both the local government groups in a public law sense and territorial division, in relation to which we identified two groups.in the countries of the Mediterranean model, the balance of the budget was positive from 2012 on, through the increase of the amounts of tax revenues and the increase of the share of local taxes, too. These countries, therefore, reacted to the challenges of the crisis with the reduction of costs and the increase of local tax revenues.
in the Scandinavian countries, the strategy was expenditure-oriented, as the budget of the local level was in deficit every year: the reason for this was the bigger role in the performance of public tasks. The tax revenues also increased in these countries, but the share of tax revenues within total revenues was constant. They based their defence against the negative impacts of
the crisis on the increase of central budget transfers, and they also kept this mechanism after the crisis.
The budgets of in-between countries, that is the countries belonging to the Rhine model were only in deficit for two years – from 2011, the balance of the budget of local subsystems was continuously positive, and this also included provincial levels.
The long term impacts of the crisis was mainly permanent for Scandinavian countries based on the data, as the structures introduced as a result of the crisis remained in the field of financing even in the years following the crisis. The municipal subsystems of post- Soviet and Mediterranean countries typically followed an adaptive strategy, therefore, they tried to follow the practice built on budgetary discipline becoming more and more dominant in eu policy and national levels. The local governments belonging to the Rhine model proved to be the most crisis-resistant, as they recovered and realised budgetary stabilisation quickly and effectively, and they were also able to maintain it in the years following the crisis.
Based on the examination of public law groups it can be concluded from the analysis of the data that the crisis did not induce a significant transformation in the municipal system models, as the financing and resource allocation system stabilised after the crisis in a manner adjusting to the system characteristics of the public law systems. it can be concluded, however, that the system built after the management of the crisis determined the financial management of municipal subsystems for a long period of time, which proves that the budgetary regulatory mechanisms are able to form the situation of local governments and thus the formation of their budgetary characters in the long term.
We must mention, however, that the categorisation based on public law and territorial aspects cannot be proven with the
performed multi-variable statistical methods, the groups did not follow either the public law or the regional categorisation (under which we understood geopolitical and geo-economic positioning).
if we look at the question in a regional dimension it can be established that two groups of similar characteristics can be identified. if we look at the two regions in the eu that have suffered the adverse effects of the crisis the most, the countries of Mediterranean and post-Soviet regions, it can be established that they followed a quite similar crisis management strategy. The deficit was typical in both groups until 2013, however, while in the Mediterranean countries, the revenues and tax revenues of the local level increased, the reduction of these values is the tendency that can be observed in the post-Soviet countries.
Stability can be observed in the Western- european countries, the same as in the case of the countries belonging to the Rhine model.
Our third hypothesis was also verified, since the cluster analysis justified that the characteristics of the classical municipal system models under public law (Scandinavian, Mediterranean, Rhine) remained true only for a part of the Scandinavian countries through the economic indicators examined in the study. However, based on the variables examined, at least four municipal groups exist that can be described with distinct characteristics. it can be concluded from the examination of background variables that the total revenue and expenditure have the most influence on municipal categories, which are followed by the revenues of the local level within the total general government revenue.Accordingly, four local government groups can be typed, which can be concluded from the two cluster analyses, mainly relying on the second clustering (based on data between 2014–2018):
• the first group is the less significant local government level (Greece, Luxembourg, Hungary,16 Spain, Portugal, Germany, Slovenia, Belgium, ireland, Cyprus, Malta),
• the second group is the medium local government subsystem (Bulgaria, the united Kingdom, the Netherlands, Austria, Slovakia, estonia, Lithuania, Romania),
• the third is the strong local government subsystem (Croatia, Poland, italy, Norway,
Latvia, Switzerland, France, the Czech Republic),
• the fourth is the dominant local government subsystem typical of Scandinavian countries (Finland, Sweden, denmark).
A new finding of the study is the categorisation of local government subsystems based on fiscal indicators, as the determination of this is mainly based on economic aspects instead of territorial (regional) and public law factors.
1 The Federal model is a transition between the Scandinavian and the Mediterranean municipal models, since territorial division is dominant in it, but the depth of the duties and competences of local governments differ. A typical example of the Federal (Rhein) model is Austria, Germany, Belgium and pre-municipal reform Hungary.
2 in the countries of the Scandinavian model, the significant concentration of local authorities took place, and, as a result, the population size per local government is the highest in these countries. typical examples include Sweden, Finland, denmark and Norway. Although not very clearly, but a part of the characteristics is also shown in the case of the united Kingdom and the Netherlands.
3 typical representatives of the southern model are Spain, Portugal, France, italy and Greece. The number of citizens per local authority is the lowest in this category (Vigvári, 2011).
4 The impacts of the crisis on Hungarian local governments was examined by Sági (2015) in addition to Csiszárik and Kocsir (2008).
5 in his paper, László Vértesy states that the municipal debt arising from improper financial management of approximately euR 850 million (data from 2018) gives 6.7% of the public debt of eu-28 (Vértesy, 2019). The standardization of municipal crisis management measures is also worth our attention in said paper.
6 The 2013 outlier in the country’s examination has been excluded from the test, as the local authorities got rid of a significant amount of debt through the debt consolidation of the budget.
7 Kotia A., duarte Ledó V. (2016). do Subnational Fiscal Rules Foster Fiscal discipline? New empirical evidence from europe. iMF Working paper 16/84., p. 37
8 Act XV of 1997 on the european Charter of Local Self-Governments.
9 Based on the studies of Lentner (2014) and Mol- nár, Hegedűs (2018).
10 Operational revenue minus operational expenditures. See Bethlendi, Lentner (2019) and Zéman (2017).
Notes