THE CYTOTOXICITY OF CHEMOTHERAPEUTIC AGENTS TO HEMATOPOIETIC PROGENITOR CELLS COMMITTED TO MYELOID,
ERYTHROID AND MEGAKARYOCYTOID DIFFERENTIATION
ALEXANDER NAKEFF FREDERICK A. VALERIOTE Section of Cancer Biology Mallinckrodt Institute of Radiology Washington University School of Medicine
St. Louis, Missouri
I. INTRODUCTION
A major consideration in optimizing the use of various chemo- therapeutic agents is to minimize their effects on the hemato- poietic system since the efficacy of the agents is often limited by their cytotoxicity to normal blood cell progenitors.
Investigators have employed morphological as well as function- al criteria from simple changes in cellularity to extent of des- truction of the pluripotential hematopoietic stem cells (Bruce and Valeriote, 1968).
With regard to experimental techniques for assaying those hematopoietic cell progenitors already committed to differentia-
433
tion, sophisticated approaches have been attempted including the use of 59Fe incorporation, both following a standard dose of ery- thropoietin in hypertransfused recipients to measure erythropoie- tin-responsive cells (ERC) (Gurney et al., 1962) and following marrow transplantion into supralethally-irradiated recipients to measure erythroid repopulating ability (ERA) (Blackett et al.,
1964; Hellman et al,, 1969), and the measurement of granulocyte repopulating ability (GRA) based on an endotoxin cell-mobiliza- tion technique for assessing granulocyte production (Hellman et al., 1969). While Hellman et al. (1969) initially noted little difference in the effect of radiation on these functional assays, the response to chemotherapeutic agents revealed differences be- tween the different cell populations (Lamerton and Blackett, 1974). Later studies by Hellman and Grate (1971) have demonstrat- ed a consistant difference between these two populations with the erythrocytic series having been found to be more sensitive than the granulocytic series not only to cyclophosphamide and nitrogen mustard, but also to radiation. This difference is not confined only to the inherent difference between two distinct cell popula- tions, but has been extended to individual compartments within the erythrocytic series which have been assessed by different functional assays and shown to respond differently to various drugs (Millar and Blackett, 1974). Presumably, this reflects mostly the different proliferative states at the time of drug ex- posure for that portion of the erythroid progenitor population be- ing assayed.
The usefulness of these functional assay systems is limited by several factors including the fact that they are indirect as-
says which are interpreted as reflecting events occurring in specific progenitor compartments and, perhaps most importantly, are assays which cannot be applied to studies of human bone mar- row. The in vitro growth of hematopoietic cell colonies with ex- pression of differentiation as well as proliferation characteris- tics provides a more direct approach to the assay of hematopoie-
tic progenitor cells. Using a methyl cellulose culture technique for the progenitor to the myeloid line, the colony-^forming unit, culture CCFU-C), Brown and Carbone Cl971) have carried out the most comprehensive study of the effect of anti-cancer agents on human marrow CFU-C and while the agents act in agreement with the classification of Bruce and Valeriote C1968), the absolute sensi- tivities do differ. Studies comparing the drug response of CFU-S and CFU-C in agar culture of mouse marrow have also been carried out CChen and Schooley, 1970).
Techniques have been developed more recently for culturing colonies of erythroid and megakaryocytoid cells. The first suc- cessful growth of colonies of erythroid cells was reported by Stephenson et al. C1971) using mouse marrow in plasma cultures, followed by reports of Gregory et al. C1973) then Iscove et al.
C1974) and Cooper et al. C1974) using both mouse and human marrow in methyl cellulose cultures. McLeod et al. C1975) have most re- cently developed an in vitro erythropoietic cell colony assay in plasma cultures of mouse marrow for a class of erythropoietin- dependent cell progenitor committed to erythropoiesis CCFU-E).
The growth of megakaryocyte colonies has been reported in agar cultures of mouse marrow CNakeff et al., 1975; Metealf et al., 1975) and a plasma culture system has been described for a class of progenitor in mouse marrow committed to the megakaryocytic cell line CCFU-M) CNakeff and Daniels-McQueen, 1976). These as-
says for CFU-M, CFU-E, CFU-C and CFU-S make it possible to study the effect of chemotherapeutic agents on both pluripotent and committed progenitor cell populations. However, since both cul- ture technique and culture conditions have been shown to affect the growth and differentiation of cell colonies from hematopoietic tissue tin Vitro Culture of Hemopoietic Cells, 1971), it was im- perative to standardize these factors for the three committed
cell progenitors. In our experience, the plasma culture technique seemed most ideal since it was the only technique that permitted not only the growth of colonies from each progenitor but also.
more importantly, allowed for their identification in situ using specific cytor- and histochemical properties.
This report will describe the microtiter plasma culture system as modified from that described by McLeod et al. (1975) which we have used successfully to assay for colony-forming units specific for erythropoiesis (CFU-E), granulopoiesis (CFU-C) and megakaryo- cytopoiesis (CFU-M) under almost identical culture conditions from the same pool of bone marrow. In addition, some preliminary data will be presented on the time-response of these committed cell progenitors, as well as the CFU-S, to cyclophosphamide.
II. MATERIALS AND METHODS
A. Mice
Twenty week-old B 6 D 2 F 1 (C57B1/6 x DBA/2) female mice from Jackson Laboratories were used throughout this study.
B. Collection and Preparation of Bone Marrow
A mono-dispersed cell suspension of bone marrow was obtained from mice by flushing each femur with 1 ml of cold modified Eagle's medium (HMEM) (McLeod et al., 1975) supplemented with 2%
heat-inactivated fetal calf serum (FCS) (Gibco) and passing the resulting suspension once through a 25G needle.
After determining the total nucleated cell count of the pooled marrow sample by electronic particle counting (Celloscope, Par- ticle Data) in cetrimide, cells were concentrated by centrifuga- tion (350 x g for 10 min at 4°C) then resuspended in an appropri- ate volume of HMEM for addition to the cultures.
C. Plasma Culture of CFU-E, C and M
The basic microtiter plasma culture technique was used as described by McLeod et al. (1975) for assay of CFU-E and CFU-C
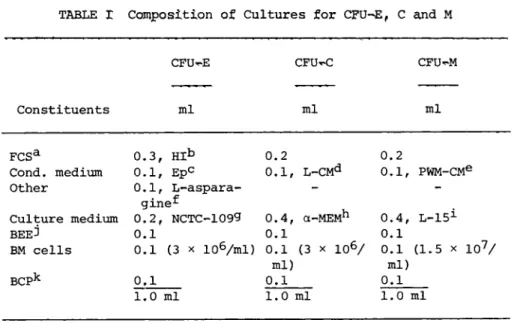
TABLE Γ exposition of Cultures for CFU-E, C and M
CFU-E CFU-C CFU-M
Constituents ml ml ml
FCSa 0.3, H Ib 0.2 0.2
Cond. medium 0.1, E pc 0.1, L-CMd 0.1, PWM-CMe Other 0.1, L-aspara-
- -
ginef
L-151 Culture medium 0.2, NCTC-1099 0.4, a-MEMh 0.4, L-151
BEE ^ 0.1 0.1 0.1
BM cells 0.1 (3 x 10⁶/ml) 0.1 ml)
(3 x 1 06/ 0.1 ml)
(1.5 x 1 07/
BCPk 0.1 0.1 0.1
1.0 ml 1.0 ml 1.0 ml
aFetal calf serum (Gibco).
bHeat-inactivated C56°C for 45 min).
erythropoietin Step III from Connaught Laboratories, Toronto (3004-6) at 2.5 U/ml.
^Conditioned medium (CM) from mouse L-cells.
eC M from mouse spleen cells cultured at 1 x 1 06 cells/ml in a- MEM with 10% FCS for 4 days in the presence of a 1:320 final dilu- tion of pokeweed mitogen (PWM) (Gibco).
Schwarz-Mann at 0.2 mg/ml.
^Microbiological Assoc., Bethesda
^Flow lab., Bethesda
^Gibco, Buffalo.
JBovine embryo extract (1:4 in medium) (Gibco).
kBovine citrated plasma (Gibco)
and Nakeff and Daniels-McQueen (1976) for CFU-M. The parti- cular culture conditions for CFU-E, C and M are presented in Table I. In brief, 0.1 ml of bone marrow (BM) cells at the ap- propriate cell concentration was added to 0.8 ml of the culture constituents (Table I) excluding the bovine citrated plasma (BCP).
Finally, 0.1 ml of BCP was added, the culture mixed thoroughly to insure a mono-dispersed cell suspension and aliquots of 0.1 ml placed in wells of sterile, polyvinyl microtiter plates (Cooke Engineering, Alexandria, Va.) and permitted to clot at room tern-
perature (10 mini, Plates were then placed inside a 100 mm cul- ture dish (Falcon! with a water reservoir to maintain humidity and incubated at 37°C at 100% humidity. Cultures for CFU-E were incubated at 5% C 02 in air which was found to be optimal for their growth whereas cultures for CFU-C and CFU-M were incubated in 7.5%
CC>2 in air.
D. Identification of CFU-E, C and M
After various times in culture, clots were removed after rim- ming and groups of 3 transferred to a 25mm * 75mm microscope slide. The clots were covered with filter paper soaked in 0.1 M sodium phosphate, pressed tightly to the slide and fixed with 5%
glutaraldehyde (Electron Microscopy Sciences, Fort Washington, Pennsylvania) for 10 min.
1. CFU-E
Plasma cultures were stained for hemoglobin as described by McLeod et al. (1975). Briefly, after 2 min incubation in 1% ben- zidine, slides were placed in 2.5% hydrogen peroxide (in 70%
ethanol) for 1 min, rinsed in distilled water for 1 min then counterstained in Harris' hematoxylin (Fisher) for 1 to 2 min.
After "blueing" in running tap water for 2 to 3 min, slides were air-dried and mounted in Eukitt for microscopic examination at 400X. Colonies of more than eight benzidine-positive cells were scored as erythroid (CFU-E) and the total number counted in each culture.
2. CFU-C
Cultures were stained for 3 min in Harris1 hematoxylin,
"blued" for 2 to 3 min in running tap water, dried and mounted with Eukitt for microscopic examination at 200X. Colonies of greater than 50 granulocytic cells were scored as CFU-C. Occa- sional macrophage colonies of greater than 50 cells were also counted.
3, CFU^M
The "direct-coloring" thiocholine method of Karnovsky and Roots (1964) was used to stain for acetylcholinesterase activity following a 3 hour incubation at room temperature in a solution consisting of
10 mg acetylthiocholine iodide (Sigma, St. Louis) 15 ml 0.1 M sodium phosphate
2 ml 30 mAf copper sulfate 1 ml 0.1 M sodium citrate
2 ml 5 mM potassium ferricyanide
Following a 1 min rinse in 0.1 M sodium phosphate and postfixa- tion in absolute methanol for 10 min and 50% methanol for 30 sec, slides were counterstained in Harris1 hematoxylin for 3 min,
"blued" for 2 to 3 min in running tap water then dried and mounted in Eukitt. CFU-M were scored as colonies of more than 4 acetyl- cholinesterase-positive cells at a magnification of 400X.
E. CFU-S Assay
The spleen colony assay of Till and McCulloch (1961) was used to measure pluripotent stem cells. An appropriate fraction of the pooled marrow cell suspension was injected via the tail vein into groups of 10 syngeneic recipients receiving a total dose of 1000 rads of ^^cesium gamma rays. The dose was delivered in two 500 rad exposures administered three hours apart as described by Hellman and Grate (1971). Nine days later, the mice were killed, their spleens harvested, placed in Bouin's solution and the num- ber of macroscopic spleen colonies counted. The number of CFU-S determined in this manner was expressed per femur without the con- sideration of an "f" factor.
III. RESULTS
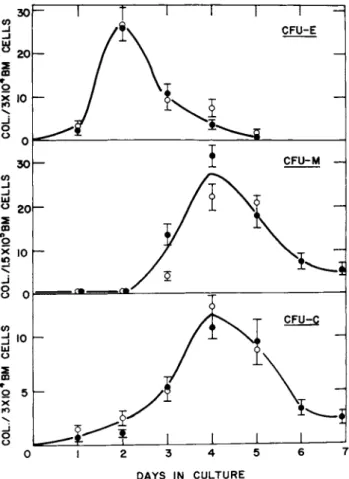
A, Appearance of CFU-E, C and M as a Function of Time in Culture In order to determine the optimal time of assay for CFU-E, C and M, plasma cultures of normal marrow were cultured at cell con- centrations of 3 x 1 04 per 0.1 ml culture for CFU-E and C and 1.5 x 1 05 per 0.1 ml for CFU-M. After various periods of incuba- tion, cultures were harvested and stained as described above and the number of CFU-E, C and M determined in each culture.
As shown in Fig. 1, the maximum number of CFU-E was obtained after 2 days in culture with most of the colonies having disap- peared by the fifth day. With regard to the CFU-M, no colonies were observed over the first two days in culture. Colonies were observed, however, by day 3 with a peak incidence on day 4 and an almost complete disappearance by day 7. CFU-C appeared in cul- ture with a peak incidence on day 4 and, as with the CFU-M, al- most completely disappeared by day 7. On the basis of this data, CFU-E were routinely assayed after 2 days in culture with CFU-C and CFU-M being assayed after 4 days in culture.
B. Effect of Cyclophosphamide on CFU-S, E, C and M
Mice were injected intraperitoneally with a single dose of 2 mg of cyclophosphamide and at various times thereafter groups of four mice were killed and their marrow pooled and assayed for CFU-S, Å, M and C.
As can be seen in Fig, 2, the number of CFU-S per femur de- creased by about 30% by 2 hours after drug injection. There was a further decrease of about 30% over the next 22 hours which we attribute mostly to the loss of the initial surviving fraction of CFU-S through increased differentiation. Cellular recovery after this point was rapid and essentially complete by 4 days.
With regard to the number of CFU-E, there was a rapid and sub- stantial loss of CFU-E by 2 hours at which point we were unable to
D A Y S IN C U L T U R E
FIGURE 1 The number of CFU-E, C and M per 0.1 ml plasma cul- ture of normal mouse bone marrow as a function of the number of days in culture. Each set of symbols represents a separate ex- periment and each point is the average of nine cultures. Errors shown represent ± 1 SE.
culture any erythroid colonies at the cell concentration plated.
This was true also at 24 hours. By 2 days, however, recovery was observed with a rapid return to pretreatment levels by day 4.
The initial decrease in CFU-C was also rapid, reaching levels of about 5% of control by 2 hours. Cell recovery commenced thereafter so that by day 4 CFU-C colonies were confluent with
the number of CFU-C probably being above the initial starting
DAYS A F T E R 2 MG CYCLOPHOSPHAMIDE
FIGURE 2 The number of CFU-Sr Er C and M per femur in mice as a function of time following a single intraperitoneal injec- tion of 2 mg of cyclophosphamide. Each set of symbols represents a separate experiment and each point for CFU-E, C and M is the average of six cultures. Points with arrows down denote zero colony formation and those with arrows up denote confluent colonies. Errors shown represent ± 1 SE.
values. There was a subsequent decrease in C F u - C per femur ob- served on day 7.
The decrease in the number of CFU-M per femur was more gradual with the largest decrease to about 10% of the pretreatment value being observed at 24 hours. Recovery after this time was extreme- ly rapid with confluent colonies on day 2 being indicative of val- ues above pretreatment.
IV, DISCUSSION
In vitro cell clonal assays have been described using the microtiter plasma culture technique for measuring hematopoietic progenitor populations committed to erythrocytic, granulocytic and megakaryocytic differentiation. In addition, preliminary data is presented of early changes induced in these populations, as well as in CFU-S, as a function of time following a single dose of cyclophosphamide.
In our experience, the microtiter plasma culture system of- fers several advantages for studying clonal ancestors of differ- entiated hematopoietic cells. This one system provides a stan- dardized method of culture that permits not only the full expres- sion of the potentials for proliferation and differentiation of the clonal progenitors of the three major blood cell lines but al- so the use of specific cyto- and histochemical assays with which to identify and thus quantitate in situ the total number of col- onies derived from each differentiated progenitor. In addition, the relatively small size of the cultures permits the economic use of ingredients such as conditioned media which, in some in- stances, may be difficult (or expensive) to obtain and store un- der conditions ideal for maintaining their potency. Most im- portantly, perhaps, is the potential application of this culture system to the use and study of human marrow which has been demon- strated for human CFU-E by Prchal et al. (1974).
The time of appearance of CFUTE, C and M and their plating ef- ficiences at optimal culture times correspond with those presented by McLeod et al. 0-975) and Nakeff and Daniels«-McQueen (1976) for both CFU-E and C and CFU-M, respectively.
Although the data on the effects of cyclophosphamide on CFU-S, E , C and M is preliminary, the procedures applied have demonstrat- ed the utility of using the described cell clonal assays for ex- perimentally determining hematopoietic cytotoxicities to both pluripotent stem cells and committed clonal cell progenitors.
The initial decrease of 30% in the number of CFU-S per femur 2 hours after the injection of 2 mg of cyclophosphamide is in agreement with previous data (Bruce and Valeriote, 1968) and re- flects mostly the direct cell killing by the drug. The subse- quent decrease observed over the next 22 hours we attribute most- ly to the loss of surviving CFU-S from the pluripotent stem cell compartment through increased differentiation in order to repopu- late more mature cell compartments (e.g. CFU-E and C) which are depleted more completely as a result of their greater sensitivity to cyclophosphamide. The rapid recovery in CFU-S observed after this time probably reflects the relatively large surviving frac- tion of CFU-S present two hours after the administration of cyclo- phosphamide and the increased production of new CFU-S following the subsequent recruitment of the surviving fraction of CFU-S into cell cycle.
Cyclophosphamide showed a differential cell killing of CFU-E, C and M. CFU-E were the most sensitive showing the largest de- crease at two hours and a somewhat delayed recovery, although once recovery was underway by day 2, the return to pretreatment values was rapid. This decrease was even more profound considering that the marrow cellularity was relatively unchanged by two hours after cyclophosphamide with the largest decrease to about 25% of normal observed on day 1 with a return to normal cellularity by day 2.
In subsequent studies, we were still unable to detect CFU-E at two hours after 2 mg of cyclophosphamide even when more than three
times as many cells were plated. The differential effects we ob- served for CPU-Å and C are supported by the studies of Hellman and Grate C19711 and Lamerton and Blackett (1974Î who have shown using functional assays that the process of erythropoiesis is generally more sensitive than granulopoiesis to a number of chemo- therapeutic agents, including cyclophosphamide. This difference may result from a biochemically-inherent greater sensitivity of CFU-E to cyclophosphamide or a difference in proliferative rate which has been shown to modify cyclophosphamide sensitivity (van Putten and Lelieveld, 1970). Both Axelrad et al. (1973) and Iscove and Sieber (1975) have described clonal assays for an ery- thropoietic progenitor that is more primitive than the CFU-E and referred to as the burst-forming unit (BFU-E). Although the lack of linearity between the number of BFU-E formed and the number of cells plated in the plasma culture system (Axelrad et al., 1973) may prevent its use at this time as a quantitative assay for "ery- throid-committed" progenitor cells, it should be noted that the CFU-E which we assay here are not the most primitive of the com- mitted progenitors in the erythropoietic line.
The position occupied by the CFU-M in the megakaryocytic path- way of differentiation and its precise relationship to the CFU-S is being elucidated at this time (Nakeff, in press). It is known that megakaryocytes in agar colonies of mouse marrow are polyploid
(Metcalf et al., 1975) so that colonies must arise by a complex series of both endomitoses to increase ploidy and mitoses to in- crease the number of daughter megakaryocytes from a single pro- genitor cell. The extent to which the interplay of these proces- ses reflects the observed response of the CFU-M to cyclophospha- mide is certainly not clear from the data presented; however, it
seems that this population of progenitors is not as sensitive to killing by cyclophosphamide as either CFU-E or CFU-C and that cellular recovery, once commenced, is rapid.
We have shown that the response of CFU-S, E, C, and M to a single dose of 2 mg of cyclophosphamide is unique to each cell
line. The degree of cell loss and the subsequent pattern of re- covery within each class of progenitor probably reflects a com- plex interrelationship among several factors including, the pro- liferative state of the progenitor cells, the demands for differ- entiation placed upon them and their inherent cell sensitivity to cyclophosphamide, the size of the progenitor cell pools and their reserve capacity, and, ultimately, the relationship of each of the
"committed" progenitors to the pluripotential stem cell. Although the data presented is insufficient to answer these questions ade- quately at this time, we are accumulating more data on dose- and time-response relationships for each cell system to a variety of agents in order to better classify anticancer agents in terms of their relative toxicities to the various progenitors as well as to use these same agents to better understand the complex interrela- tionships among these four important hematopoietic cell progeni- tors.
ACKNOWLEDGMENTS
We wish to thank Ms. Marianne Schmidt for her excellent tech- nical assistance. This investigation was supported by grant number 5P01CA13053-05, and awarded by the National Cancer Institute, DHEW.
REFERENCES
Axelrad, Á. Á., McLeod, D. L., Shreeve, M. M. and Heath, D. S.
(1974). In "Hemopoiesis in Culture" (W. A. Robinson, ed.) pp.
226-237. U.S. Government Printing Office, Washington.
Blackett, Ν, Ì., Roylance, P. J. and Adams, K. (1964). Brit. J.
Haemat. 10, 453-467.
Brown, C. Ç, III and Carbone, P. P. (1971). Cancer Res. 31, 185- 190.
Bruce, W, R. and Valeriote, F, A. 0-9681. Ifc «The Proliferation and Spread of Neoplastic Cells" pp. 409ô*422. Williams and Wil- kins, Philadelphia.
Chen, M. G. and Schooley, Jt C. 0-970). J. cell. Physiol. 75, 89- 96.
Cooper, C, C , Levy, J., Cantor, L. Ν., Marks, P, A. and Rifkind, R. A. 0-974), Proc. Nat. Acad. Sei. 71, 1677-1680.
Gregory, C. J., McCulloch, E. A. and Till, J. E. (1973). j. cell.
Physiol. 81, 411-420.
Gurney, C. W., Lajtha, L. G. and Oliver, R, (1962). Brit. J.
Haemat. 8, 461-466.
Hellman, S., Grate, Ç, E. and Chaffey, J. T. (1969). Blood 34, 141-156.
Hellman, S. and Grate, Ç. E. (1971). Blood 38, 174-183.
In Vitro Culture of Hemopoietic Cells (1971). (D.W. van Bekkum and K. A. Dicke, eds), Radiobiological Institute TNO, The Netherlands.
Iscove, Ν. N., Sieber, F. and Winterhalter, Ê. Ç. (1974). J. cell.
Physiol. 83, 309-320.
Iscove, Ν. N. and Sieber, F. (1975). Exp. Hemat. 3, 32-43.
Karnovsky, M. J. and Roots, L. (1964). J. Histochem. Cytochem. 12, 219-221.
Lamerton, L. F. and Blackett, Ν. M. (1974). In "Control of Pro- liferation in Animals Cells" (B. Clarkson and R. Baserga, eds), pp. 973-984. Cold Spring Harbour Symp.
McLeod, D. L., Shreeve, M. M. and Axelrad, A. A. (1974). Blood 44, 517-534.
Metcalf, D., MacDonald, H. R., Odartchenko, N. and Sordat, B.
(1975). Proc. Nat. Acad. Sei. 72, 1744-1748.
Millar, J. L. and Blackett, Ν. M. (1974). Brit. J. Haemat. 26, 535-541.
Nakeff, A. Dicke, Ê. A. and Noord, M. J. van (1975). Ser. Haemat.
8, 4-21.
Nakeff, A. and Daniels-McQueen, S., (1976). Proc. Soc. Exp.
ßiol. Med, 151, 587-590.
Nakeff, A. (In press). In "Experimental Hematology Today" (S. J.
Baum, ed), Springer-Verlag, New York.
Prchal, F. J., Axelrad, A. A. and Crookston, J, H, C1974), Blood 44, 912.
Stephenson, J. R., Axelrad, Á.*Á., McLeod, D. L. and Shreeve, M.
M. C1971). Proc. Nat. Acad. Sei. 68, 1542-1546.
Till, J. Å. and McCulloch, Å. Á. 0-961). Radiât. Res. 14, 213-222.
Van Putten, L. M. and Lelieveld, P. 0-971). Europ. J. Cancer 7, 11-16.