C
ORVINUSU
NIVERSITY OFB
UDAPESTD
EPARTMENT OFM
ATHEMATICALE
CONOMICS ANDE
CONOMICA
NALYSIS Fövám tér 8., 1093 Budapest, Hungary Phone: (+36-1) 482-5541, 482-5155 Fax: (+36-1) 482-5029 Email of corresponding author: zsolt.darvas@uni-corvinus.huWebsite: http://web.uni-corvinus.hu/matkg
W ORKING P APER
2010 / 6
T HE T HREAT OF “C URRENCY W ARS ”:
A E UROPEAN P ERSPECTIVE
Zsolt Darvas & Jean Pisani-Ferry
15 December 2010
This paper was prepared as a briefing paper for the European Parliament Economic and Monetary Affairs Committee’s Monetary Dialogue, entitled “The threat of ‘currency wars’: global imbalances and their effect on currencies,” held on 30 November 2010. Copyright remains with the European Parliament at all times.
The threat of 'currency wars': A European perspective
Zsolt Darvas and Jean Pisani-Ferry 15 December 2010
Abstract
The ‘currency war’, as it has become known, has three aspects: 1) the inflexible pegs of undervalued currencies; 2) recent attempts by floating exchange-rate countries to resist currency appreciation; 3) quantitative easing. Europe should primarily be concerned about the first issue, which relates to the renewed debate about the international monetary system. The attempts of floating exchange-rate countries to resist currency appreciation are generally justified while China retains a peg. Quantitative easing cannot be deemed a ‘beggar-thy-neighbour’ policy as long as the Fed’s policy is geared towards price stability. Current US inflationary expectations are at historically low levels. Central banks should come to an agreement about the definition of price stability at a time of deflationary pressures. The euro’s exchange rate has not been greatly impacted by the recent currency war; the euro continues to be overvalued, but less than before.
JEL: E52; E58; F31; F33
Keywords: currency war; quantitative easing; currency intervention; international monetary system
This paper was prepared as a briefing paper for the European Parliament Economic and Monetary Affairs Committee’s Monetary Dialogue, entitled ‘The threat of ‘currency wars’:
global imbalances and their effect on currencies,’ held on 30 November 2010. Copyright remains with the European Parliament at all times. Christophe Gouardo and Lucia Granelli provided excellent research assistance. Bruegel gratefully acknowledges the support of the German Marshall Fund of the United States to research underpinning this publication.
Zsolt Darvas (zsolt.darvas@bruegel.org) is a Research Fellow at Bruegel, a Research Fellow at the Institute of Economics of the Hungarian Academy of Sciences, and Associate Professor at the Corvinus University of Budapest.
Jean Pisani-Ferry (jpf@bruegel.org) is Director of Bruegel and Professor at Université Paris-Dauphine
Table of contents
1. Background 3
2. Currency wars: how significant? 3
2.1. The issue 3
2.2. Policy measures impacting currency movements 4
2.3. Exchange rate developments 6
2.3.1. Medium-term movements 7
2.3.2. Advanced versus emerging countries 10
2.3.3. A look at the euro 11
3. Motives for policy measures impacting currency movements 13
3.1. The output shock 13
3.2. Private deleveraging 16
3.3. The quantitative easing debate 17
4. Conclusions and implications for the euro area 20
References 22
1. BACKGROUND
While emerging countries recover reasonably quickly from the crisis, the recovery in advanced countries has been unspectacular, and unemployment has risen significantly, especially in the United States and the crisis-affected European countries. The US, the country with largest current-account deficit, continues to stimulate its economy using monetary tools, weakening the US dollar and all currencies that are tied to the US dollar.
As a by-product of US monetary policy, capital flows to emerging countries with open capital accounts have accelerated, pushing up their currencies. This is thought to threaten economic recovery in emerging economies and has resulted in various actions to limit appreciation. Japan and Switzerland have also intervened in the foreign-exchange market, while the UK’s quantitative easing has a downward pressure on sterling. But not all currencies can be weak at the same time.
In this context, this paper aims to:
• Clarify the currency war(s) debate and to assess its significance;
• Discuss the motives behind national policy responses;
• Assess the implications for the euro area.
2. CURRENCY WARS: HOW SIGNIFICANT?
2.1. The issue
In October 2010, Brazil's finance minister Guido Mantega captured the spirit of the time when he spoke of currency war. The expression is reminiscent of the 1930s, when the major currencies relinquished the Gold Standard in an uncoordinated way. Then, it took two years after the crash, from October 1929 to September 1931, for Britain to sever sterling’s link to gold and set in motion a currency war. One country after another detached itself from gold, in effect trying to export its unemployment. But it became evident that not everybody can have a weak currency at the same time. A major lesson from the 1930s is that one of the roles of the multilateral system is to prevent futile beggar-thy-neighbour depreciation.
Two years have passed since the high point of the financial crisis in September 2008. It would seem the same chain of events is being set in motion, with the same time lag. This reading is however too simplistic. As Avent (2010) has observed, the current situation is not one of ‘war’ between countries. Rather, countries face different challenges and policies carried out to achieve domestic economic goals differ. This in turn directly or indirectly impacts other countries through exchange rate developments. But exchange rate movements can be, and in some important respects are, part of an appropriate response to the asymmetric character of the current challenges.
Indeed, whereas the Great Recession of 2008-09 was mostly a common shock affecting all major countries simultaneously, its aftermath has been highly asymmetric. Major asymmetries are seen between advanced and emerging/developing economies.
Advanced countries are still struggling with the fallout from the financial crisis, but emerging and developing economies are again thriving. However, neither the advanced nor the emerging country groups are homogenous. For example, in the US damage to the supply-side seems to be limited, but private demand continues to be dented by the extent of household leverage. In Europe pessimism about the supply-side prevails, while private demand has on average been hit to a lesser degree than in the US.
The existence of asymmetries does not rule out the possibility of beggar-thy-neighbour competitive depreciations in the context of weak global demand. But it does imply that divergences in policy approaches and the corresponding exchange-rate movements cannot by themselves be taken as signs of non-cooperative behaviour. We will continue
to speak of ‘currency war’, because this is the commonly used expression in this debate, but we want to point out from the outset that the expression can be misleading.
2.2. Policy measures impacting currency movements
When discussing the 'currency war', it is important to distinguish three main issues:
• The decade-long dispute over the management of currencies pegged to the US dollar, first and foremost the Chinese renminbi, but also the currencies of other exporters of manufactured goods and oil producers;
• Recent attempts by a number of floating exchange-rate countries to depreciate their currencies or at least to resist appreciation;
• Unconventional monetary policy measures, such as the announcement by the US Federal Reserve of a new programme of asset purchases (known as QE2 – quantitative easing 2) which may impact on the exchange rate of the US dollar vis-à-vis all floating currencies, including the euro and other European currencies.
The first of these issues, the US-China exchange rate debate, dates back at least to the middle of the last decade. The issue is if China’s exchange-rate policy amounts to a subsidy for its export sector. China has maintained a peg to the US dollar, except for a period from 2005 to 2008 when China allowed its currency to rise 17 percent against the dollar, but this nominal appreciation seems very limited against the background of rapid economic catching-up. China has accumulated and continues to accumulate huge foreign-exchange reserves. These developments suggest that the Chinese real exchange rate is indeed undervalued. We will not expand on the issue here because it has been extensively studied elsewhere, but it should be noted that China’s exchange-rate policy is relevant for the broader currency war debate in three important respects. First, China is a significant player in the world economy and its policy strongly affects the pace and magnitude of the required global rebalancing that the IMF (2010b) has called for.
Second, China’s exchange-rate policy has major implications for the policies of other emerging and developing countries; as long as the renminbi does not appreciate, other countries do not want their currencies to appreciate either. Third, the bilateral China-US relationship is particularly sensitive and there is a risk that the tense discussion over exchange rates at some point spills over into the trade field.
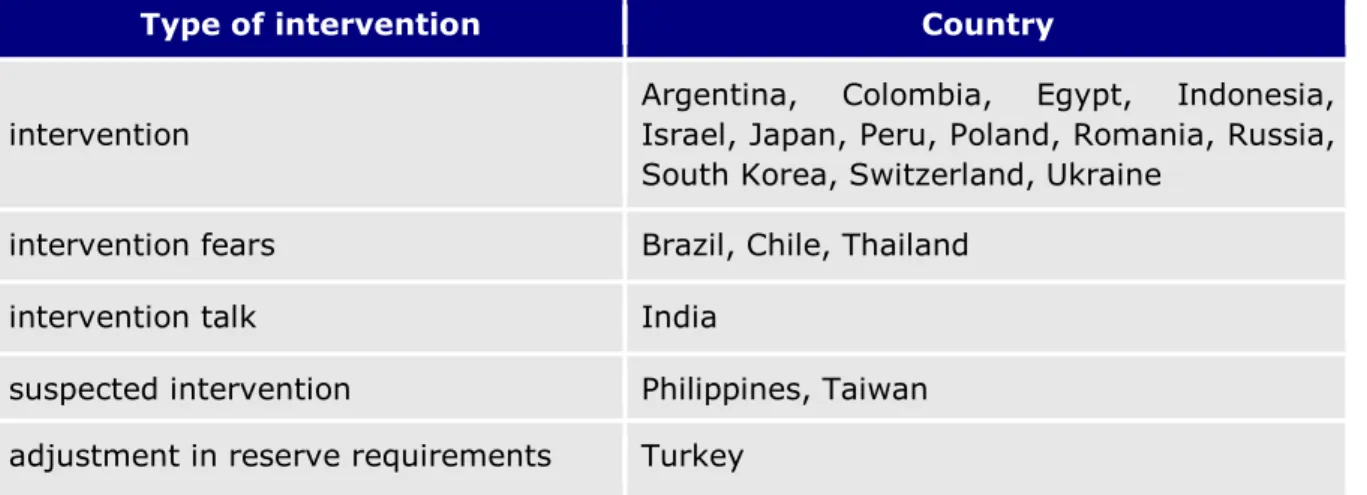
Table 1: Recently adopted policy measures to resist currency appreciation or favour depreciation in countries in a flexible exchange-rate regime
Type of intervention Country
intervention
Argentina, Colombia, Egypt, Indonesia, Israel, Japan, Peru, Poland, Romania, Russia, South Korea, Switzerland, Ukraine
intervention fears Brazil, Chile, Thailand
intervention talk India
suspected intervention Philippines, Taiwan adjustment in reserve requirements Turkey
Source: Adapted from Kaminska (2010).
Note: Australia was included in Kaminska (2010) as a country that has intervened in the foreign-exchange market, but the intervention by the Reserve Bank of Australia in May 2010 aimed at strengthening the currency
and we have therefore excluded this case. Most measures were introduced between August and October 2010.
Countries with pegged currencies, such as China, are not included.
The second issue – measures to counter appreciation – concerns a large number of countries. Table 1 lists various kind of recent (mostly between August and October 2010) attempts to slow down currency appreciation, including actual interventions, suspected interventions and oral interventions. The fact that 20 countries are included in the table indicates that recent attempts to depreciate home currencies have been widespread.
Intervention is only one way for countries to limit the impact of capital inflows.
Increasingly, governments also rely on an array of capital-control measures (Table 2).
Table 2: Examples of capital controls and related measures
Country Measures taken or considered
Brazil Two increases in October of the financial operations tax (IOF) applicable to incoming foreign investment in fixed- income instruments and funds.
Increased tax on margin deposits for derivative contracts of non-residents, aimed at reducing the profitability and volumes of foreign-exchange contracts.
Indonesia Announcements by the government of a minimum holding period for central bank bills.
South Africa Reserve accumulation, loosening of exchange controls for capital outflows of residents and raising of the maximum investment authorised overseas.
South Korea Bill submitted by South Korean lawmakers in November to impose a 14 percent withholding tax on interest income on bonds bought by foreign investors as well as a 20 percent capital-gains tax. Auditing of banks handling foreign derivative contacts.
Specific measures announced in July to mitigate the volatility of capital flows: ceilings on FX derivative positions of banks, regulations on the use of foreign currency loans, tightening of regulation on foreign currency liquidity of banks.
Thailand Introduction of a 15 percent withholding tax in October, applicable to interest income and capital gains on Thai debt for foreign investors. Officials have announced that they are studying the use of levies to control capital inflows, but not for short-term use.
Source: IIF, Financial Times, Reuters.
The third issue – unconventional monetary policy measures – came to the fore after the announcement in November 2010 by the Federal Open Market Committee of a $600bn
asset-purchase programme (QE2). This was widely seen in Europe and in the emerging world as an attempt to depreciate the US dollar. It prompted a series of negative reactions from senior policymakers in Europe, China and several emerging countries.
Although Bernanke (2010) emphasises that “the best way to continue to deliver the strong economic fundamentals that underpin the value of the dollar, as well as to support the global recovery, is through policies that lead to a resumption of robust growth”, the Fed’s policy continues to be disputed. This raises the question of how to determine when a monetary policy conducted in a floating exchange-rate regime context can be considered ‘beggar-thy-neighbour’. While the current emphasis is on the Federal Reserve, the Bank of England and the Bank of Japan have also adopted similar measures in the past year (Table 3). The European Central Bank’s purchase of periphery euro-area sovereign bonds is primarily aimed at improving the liquidity of these particular government bond markets and is deliberately sterilised, so it cannot be regarded as a way to stimulate the economy.
Table 3: Unconventional measures by major central banks No expansion of base
money (qualitative easing)
Expansion of base money (quantitative easing) Purchase of private assets
(credit easing)
ECB BoE, BoJ, Fed, SNB
Purchase of government bonds
ECB BoE, BoJ, Fed
Purchase of foreign- currency assets (forex intervention)
BOJ, SNB
Source: Adapted and updated from Meier (2009).
2.3. Exchange rate developments
With this background in mind, we now turn to assessment. How significant are recent exchange rate movements? To shed light on this, we scrutinise exchange rate developments from a medium-term (1995-2010) perspective. The most reasonable benchmark for assessing the value of a currency is a comparison to its equilibrium value.
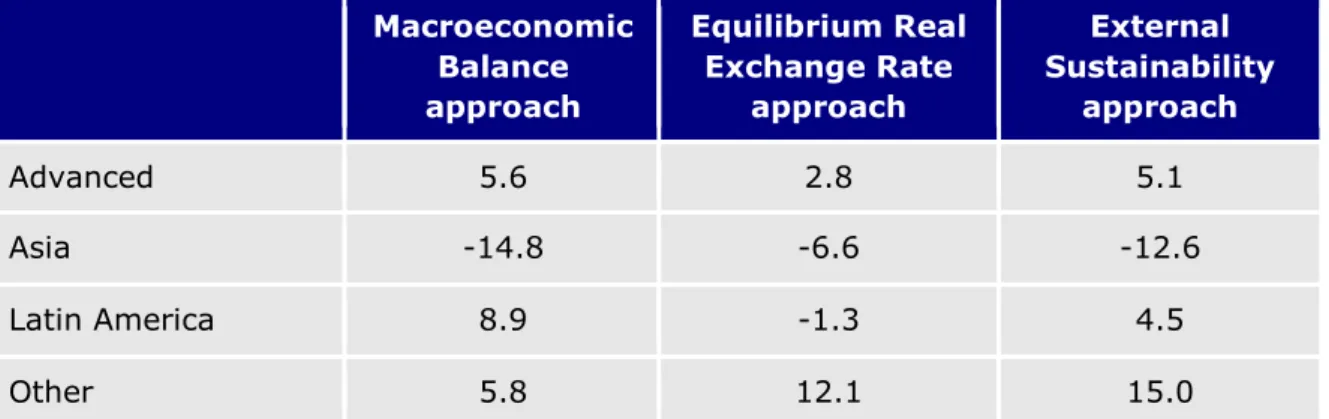
Unfortunately, methods for calculating equilibrium exchange rates all suffer from weaknesses and lead to largely diverse results: for example, estimates presented in Evenett (2010) suggest that the Chinese renminbi’s undervaluation ranges between zero percent and 50 percent. The recent estimates by IMF (2010b) for major G20 regions are shown in Table 4.
Table 4 indicates asymmetries. Advanced countries are estimated to be somewhat overvalued, while other emerging countries (Russia, South Africa and Turkey) are substantially overvalued, Asia is substantially undervalued, and the results for Latin America vary between models.
There are also likely asymmetries within each region. Country-specific data is unfortunately not available, but, for example, it is likely that the euro is much more overvalued than the British pound, or that the Brazilian real is more overvalued than the Argentine peso.
Lacking proper and up-to-date country-specific misalignment estimates, we use in the following sections the index of the real effective exchange rate, which measures the change in the inflation-adjusted exchange rate vis-à-vis the weighted average of trading partners compared to a base period.
Table 4: G20: Assessment of real effective exchange rate (percent deviation from medium-term equilibrium valuation)
Macroeconomic Balance approach
Equilibrium Real Exchange Rate
approach
External Sustainability
approach
Advanced 5.6 2.8 5.1
Asia -14.8 -6.6 -12.6
Latin America 8.9 -1.3 4.5
Other 5.8 12.1 15.0
Source: Table 1 from IMF (2010b).
Note: IMF (2010b) indicates that results reported are still a work in progress. Advanced: US, EU, Japan, UK, Canada and Australia); Asia: China, Korea, Indonesia and India; Latin America: Brazil, Mexico, Argentina;
Other: Russia, Turkey and South Africa. The estimates of ‘under’ or ‘over’ valuation of the REER are based on three approaches used by staff to assess misalignments: macroeconomic balance, equilibrium real exchange rate and external sustainability. IMF staff does not assess REER for oil exporters. Unfortunately information is not available about the period to which the misalignment calculations refer to.
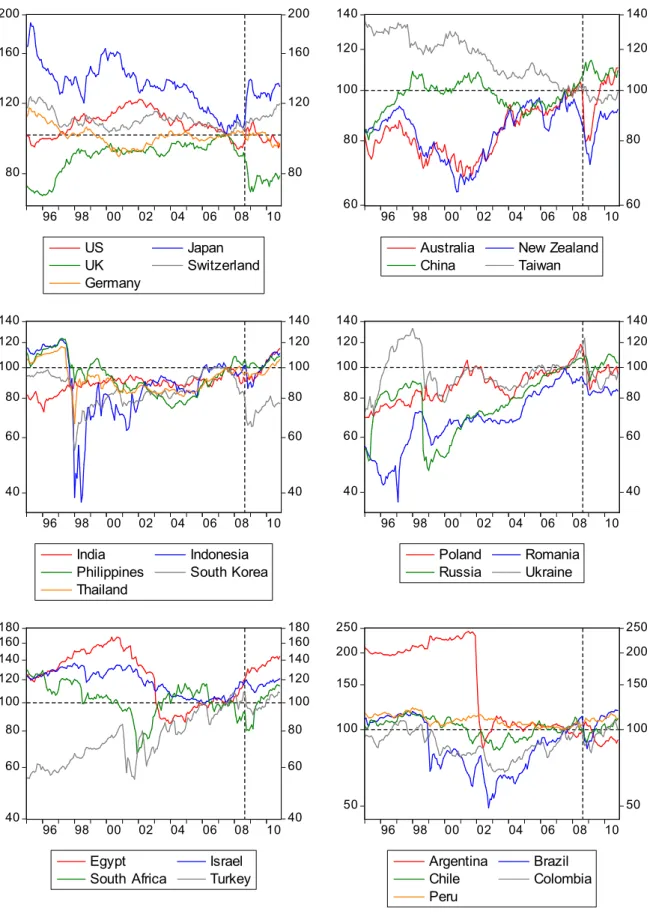
2.3.1. Medium-term movements
Figure 1 shows the change in the real effective exchange rate since January 1995 for the 23 countries listed in Tables 1, 2 and 3, plus Germany, Australia and New Zealand (three countries in which there was no intervention aimed at weakening the currency) and China (which pegs its currency to the US dollar). The general impression is that apart from a few exceptions, movements over the past few months have not been out of the ordinary relative to the trends of the past 15 years. It is more likely that fears over economic growth and unemployment in a less dynamic global environment make the currency issue more acute.
Only some countries can justify complaints about sharp appreciations. For example, India experienced a steady real appreciation (likely reflecting its economic catching-up) until the collapse of Lehman Brothers in September 2008, when the pace of appreciation speeded up. Another example is Brazil, which had a rather strong exchange rate before Lehman’s collapse, and faced a sharp, but only temporary depreciation after the Lehman shock and its current real exchange rate is very high by historical standards.
But there are also countries for which the extent of currency appreciation does not seem to be worrying when looking at this longer time horizon. For example, South Korea’s current real exchange rate level is still well below what it was around 2005, which leads some observers, especially in Japan, to claim that Korea’s policy is one of deliberate depreciation. But Japan’s real exchange rate level is also not exceptional: even though the Japanese yen experienced a huge jump from a historically low level at the time of the Lehman shock, the current rate is similar to the average value of about an eight-year period between 1996 and 2004. Egypt’s real exchange rate is about 40 percent above its July 2007 value, but Figure 1 shows that it also had a historically low value in 2007.
Israel’s real rate is close to its average over the past 15 years. Taiwan and especially
Argentina long followed a policy of keeping their currencies down and the crisis has not changed this policy.1
It is also interesting to observe that the Australian dollar’s current real rate is well above the values observed in the past 16 years, but despite this development Australia has not been regarded as a participant in the recent ‘currency war’.
All in all, our assessment shows that the recent changes in real effective exchange rates are not significant enough by themselves to justify speaking about a serious currency war. But they are substantial enough to bring to the fore the more fundamental issue of Chinese exchange rate fixity and capital controls, and those of a few other emerging countries in the current feeble global economy, since resumed capital flows to emerging countries now disproportionately impact some of those countries that have no or minor restrictions on capital inflows.
1 It is also important to highlight that real exchange rate appreciation is an equilibrium phenomenon in countries that are on a catching-up economic growth path. Since most emerging countries shown are on such a growth path, one should have expected a trend real appreciation, but this was not the case for many of these countries.
Figure 1: Real effective exchange rates based on consumer prices (January 1995=100), January 1995 - November 2010
200 160
120
80
200 160
120
80
96 98 00 02 04 06 08 10
US Japan
UK Switzerland
Germany
140 120
100
80
60
140 120
100
80
60 96 98 00 02 04 06 08 10
Australia New Zealand
China Taiwan
140 120 100 80 60
40
140 120 100 80 60
40 96 98 00 02 04 06 08 10
India Indonesia
Philippines South Korea Thailand
140 120 100 80 60
40
140 120 100 80 60
40 96 98 00 02 04 06 08 10
Poland Romania Russia Ukraine
180 160 140 120 100 80 60
40
180 160 140 120 100 80 60
40 96 98 00 02 04 06 08 10
Egypt Israel
South Africa Turkey
250 200 150
100
50
250 200 150
100
50 96 98 00 02 04 06 08 10
Argentina Brazil
Chile Colombia
Peru
Source: authors' calculations using data from the IMF International Financial Statistics (USD exchange rates and consumer prices), Datastream (USD exchange rates for periods that are missing from the IMF database), National Statistics of the Taiwan Province of China (USD exchange rate and consumer price index for Taiwan).
Note: increases in the index indicate real appreciation. The real effective exchange rate is calculated against 143 trading partners, covering, on average, 98.8 percent of foreign trade. Weights are derived on the basis of Bayoumi, Lee and Jaewoo (2006). The vertical dashed line indicates September 2008. Consumer prices are available till July 2010 in most cases: we have projected the consumer prices index till November 2010 by assuming that 12-month inflation rate does not change between the latest available observation and November 2010. Monthly average exchange rates are used up to October 2010, while the 29 November 2010 rates are used for November 2010.
2.3.2. Advanced versus emerging countries
So far we have computed trade-weighted real effective exchange rates for individual countries in relation to 143 other countries of the world. It is also possible to construct an effective exchange rate index between two groups of countries. Gouardo and Pisani- Ferry (2010) construct the index between two blocs of countries, ‘advanced’ and
‘emerging’. The sample is not comprehensive but it contains all major countries: it is comprised of the top 20 countries in terms of total trade (excluding euro-area countries), plus the euro area. In order to ensure a minimal degree of homogeneity with respect to the shock of the financial crisis, the group of advanced countries includes only western countries plus Japan (countries such as Singapore, or South Korea thus fall into the other group).2
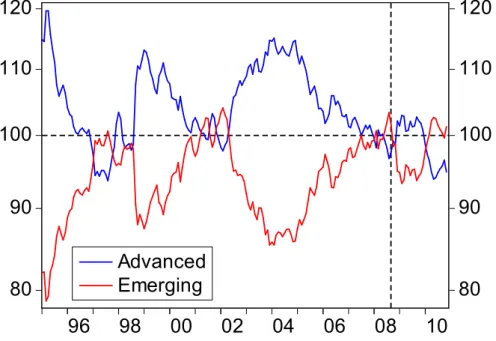
This simple, summary indicator helps to monitor the evolution of exchange rates between advanced and emerging economies. The ‘effective exchange rate of emerging countries against advanced countries’ is not simply the inverse of the ‘effective rate of advanced countries vis-à-vis emerging countries’, due to different weights (Figure 2), though the two series largely mirror each other.
Figure 2 shows long real exchange rate swings between the two major regions. Emerging countries appreciated until about mid-1997, when a series of contagious crises (in Asia, Brazil, Russia) pushed their currencies sharply down. Then they appreciated again until about 2001, when a new wave of emerging market crises (originating in Argentina, Brazil and Turkey) and the depreciation of the US dollar pushed them down again. The next rebound lasted until the summer of 2008, when emerging countries were close to their previous record high levels; this time the sudden stopping of capital inflows that followed the collapse of Lehman Brothers led again to a fall in their currencies. But the rebound was quite quick, most likely because previous emerging market crises had their origins in the unsustainable positions of certain emerging countries, while the current crisis has originated in the advanced world. By summer 2010 the real effective exchange rate index of the emerging countries was close to the pre-Lehman level. It has depreciated somewhat since because of a dollar effect: those emerging countries that tightly peg their currencies to the dollar (China, Hong Kong, Malaysia, United Arab Emirates) have all depreciated vis-à-vis the advanced countries’ group, while the currencies of India, Korea, Mexico, Poland and Thailand have appreciated. While volatility was high during recent periods, taking again a historical view, Figure 2 does not suggest that the recent period was extraordinary. On the contrary, what is extraordinary is the fact that despite an asymmetric shock of exceptional magnitude, emerging countries as a group have not appreciated markedly in real terms since summer 2007.
This observation does not exclude that from the point of view of individual countries, pressures to appreciate are seen as a threat to competitiveness and export-led growth.
But this signals a collective-action problem within the emerging group rather than
2 Advanced countries (Australia, Canada, Euro Area, Japan, Switzerland, Sweden, United States, United Kingdom) and emerging countries (Brazil, China, Hong Kong, India, Korea, Malaysia, Mexico, Poland, Russia, Saudi Arabia, Thailand, United Arab Emirates).
excessive appreciation of the group.
Figure 2: Real effective exchange rates between emerging countries and
advanced countries (based on consumer prices, July 2007=100), January 1995 - November 2010
120
110
100
90
80
120
110
100
90
80 96 98 00 02 04 06 08 10
Advanced Emerging
Source: updated and corrected from Gouardo and Pisani-Ferry (2010).
Note: the increase in the index indicates real appreciation. The vertical dashed line shows September 2008.
2.3.3. A look at the euro
So far we have looked at the real effective exchange rate of Germany, the largest euro- area country. The real effective exchange rate of Germany also takes into account intra euro-area trade and therefore the euro/dollar rate or the effective external exchange rate of the euro has lesser impact. But it also makes sense to look at the euro area as a whole and to analyse the euro’s external nominal and real exchange rate.3
Let us start with the nominal exchange rate of the euro against the dollar, which is presented in Figure 3 along with its purchasing power parity value.4 It is important to notice that the euro-dollar exchange rate continues to stay well above its equilibrium value as defined by purchasing power parity since mid-2003. While the euro area's problems undoubtedly triggered the depreciation earlier this year, they were in fact just a correction toward equilibrium. As a consequence, the euro seems to have been overvalued against the dollar since about mid-2003.
3 The importance of any measure of the real exchange rate can be assessed on the basis of trade/GDP ratios:
eg the importance of the real effective exchange rate of Germany against all countries can be assessed on the basis of total German exports and imports, while the importance of the external real rate of the euro can be assessed on the basis of extra-euro-area exports and imports of Germany and other euro-area countries.
4 Purchasing power parity is a contentious equilibrium concept, but still can serve as a rough benchmark.
Figure 3: Exchange rate of the euro against the US dollar and the purchasing power parity (PPP) conversion rate, 4 January 1999 – 29 November 2010
0.8 0.9 1.0 1.1 1.2 1.3 1.4 1.5 1.6
0.8 0.9 1.0 1.1 1.2 1.3 1.4 1.5 1.6
1 9 9 9 2 0 0 0 2 0 0 1 2 0 0 2 2 0 0 3 2 0 0 4 2 0 0 5 2 0 0 6 2 0 0 7 2 0 0 8 2 0 0 9 2 0 1 0
Market rate (daily data)
PPP conversion rate (annual data)
Source: daily market rate: ECB; implied PPP conversion rate: authors’ calculations using data from the IMF World Economic Outlook October 2010. The PPP conversion rate is available for each euro-area member state and we have calculated a time-varying weighted average (considering only those countries that were member of the euro area in the given year; using given year shares in aggregate euro-area GDP).
Note: an increase in the index indicates appreciation of the euro. A fixed-weight average of the PPP conversion rates of the first 12 countries that adopted the euro remains within plus/minus 0.6 percent range around the shown time-varying weighted average during 2001-10.
In Tables 1, 2 and 3 we listed 23 countries that can be considered as having directly or indirectly participated in the currency war: four advanced economies (US, Japan, UK and Switzerland) and 19 emerging countries. The left hand panel of Figure 4 shows long term (1970-2010) bilateral real exchange rate of the euro area against these four advanced economies. The right hand panel shows the external real effective exchange rate against 143 countries (all countries for which exchange rate and consumer price index data are available at least for the 1995-2010 period) and against the 19 floating emerging countries that participated in the currency war.
The long-term trends and recent levels of bilateral real exchange rates against the four advanced countries do not suggest any extraordinary movement that Europe should be concerned about. Against the US dollar, for example, the euro is at about the average level of 1990-96 and well below its summer 2008 peak level. Since July 2007, the euro has appreciated against the British pound, but its current level is quite similar to the average of the past four decades, and the euro has depreciated against both the Japanese yen and the Swiss franc.
In real effective terms (right hand panel of Figure 4), the euro is well below its average 2002-08 value. Consider only the 19 floating currency war emerging countries, the euro’s real value is close to historical lows.
Consequently, since July 2007 the euro has gained competitiveness against almost all countries regarded as having participated in the currency war (only the British pound has
depreciated against the euro, while the US dollar is practically at the same level as July 2007). Therefore, the complaint of euro-area policymakers about the partial reversal of the euro’s fall since July 2007 is not well founded.
Figure 4: External real exchange rate of the euro (January 1995=100) Bilateral real exchange rates,
January 1970 – November 2010
Real effective exchange rates, December 1992 – November 2010 160
140 120 100 80 60
40
160 140 120 100 80 60
40 70 75 80 85 90 95 00 05 10
US Japan
UK Switzerland
130 120 110 100 90 80
70
130 120 110 100 90 80
70 92 94 96 98 00 02 04 06 08 10
143 countries of the world
19 currency war emerging countries
Source: see at Figure 1.
Note: see at Figure 1. An increase in the index indicates real appreciation of the euro against the countries indicated in the legend. The vertical dashed line indicates September 2008.
3. MOTIVES FOR POLICY MEASURES IMPACTING CURRENCY MOVEMENTS
3.1. The output shock
There is a fundamental asymmetry between advanced and emerging countries concerning the impact of the shock on the real economy during the crisis, and also considering longer term growth developments. In advanced countries, private deleveraging remains incomplete while public deleveraging has barely started, and demand is set to remain subdued for years to come. But the developing and emerging countries remain on a growth track. Figure 5 presents the diverging developments by showing GDP, normalised as 2007=100, as seen in October 2007 and in October 2010 in the two main country groups5 and a few selected countries.
5 The compositions of the advanced and emerging country groups are identical to the groups shown in Figure 3;
see footnote 2.
Figure 5: GDP forecasts to 2012: October 2007 versus October 2010 (2007=100)
160 140 120
100
80
2005 2010 Emerging countries
160 140 120
100
80
2005 2010 Brazil 160
140 120
100
80
2005 2010 Russia 160
140 120
100
80
2005 2010
India 160
140 120
100
80
2005 2010
China 160
140 120
100
80
2005 2010 Poland
160 140 120
100
80
2005 2010 Advanced countries
160 140 120
100
80
2005 2010 Euro area 160
140 120
100
80
2005 2010
2007 Vintage 2010 Vintage
US 160
140 120
100
80
2005 2010
Japan 160
140 120
100
80
2005 2010
UK 160
140 120
100
80
2005 2010 Australia
Source: authors’ calculations using data from the October 2007 and October 2010 IMF World Economic Outlooks.
Note: due to revisions of historical data, the pre-2007 data are not identical in the two vintages.
Emerging countries were barely hit with the exception of eastern European emerging countries, such as Russia. But Brazil, India and China have not been hit at all.
By contrast, advanced countries have been hit hard on average and positive examples are rare. Australia is one positive example, having not suffered too much from the crisis and having one of the best growth prospects among advanced economies. This likely explains its absence from the currency war dispute despite having a strong currency:
instead, Glenn Stevens, governor of the Reserve Bank of Australia, has welcomed a stronger exchange rate (see Goodman and Zachariahs, 2010).
But most other advanced countries suffered in the crisis, even though there are quite significant differences between the euro area, Japan, the UK and the US (Figure 6).
These differences warrant different policy responses (Pisani-Ferry and Posen, 2010):
• First, US GDP declined less and recovered faster than in the euro area, Japan or the UK – though it remains early days for a recovery, which seems to weakening in the US, and perhaps strengthening in northern continental Europe;
• Second, US employment declined much more than European, Japanese and UK employment and did not start exhibiting feeble signs of recovery until early 2010.
Consequently, the 2008-09 employment decline was exceptionally deep and prolonged in the US whereas in Europe (including the UK) and Japan it was not exceptional;
• Third, as a result, productivity developments have been strikingly divergent. Nine quarters after the start of the recession, GDP per employee had increased by about 4 percent (the more appropriate measure of productivity, GDP per hour, had increased by about 7 percent) in the US whereas it was still below the initial pre-crisis level in the euro area, Japan and the UK;
• Fourth, Japan’s investment was the hardest hit: it fell by 35 percent with major consequences for potential output developments. There are less pronounced differences in the US, the UK and the euro area, despite the differences in growth rates and financial systems.
Figure 6: Impact of the crisis on GDP, employment, output per hour and non- residential investment in the euro area the UK, Japan and the US (Percent movement per quarter from pre-recession output peak)
-9 -8 -7 -6 -5 -4 -3 -2 -1 0
-9 -8 -7 -6 -5 -4 -3 -2 -1 0
0 1 2 3 4 5 6 7 8 9 10
GDP
-6 -5 -4 -3 -2 -1 0 1
-6 -5 -4 -3 -2 -1 0 1
0 1 2 3 4 5 6 7 8 9 10
Employment
-8 -6 -4 -2 0 2 4
-8 -6 -4 -2 0 2 4
0 1 2 3 4 5 6 7 8 9 10
Euro Area Japan United Kingdom United States
GDP per employee
-40 -30 -20 -10 0
-40 -30 -20 -10 0
0 1 2 3 4 5 6 7 8 9 10
Non-residential investment
Source: updated from Pisani-Ferry and Posen (2010) using data from OECD and Datastream.
Note: pre-recession output peak is 2008Q1 for euro area, Japan and UK, 2008Q2 for US
It is not entirely clear why there was a big divergence in employment and therefore productivity between the US and Europe (where the evolutions in the euro area and the UK are remarkably similar). Part of the explanation is that US companies, which are less constrained by firing restrictions, traditionally adjust their payrolls faster than European counterparts. But if this was the only reason, the evolution in the UK, which also has what is considered to be a flexible labour market, should mimic that of the US.6 Part has to do with specific shocks affecting the real estate and finance sectors, which had grown very large in the US compared, on average, to Europe. And part results from the fact that in response to the crisis, several European governments introduced or strengthened
6 A country where employment has evolved in a similar way to the US is Spain, where employers have made use of the flexibility offered by temporary contracts.
schemes aimed at encouraging job preservation, such as the German Kurtzarbeit (IMF, 2010a); those policies, however, did not include all countries with limited unemployment rises, such as the UK. The strength of the post-recession US productivity boom and the subdued productivity response in most of continental Europe remain puzzling (Wilson, 2010).
3.2. Private deleveraging
The strength of domestic demand in the short to medium run largely depends on the extent to which private agents will engage in deleveraging. To assess the comparative situation in the US, the euro area and the UK, Table 5 shows changes in levels of indebtedness from 1999 to 2007, and from 2007 to 2009. The numbers seem to tell a clear story.
In the 2000s, households went much more into debt in the US and the UK than in the euro area. The contrast is striking, with the rise in household indebtedness as a share of GDP in the US and the UK three times larger than for the euro area – and in 1999 the initial levels of household debt in the euro area was already significantly smaller than in the US. The change in non-financial corporate indebtedness offers a more comparable transatlantic picture, though the lower increase in the US may be explained by the greater reliance on capital markets by US firms.
There are signs that the deleveraging process for households and perhaps non-financial corporations has begun in the US, though on a limited scale so far. It is not clear that such a process is inevitable for the euro area as a whole – though of course the divergences in indebtedness among member countries are quite enormous (and deleveraging has begun in Ireland and Spain). On the whole, balance sheet data justifies more concern about the risks of sluggish demand and recovery in the US and the UK than in continental Europe, while also underlining the greater unsustainability of borrowing patterns in the US.
Table 5: Level and changes in indebtedness (percent of GDP) Households Non-financial
corporations
US UK EA US UK EA
1999 69.0 68.5 49.5 62.8 71.6 66.9
2003 83.3 82.8 53.5 64.3 86.3 81.5
2007 96.6 98.4 61.2 74.1 106.6 90.9
2009 95.3 103.3 65.5 76.1 120.6 100.5
Change 1999-2007 27.6 30.0 11.7 11.3 35.0 24.0
Change 2007-2009 -1.3 4.8 4.3 2.1 14.0 9.6
Source: Table 1 from Pisani-Ferry and Posen (2010).
3.3. The quantitative easing debate
Whatever the US domestic debate, the rest of the world is highly doubtful about the US Federal Reserve programme of asset purchases (QE2). The Europeans have been especially vocal but there are also fears about its consequences in Japan and the emerging world. Critics argue that QE2 leads to the weakening of the dollar vis-à-vis floating exchange rate countries, and to capital outflows especially to emerging countries.
Capital flows to emerging countries either push up their exchange rates, or, if emerging country central banks intervene in the foreign exchange market to resist appreciation and are not able to sterilise the resulting money creation, inflation pressures will raise.
Inflation pressures will necessitate interest rate hikes, thereby providing further incentives for capital inflows.
The question is, can QE2 be characterised as beggar-thy-neighbour?
In a recent speech, Bernanke (2010) said that asset purchases by the Fed are only the continuation of conventional monetary policy by other means, the difference being that they affect the interest rates of longer maturity securities, whereas conventional monetary policy primarily affects the short end of the yield curve. If this definition is accepted, then it follows that the criterion for determining whether QE can be considered beggar-thy-neighbour is the same as for conventional monetary policy.
There is no explicit criterion for assessing the cooperative character of monetary policy and the resulting exchange-rate developments. There was one in the post-war fixed exchange-rate regime as currency devaluation was subject to the IMF and to the scrutiny of partners. Parity adjustments within the earlier European Monetary System were also assessed by partners (and are still subject to approval in the current EMR-2 system).
There was also a brief interlude in the second half of the 1980s during which the G7 targeted exchange rate developments.7 But no such criterion exists in a floating exchange rate regime based on the principle of monetary policy autonomy.
An implicit criterion however has emerged from the central banks’ practice of the last two decades: as long as monetary policy remained geared towards price stability as usually defined – say, an inflation objective in the 1-3 percent range – it has been generally assessed in line with the requirements, or at least the spirit of international cooperation.
If this implicit criterion is also accepted the question becomes twofold:
• First, what does this definition become in a context in which inflation objectives are frequently undershot? If the inflation objective is, say, two percent, but actual inflation one percent for an extended period because of the extent of economic slack, one central bank (say, the ECB) may conclude that it has to accept that it is temporarily unable to reach its objective, whereas the other (say, the Fed) may conclude that it needs to commit even more strongly to reaching the inflation objective, possibly by adopting a price-level instead of a price-change target. This would lead to significant monetary policy divergence with immediate consequences for the exchange rate (even if these consequences would be offset in the medium term by inflation differentials). This is entirely a monetary policy issue that arises from the lack of a commonly agreed definition of cooperative policy in a deflationary environment.
• Second, is monetary policy geared towards price stability in the medium run? This boils down to determining if there is a risk of fiscal dominance, ie of an
7 From 1980-85 the US dollar appreciated sharply (see eg the euro/dollar real exchange rate on Figure 4) largely due to the Fed’s aggressive anti-inflationary monetary policy. On 22 September 1985 at the Plaza Hotel in New York City, France, Germany, Japan, the UK and the US agreed to coordinated central bank intervention to depreciate the US dollar (the ‘Plaza Accord’). The US dollar consequently started to depreciate. But the speed and the magnitude of the dollar’s slide was seen as excessive. Therefore, on 22 February 1987, at the Louvre in Paris, the five countries plus Canada reached an agreement to halt the decline of the US dollar and to stabilise the international currency markets (the ‘Louvre Accord’).
unsustainable fiscal policy ultimately leading to an irresistible pressure to monetise the public debt. The problem here is not the monetary policy stance itself, rather its sustainability in the absence of a framework guaranteeing fiscal discipline.
The exchange-rate consequences of different monetary policy attitudes in a deflationary context are limited. They may drive a temporary depreciation of the dollar exchange rate vis-à-vis the euro and other currencies, but they are unlikely to result in major misalignments. For example, the estimates presented in Neely (2010) suggest that the Fed’s first asset-purchase programme (QE1) between November 2008 and March 2009 had a cumulative downward impact on the dollar of 6.5 percent against various currencies of advanced countries. The calculations of Joyce et al (2010) suggest that the Bank of England’s asset purchase had a three percent cumulative effect on the exchange rate of sterling (four percent initial impact of which one percent was corrected later).
These estimates, which should be cautiously assessed, do not suggest that QE had a significant impact on exchange rates. Furthermore, Neely (2010) finds that the Fed’s QE1 did not decrease US yields only, but also had a sizeable downward impact on yields of other advanced countries.8 And US 10-year bond yields are not extraordinary low by international comparisons (Figure 7).
At least in principle, spillovers to other advanced countries can be limited by discussions between central banks on the interpretation of their price stability mandate in a deflationary context. The more difficult issue is clearly related to increased capital inflows to emerging countries with flexible exchange rates and the associated problems the inflows cause. But as we argued, the acute nature of this issue is primarily the consequence of asymmetric openness of emerging countries: since some major players, such as China, retain broad-based capital controls, capital inflows impact those emerging countries that have more liberalised capital accounts.
But the consequences of an expectation of debt monetisation would be much more severe as its effects would extend beyond the relatively short-term monetary policy horizon. It would in all likelihood lead market participants to short the currency, triggering a major real depreciation in the short term. In Europe, all governments have plans to restore budgetary sustainability. In the US, partisan strife over budgetary policy leads to concern that the Fed will ultimately have to inflate the problem away, even though longer-term US inflation expectations remain near historic lows (Table 6). Recent reactions to fiscal consolidation proposals9 suggest that the US has got perilously close to the ‘war of attrition’ situation once described by Alesina and Drazen (1991). This, more than the Fed’s stance, is the real danger.
8 For example, he finds that QE1 between November 2008 and March 2009 lowered US 10-year government bond yields by 107 basis points, but at the same time it lowered the 10-year yield in Australia by 78 basis points, in Canada by 54 basis points, in Germany by 50 basis points, in Japan by 19 basis points and in the UK by 65 basis points.
9 On 10 November 2010 the co-chairs of the bipartisan Simpson-Bowles Fiscal Commission appointed by President Obama presented preliminary findings and recommendations for deficit reduction. A few days later, on 17 November, the Domenici-Rivlin panel appointed by the Bipartisan Policy Center also presented recommend-actions for deficit reduction. Both sets of proposals failed to command consensus, on the contrary spending cuts were flatly rejected by senior Democrats while tax increases were rejected by senior Republicans.
Table 6: US inflation expectations (percent)
Date of inflation expectations formation
Horizon Jan 2007
July 2007
Jan 2008
July 2008
Jan 2009
July 2009
Jan 2010
July 2010
Nov 2010
1 year 2.7 2.6 2.5 3.0 0.5 1.6 1.7 1.0 1.4
10 years 2.5 2.6 2.2 2.3 1.6 2.0 2.0 1.7 1.5
Source: Federal Reserve Bank of Cleveland.
Note: See the description of the methodology in Haubrich (2009).
Figure 7: 10-year benchmark government bond yields, 3 January 2005 – 29 November 2010
0 1 2 3 4 5 6
Jan/2005 Jul/2005 Jan/2006 Jul/2006 Jan/2007 Jul/2007 Jan/2008 Jul/2008 Jan/2009 Jul/2009 Jan/2010 Jul/2010
US UK Japan
Euro (Synthetic) Germany
Source: Datastream.
4. CONCLUSIONS AND IMPLICATIONS FOR THE EURO AREA
There are different elements of the currency war dispute, which have different impacts on the global economy and on Europe:
1 The most significant is the fundamental issue of the long-term currency peg of some important countries, most notably China.
2 There have been several recent attempts to impact the exchange rate of countries having floating exchange-rate regimes.
3 The third is quantitative easing by the Federal Reserve, the Bank of England and the Bank of Japan.
We are concerned about the first element of currency war for three reasons:
First, while estimates of equilibrium exchange rates from different models vary widely, the typical result shows undervaluation of the Chinese renminbi. This by itself would justify some nominal appreciation and will lead to gradual real appreciation through higher Chinese inflation if the nominal exchange rate is kept stable.10
Second, the crisis impacted emerging and advanced countries in an asymmetric way.
Non-European emerging countries were not hit much by the crisis, while advanced countries suffered much more. In advanced countries, private deleveraging and public consolidation are likely to continue to represent a drag on domestic demand. This fundamental asymmetry will need to be compensated for by some form of adjustment in relative prices, even though exports from the block of advanced countries to the block of emerging countries still represent only a small share of GDP.11 The real effective exchange rate of emerging countries sharply depreciated after the collapse of Lehman Brothers and so far it has reverted to its pre-Lehman level. But further adjustment may be needed and there is also an asymmetry within the emerging country group: while China and some Middle Eastern countries peg their currencies to the US dollar, which is weakening partly due to US monetary policy, emerging countries with floating exchange rates and open capital accounts have to face increasing capital inflows. With a view to economic growth and competitiveness relative to China, many of these countries would like to resist capital inflows by employing various policy actions, which have led their participation in the second form of currency war.
Third, there is a risk that the US may retaliate against Chinese currency fixity with tariffs and possible other trade measures, which may give rise to the adoption of protectionist measures elsewhere in the world as well. The experience of the 1930s suggests that this would prolong economic stagnation.
10 Note however that parts, components and semi-finished goods are a large share of US imports from China.
An appreciation of the renminbi against the dollar would increase the cost of these intermediate inputs;
therefore it is not clear what impact a renminbi appreciation would have on US growth and jobs. Using a computational model of global trade Francois (2010) even concludes that a renminbi appreciation or a trade war between the US and China would lead to US job losses, but would improve the US trade balance.
11 The exports of the block of advanced countries to all other countries make up 7.6 percent of advanced countries GDP, of which 2.9 percent goes to the group of emerging countries used in our study and 4.7 percent to other countries. Note that export is a gross measure and therefore the GDP share of added value in exports is even lower.
We are less worried about the second and third elements of currency war, even though about 20 floating exchange rate countries have adopted measures to resist currency appreciation or weaken their currencies, indicating that the ‘war’ is widespread.
The US and the UK implemented quantitative easing primarily for domestic policy purposes and not with the prime purpose of influencing the exchange rate: although we do not deny that they may adversely impact other countries, our assessment is that at present these policy measures remain broadly in line with domestic economic developments. As observed by Eichengreen (2010), simultaneous monetary easing by quantitative easing and unsterilised foreign exchange intervention is not a zero-sum game and the resulting monetary stimulus may have a positive impact on growth, benefiting also those countries that have not participated in this ‘war’.
Concerning emerging countries that try to resist capital flows, their efforts are also justified for two main reasons: (1) quantitative easing in the US is likely to induce capital inflows to these countries and (2) China keeps a peg to the dollar. While a collective appreciation of the whole emerging country region against advanced countries may be warranted, no emerging country would like to appreciate against China.
Our more benign view of these second and third elements of currency war is also supported by recent developments in real effective exchange rates, which do not indicate significant impacts, at least so far: countries participating in this war have not achieved a marked depreciation of their currencies and in fact most of them are still experiencing appreciation. These developments suggest that the weapons used to fight the war may not be very effective in most cases.
Concerning the euro, its exchange rate has not been impacted much by the recent
‘currency war’, at least so far: it continues to be overvalued, but to a lesser extent than before Lehman’s collapse. The euro exchange rate is also significantly impacted by market perceptions concerning the sovereign debt crisis of some periphery euro-area members. A sizeable depreciation of the euro earlier this year was the result of this internal crisis and the recent recovery of the euro can also be the consequence of brighter market perceptions about the future of the euro area.
The implications for Europe of the three elements of ‘currency wars’ follow our assessments. European policymakers should not criticise floating exchange rate emerging countries that try to resist capital inflows, at least while China keeps its exchange rate system unchanged. The European critique of the Fed’s recent quantitative easing measures is also not well grounded while the Fed’s monetary policy remains geared towards price stability and does not amount to a monetisation of the public debt. But central banks should agree a consensus about the definition of internationally acceptable policies in a time of deflationary pressures. In particular, major central banks should agree on whether or not a price level target is warranted (which would compensate temporary below-target inflation with temporary above-target inflation later).
The most delicate issue remains the dollar peg of a large number of emerging countries.
Goldberg (2010) reports the shocking number than 50 percent of all countries of the world use the dollar, or peg to the dollar, or tightly manage the exchange rate to the dollar, and these countries constitute 36 percent of world GDP. Of these countries China and some Middle East countries stand out by their size. This issue is undoubtedly related to the renewed debate on the international monetary system, in which Europe has so far kept a low profile. The recent crisis has clearly showed serious flaws of the current ‘non-
system’ (Darvas and Pisani-Ferry, 2010). It is in Europe’s best interest to foster a reform of the international monetary system, including the design of mechanisms that can help to correct global imbalances.
REFERENCES
Alesina, Alberto and Alan Drazen (1991) ‘Why Are Stabilizations Delayed?’, American Economic Review vol. 81, No. 5, pp. 1170-1188
Avent, Ryan (2010) ‘Of course you realise this is nothing like war’, The Economist Free exchange, http://www.economist.com/blogs/freeexchange/2010/10/foreign_exchange Bayoumi, Tamim, Jaewoo Lee and Sarma Jayanthi (2006) ‘New Rates from New Weights’, IMF Staff Papers 53(2), 272-305
Bernanke, Ben (2010) ‘Rebalancing the World Economy’, speech at the Sixth European Central Banking Conference, Frankfurt, 19 November
Bruegel and WIIW (2010) Whither Growth in Central and Eastern Europe? Policy lessons for an integrated Europe, report written by Torbjörn Becker, Daniel Daianu, Zsolt Darvas, Vladimir Gligorov, Michael Landesmann, Pavle Petrovic, Jean Pisani-Ferry, Dariusz Rosati, André Sapir and Beatrice Weder Di Mauro, Bruegel Blueprint Volume XI, http://www.bruegel.org/publications/show/publication/whither-growth-in-central-and- eastern-europe-policy-lessons-for-an-integrated-europe.html
Darvas, Zsolt and Jean Pisani-Ferry (2010) ‘Future development of global imbalances’, Briefing paper prepared for the European Parliament's Committee on Economic and
Monetary Affairs, March 2010,
http://www.bruegel.org/publications/show/publication/future-developments-of-global- imbalances.html
Eichengreen, Barry (2010) ‘Financial Shock and Awe’, Foreign Policy, 6 October, http://www.foreignpolicy.com/articles/2010/10/06/financial_shock_and_awe
Evenett, Simon, ed. (2010) ‘The US-Sino Currency Dispute: New Insights from Economics, Politics and Law’, A VoxEU.org Publication, CEPR, http://www.voxeu.org/index.php?q=node/4868
Francois, Joseph (2010) ‘Deconstructing Sino-US codependence: revaluation, tariffs, exports and jobs’, in: Evenett, Simon, ed. (2010) ‘The US-Sino Currency Dispute: New Insights from Economics, Politics and Law’, A VoxEU.org Publication, CEPR, http://www.voxeu.org/index.php?q=node/4868
Goodman, Wes and Candice Zachariahs (2010) ‘The Aussie Dollar Soars, Central Bank
Shrugs’, Bloomberg Businessweek 18 November 2010,
http://www.businessweek.com/magazine/content/10_48/b4205022086975.htm
Goldberg, Linda S. (2010) ‘Is the International Role of the Dollar Changing?’, Current Issues in Economics and Finance vol. 16, no. 1, Federal Reserve Bank of New York, http://www.ny.frb.org/research/current_issues/ci16-1.pdf
Gouardo, Christophe and Jean Pisani-Ferry (2010) ‘Currency Wars: What do Effective Exchanges Rates Tell Us?’, mimeo, Bruegel
Haubrich, Joseph G. (2009) ‘A New Approach to Gauging Inflation Expectations’, Economic Commentary, Federal Reserve Bank of Cleveland, 29 October 2009, http://www.clevelandfed.org/research/commentary/2009/0809.pdf
International Monetary Fund (2010a) ‘Unemployment dynamics during recessions and recoveries: Okun’s law and beyond’, chapter 3 of April World Economic Outlook
International Monetary Fund (2010b) ‘Global Economic Prospects and Policy Challenges’, report prepared by the staff of the IMF for the meeting of G-20 Finance Ministers and Central Bank Governors, October 21-23, 2010, Gyeongju, Korea
Joyce, Michael, Ana Lasaosa, Ibrahim Stevens and Matthew Tong (2010) ‘The financial market impact of quantitative easing’, Bank of England Working Paper No 393, August, http://www.bankofengland.co.uk/publications/workingpapers/wp393.pdf
Kaminska, Izabella (2010) ‘25 interventions in a one week band, redux’, 13 October 2010, http://ftalphaville.ft.com/blog/2010/10/13/368416/25-interventions-in-a-one- week-band-redux/
Meier, André (2009) ‘Panacea, curse or nonevent? Unconventional monetary policy in the United Kingdom,’ IMF Working Paper no 09/163, August, http://ideas.repec.org/p/imf/imfwpa/09-163.html
Neely, Christopher J. (2010) ‘The Large-Scale Asset Purchases Had Large International Effects’, Federal Reserve Bank of St. Louis Working Paper 2010-018B, July, http://research.stlouisfed.org/wp/more/2010-018/
Pisani-Ferry, Jean and Adam S. Posen (2010) ‘From Convoy to Parting Ways? Post-crisis Divergence Between European and US Macroeconomic Policies’, paper prepared for Bruegel-PIIE conference, Washington DC, 8 October
Wilson, Daniel (2010) ‘Is the Recent Productivity Boom Over?’, FRBSF Economic Letter
No 2010/28, September,
http://www.frbsf.org/publications/economics/letter/2010/el2010-28.html