Article
Disruption Potential Assessment of the Power-to-Methane Technology
Gábor Pörzse1 , Zoltán Csed ˝o2,3,* and MátéZavarkó2,3
Citation: Pörzse, G.; Csed˝o, Z.;
Zavarkó, M. Disruption Potential Assessment of the Power-to-Methane Technology.Energies2021,14, 2297.
https://doi.org/10.3390/en14082297
Academic Editor: Attila R. Imre
Received: 17 March 2021 Accepted: 14 April 2021 Published: 19 April 2021
Publisher’s Note:MDPI stays neutral with regard to jurisdictional claims in published maps and institutional affil- iations.
Copyright: © 2021 by the authors.
Licensee MDPI, Basel, Switzerland.
This article is an open access article distributed under the terms and conditions of the Creative Commons Attribution (CC BY) license (https://
creativecommons.org/licenses/by/
4.0/).
1 Corvinus Innovation Research Center, Corvinus University of Budapest, 1093 Budapest, Hungary;
gabor.porzse@uni-corvinus.hu
2 Department of Management and Organization, Corvinus University of Budapest, 1093 Budapest, Hungary;
mate.zavarko@uni-corvinus.hu
3 Power-to-Gas Hungary Kft, 5000 Szolnok, Hungary
* Correspondence: zoltan.csedo@uni-corvinus.hu
Abstract:Power-to-methane (P2M) technology is expected to have a great impact on the future of the global energy sector. Despite the growing amount of related research, its potential disruptive impact has not been assessed yet. This could significantly influence investment decisions regarding the implementation of the P2M technology. Based on a two-year-long empirical research, the paper focuses on exploring the P2M technology deployment potential in different commercial environments.
Results are interpreted within the theoretical framework of disruptiveness. It is concluded that P2M has unique attributes because of renewable gas production, grid balancing, and combined long-term energy storage with decarbonization, which represent substantial innovation. Nevertheless, empirical data suggest that the largest P2M plants can be deployed at industrial facilities where CO2can be sourced from flue gas. Therefore, a significant decrease of carbon capture technology related costs could enable the disruption potential of the P2M technology in the future, along with further growth of renewable energy production, decarbonization incentives, and significant support of the regulatory environment.
Keywords: power-to-methane; disruptive technology; seasonal energy storage; decarbonization;
innovation
1. Introduction
Novel solutions on renewable energy integration and energy storage challenges [1] are driving the global transformation of the energy sector [1–6], due to a significant increase of solar and wind cumulative capacity [7]. This process will even accelerate within the EU because of the European Green Deal (December 2019) and the European Climate Pact (December 2020 [8]). Power-to-methane (P2M) technologies should be considered among these novel (but already commercially ready) solutions, as P2M is suitable for seasonal energy storage by utilizing capacities of the natural gas grid, as well as grid-balancing and carbon reuse [9–11].
The potential impact of P2M technology on the energy sector has already appeared in the power-to-gas (P2G) literature, which continuously broadens with novel technical and economic studies [12–14]. There is a consensus of the crucial role of the P2G technology for the future energy sector [12,15]. Innovation management aspects of P2G technology have also been already (partly) covered [16,17]. A key term and a key phenomenon, however, in the intersection of these three key topics (1: future impact, 2: techno-economic aspects, 3: innovation), called “disruptive technology” and “disruption” are overlooked in the literature despite its importance. The disruptiveness of a technology is highly important from investment aspects because disruptive technologies usually seem inferior from a certain performance aspect compared to other, better-known solutions, even though, later, they can change the dynamics of a whole sector. In other words, investing in P2M on a company level and/or state level could affect organizational/sectoral competitiveness, as
Energies2021,14, 2297. https://doi.org/10.3390/en14082297 https://www.mdpi.com/journal/energies
it should enable building new competencies through innovation [18], adaptation to new environmental changes [19], sustained and also sustainable growth [20].
The disruptive technology theory is usually applied in business and innovation man- agement research and is less frequently applied in technical contexts or for examining new energy technologies. In broader context, technology- and disruption-focused schol- ars currently pay attention to digital solutions (e.g., [21–25]), and there are few similar disruption-focused studies in energy research (e.g., [26–29]). For example, Ullah et al. [30]
examined the adoption of blockchain technology for energy management in developing countries discussing the distributed ledger technology as disruptive. Zeng et al. [31]
pointed out that conventional energy technologies are dominant in the energy sector, and found that low price, high consistency, and high improvement rate are key for the diffusion of renewable energy technologies. In contrast to this broad view, a narrower approach was followed by Müller and Kunderer [32] when they predicted the potential disruption hazard of redox-flow batteries towards lithium-ion batteries with quantitative methodology. This study focuses on the attributes of P2M and does not determine ex-ante its disruptiveness, nor their competing technologies, but identifies them based on empirical data collection and analysis.
Based on the literature, P2M technology in a macro-economic context means an opportunity not only for seasonal energy storage but for decarbonization, as well, as it converts CO2into CH4in the presence of H2[33]. Moreover, P2M can provide e.g., sector coupling [34], new business opportunities on a company-level [35], or also new challenges for the regulators [16]. Thus, P2M seems to be disruptive at first sight. By definition, however, some other questions arise regarding the disruptiveness of the P2M technology.
Even so, according to Christensen et al., who introduced the term disruptive technology in 1995 [36], numerous experts and researchers use wrongly the term “disruptive innovation”
because it is not only about shaking up an industry and struggling companies which were formerly market-leading [37]. Consequently, to identify a disruptive technology, it is worth going back to the fundamentals of the theory. The main research question of the paper is whether P2M is a disruptive technology by definition or not. Based on the above, the working hypothesis of the paper is that P2M could become a disruptive technology.
Main reasons for the conditional approach are (1) the future time horizon of the examined phenomenon, and (2) the hybrid (quantitative and qualitative) methodology applied.
The main practical contribution of this study is that it provides insights for P2M deployment planning within different technical environments, and it identifies those factors which would incite companies and governments to invest resources into P2M deployment in large-scale. The main theoretical contribution is that, to our best knowledge, this study is the first that uses the fundamentals of the disruptive theory in power-to- gas research. Furthermore, the study is contributing to the P2M research field with its hybrid methodology as well: while solely qualitative studies often cannot utilize findings from the field to make general conclusions, and quantitative studies sometimes overlook underlying aspects and challenges of technology development which could be explored by only qualitative methodology, this study involves both qualitative and quantitative data collection and analyses in order to extend empirical findings to broader conclusions for P2M technology development.
2. Materials and Methods 2.1. Research Framework
The counterpoint of the disruptive technology is the “sustaining technology.” The sustaining technologies incorporate incremental developments and fit mainstream cus- tomer needs. In contrast, disruptive technologies are wholly new solutions, and they create value with an entirely different attribute package that initially does not meet mainstream needs [37]. Instead, they are viable in a niche or low-end market (which is less profitable), or even on a previously non-existing market which is created by a disruptive technology itself, changing non-consumers to consumers [37]. Thus, an important question is, in case
of possible disruptiveness of P2M, (RQ1) what are the key attributes of P2M for potential technology adopters and how can they be evaluated compared to other (maybe sustaining) technologies? Regarding this research question, the focus is on the technical opportunities which outline value creation for technology adopters, as previous research showed that economic conditions of day-to-day P2M operations are highly dependent on state support and regulatory environment [17], which is not easy to predict.
While common examples for disruptive solutions are the Netflix streaming ser- vices [37] and the copiers of Canon in the late 1970s [38], one can see that interpreting disruptiveness in case of P2M is more complex than in sectors where there are numerous potential customers like in the entertainment/media or printing industry. Consequently, instead of focusing on possible number of consumers, in case of P2M, the assessment of disruptiveness should focus on possible plant sizes on different sites and their compared cost–benefit ratio. This is in line with recent P2M-specific research of Böhm et al. [39] who found a growing need for multi-MWelplants, as global demand for electrolysis and also for methanation can far exceed 1000 GWel. Hence, the second research question is (RQ2) what is the largest P2M plant size possible at different types of sites and what sites are preferred for large-scale P2M deployments as possible low-end and high-end segments?
This comparison is relevant also because of the possible public funding deriving from the P2G initiatives of the Hungarian National Energy Strategy 2030 [17,40], which must be dis- tributed to sites with best cost–benefit ratios. This means that capital costs of deployment are also important decision factors besides technical opportunities.
The third research question is based on the theoretical phenomenon of disruptive- ness. Over time, changes in the market environment and further developments of a disruptive technology result in higher performance compared to sustaining technologies.
Therefore, mainstream customers will choose the disruptive solutions over sustaining tech- nologies [38]. Based on these expected changes, regarding the P2M technology, a relevant question is (RQ3) which environmental factors and technological advancements could lead to superior performance compared to other (maybe sustaining) technologies and accelerate the process of P2M implementation? These change aspects dominantly could cover core technology development, complementary technologies, input or output conditions.
Figure1illustrates the research framework which was applied to examine P2M as a potentially disruptive technology and did not fix ex-ante that P2M was a disruptive technology. It means that the research framework has also left space to empirically identify whether the underlying assumption was correct and, if it was, why.
2.2. Research Methodology
In line with the carbon-neutrality strategy of the EU, in Hungary, grid-scale imple- mentation of P2M technology is possible and also promising because of a rapid increase of photovoltaics [41], and a 6,330,000,000 m3 capacity of the natural gas grid suitable for seasonal energy storage [17]. The authors conducted action research in Hungary, at Power-to-Gas Hungary Kft., from 2018 to 2020. The company operates its P2M prototype since 2018 and plans to implement its innovative biomethanation solution in grid-scale.
The action research method, which generally incorporates practical (“social”) actions, the- oretical examinations, iterations between theory and practice (actions and research) to generate change, and new knowledge [42–44], was in this context dominantly technology- and investment-focused. It means that it contained research for potential P2M sites in Hungary, technical data collection from the potential sites, analysis of the maximum plant size, infrastructural conditions and synergies, on-site consultations, collaborative facility- planning with site operators, and interpreting data according to previous studies and the fundamentals of the disruptive theory presented in the Introduction section.
Figure 1. Research framework based on Bower and Christensen’s original model [36]. Research question 1 (RQ1) examines whether there are unique attributes of the P2M compared to other technologies from the aspect of potential technology adopters. Research question 2 (RQ2) focuses on the maximum potential of its (maybe unique) attributes and the environments, where these can be realized with the best cost–benefit ratio. Research question 3 (RQ3) deals with the factors which could accelerate the realization of this maximum P2M potential.
2.3. Focal Solution and Its Main Characteristics
The focal solution of this research is the P2M technology of Power-to-Gas Hungary Kft.
The prototype of the company includes polymer electrolyte membrane (PEM) electrolysis and biological methanation, the main component of which is a patented, robust, and highly efficient microorganism (Methanothermobacter thermautotrophicus) [45]. This archaea strain is capable of converting over 99% of the CO2to methane, resulting in a product gas with methane content above 97% which can be injected into the natural gas grid. The main reactions of the applied P2M process are the following:
n Electrolysis: 4H2O→4H2+2O2+Heat;
n Methanation: CO2+4H2→CH4+2H2O.
Based on the detailed technical description of the three steps of the applied P2M process (electrolysis, methanation, injection) of the Power-to-Gas Hungary Kft. which has been recently published [13], the possible performance aspects of the focal P2M technology and their base data are presented in Table1.
Table 1.P2M performance aspects and related technical data (based on [13]).
Performance Aspect Base Data, Description in Case of a 1 MWelBiomethanation Plant
CO2input Ca. 53 CO2Nm3/h.
CH4production Ca. 52 Nm3/h (ca. 97–98% of the CO2input)
Energy storage No limit, if a connection to the natural gas grid is available H2output (P2H) and input (P2M) Ca. 212 Nm3/h (with regard to the ca. 4:1 or 4.1:1 ratio of H2and CO2)
Electricity consumption Ca. 4.7 kWh / Nm3H2
Starting from the research framework, it is important to analyze what type of elec- trolyzers could provide hydrogen for the methanation step on a large-scale. While solid- oxide electrolysis (SOEL) is under development for commercialization [46], alkaline elec- trolysis (AEL) and polymer electrolyte membrane electrolysis (PEMEL) have been imple- mented in large P2M facilities [14,47,48]. For example, the Audi e-Gas plant has alkaline
electrolyzers (6 MWel), while the STORE&GO demonstration site at Solothurn has PEM electrolyzers (700 kWel) [49]. Regarding the required flexibility because of the volatile renewable electricity production, PEMEL can be started within seconds, while starting AEL may need 1–10 min [50]. Some manufacturers stated, however, that AEL is also capable of rapid reaction and fast warm start [51]. AEL and PEMEL have been implemented in larger sizes until now (e.g., the other two sites of the STORE&GO project in Italy and Germany have 1 and 2 MW AELs [11]).
In the methanation step, two technologies have also been applied on a commercial- scale: the catalytic (chemical) methanation (used e.g., in AUDI e-Gas) and the biological methanation (e.g., Biocat project). While biological methanation applies microorganisms as biocatalysts and needs low pressure and temperature (ca. 60–70◦C), catalytic methanation uses chemical, often nickel- or ruthenium-based catalysts, and sometimes more than 100◦C is needed to reach high CO2conversion [52,53]. Based on Frontera et al. [54], the CO2 conversion rate can be variable (from 50–60% to 80–90% or higher) depending on the type of the chemical catalyst and the temperature. Biological methanation, however, can provide consistency in this sense; at low temperature and low pressure, it could lead to as Table 95%
CO2conversion rate, with high flexibility for pausing, stopping, and restarting methane production [55,56]. The nutrition of the biocatalysts, however, is key in this case [57], while the efficiency of the whole process could be further improved if waste heat could be utilized, which is generally difficult at this lower temperature [58]. Two other solutions are worth mentioning, which are currently in the development phase. First, the bioelectrochemical system for electromethanogenesis (EMG-BES) may need an even lower temperature for the reaction (ca. 25–35 lied on a commercial-scale: the catalytic (chemical) methanation (used e.g., in AUDI e-Gas) and the biological methanation (e.g., Biocat project). While biological methanation applies microorganisms as biocatalysts and needs low pressure and temperature (ca. 60–70◦C) [59]. Second, in the case of biogas plants, novel in-situ biological biogas upgrading (BGU) with hydrogenotrophic methanogens in a mixed culture can be used for methanation by supplementing H2from renewable sources [60].
Disruptiveness of P2M technology would mean large, commercial-scale plants. The focal solution consisting of PEMEL and biological methanation seem applicable for the study. The capital expenditures (CAPEX), however, can be critical, even if state support would be available for the investments. A recent calculation based on the data of the STORE&GO project and additional field research, the CAPEX of a 1 MWelP2M plant using PEMEL and biological methanation would be 4,806,000 EUR in 2025 at a large wastewater treatment plant (WWTP) [13].
2.4. Data Collection and Analysis
The authors collected empirical data from potential sites for P2M implementation to explore:
- sites that may have proper infrastructural, input, and output conditions for a biological methanation plant with a world-leading size (over 1 MWel)
- aspects of consumer evaluation about P2M and competing solutions, if there are any - site-specific factors that would enable the increase of the plant size or the feasibility of
a large P2M plant.
From 2018 to 2020, the authors contacted potential sites, among which there were - agricultural biogas plants (ABPs)
- wastewater treatment plants with biogas plants (WWTPs) - bioethanol plants (BEPs)
- industrial plants (INPs) with CO2 emission (e.g., power generation, petrochemicals, cement plant).
While in case of ABPs, WWTPs, and BEPs, the CO2input for methanation can be provided with an easily and efficiently useable carbon source (the CO2 content of the biogas and pure CO2can be sourced from the exhaust stream of the fermentation during
bioethanol production [61]), in the case of INPs CO2must be captured from flue gas with Carbon Capture (CC) technologies, for example, at a cement plant [62]. Figure2illustrates the input connections of a P2M plant at different sites, showing how CO2can be sourced for the methanation phase.
1
Figure 2.Simplified overview of the P2M process at an INP with carbon capture (orange), at a biogas plant of an agricultural company or a WWTP (green) or at a BEP (navy blue), based on Sinóros-Szabó[63], Laude et al. [61], and Chauvy et al. [62].
The authors collected data from 29 potential sites, which means that at least one personal meeting, teleconference, or online videoconference happened with one or more members of the top management team of the site operator. In these 29 first-round semi- structured interviews at potential sites, the main characteristics of the focal technology were presented to decision-makers, and the infrastructural fit was analyzed on a high-level. After these 29 first-round interviews, second-round semi-structured interviews were focusing on more technical data and included on-site consultations with expert-level operators. This was possible at 14 potential sites based on infrastructural opportunities and availability of the top management.
While the first-round data collection aimed to identify the needs of the potential adopters, the main value-creating attributes of P2M according to these needs and the existence of competing technologies (RQ1), the second-round data collection was aimed to determine the maximum potential of the P2M plant at the focal site and its costs (RQ2), and also to explore the factors of increasing technical and/or financial feasibility of the implementation (RQ3).
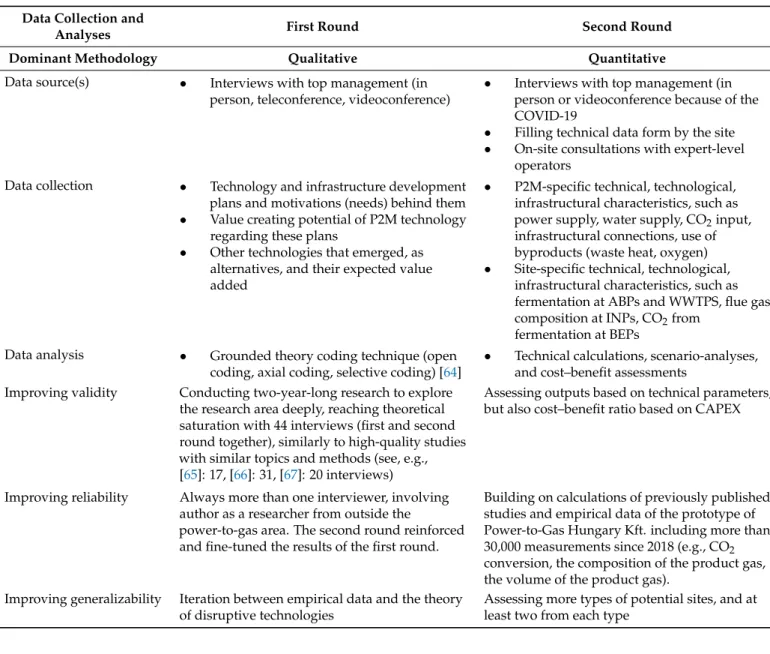
Considering these goals, Table2summarizes the scope and the methods of data collec- tion and analyzes the efforts undertaken to improve validity, reliability, and generalizability both in qualitative and quantitative sense. The calculations are presented in the Results section.
Table 2.Data collection and data analysis of the research Data Collection and
Analyses First Round Second Round
Dominant Methodology Qualitative Quantitative
Data source(s) • Interviews with top management (in person, teleconference, videoconference)
• Interviews with top management (in person or videoconference because of the COVID-19
• Filling technical data form by the site
• On-site consultations with expert-level operators
Data collection • Technology and infrastructure development plans and motivations (needs) behind them
• Value creating potential of P2M technology regarding these plans
• Other technologies that emerged, as alternatives, and their expected value added
• P2M-specific technical, technological, infrastructural characteristics, such as power supply, water supply, CO2input, infrastructural connections, use of byproducts (waste heat, oxygen)
• Site-specific technical, technological, infrastructural characteristics, such as fermentation at ABPs and WWTPS, flue gas composition at INPs, CO2from
fermentation at BEPs Data analysis • Grounded theory coding technique (open
coding, axial coding, selective coding) [64]
• Technical calculations, scenario-analyses, and cost–benefit assessments
Improving validity Conducting two-year-long research to explore the research area deeply, reaching theoretical saturation with 44 interviews (first and second round together), similarly to high-quality studies with similar topics and methods (see, e.g., [65]: 17, [66]: 31, [67]: 20 interviews)
Assessing outputs based on technical parameters, but also cost–benefit ratio based on CAPEX
Improving reliability Always more than one interviewer, involving author as a researcher from outside the
power-to-gas area. The second round reinforced and fine-tuned the results of the first round.
Building on calculations of previously published studies and empirical data of the prototype of Power-to-Gas Hungary Kft. including more than 30,000 measurements since 2018 (e.g., CO2 conversion, the composition of the product gas, the volume of the product gas).
Improving generalizability Iteration between empirical data and the theory of disruptive technologies
Assessing more types of potential sites, and at least two from each type
3. Results
3.1. Mainstream Needs and Emerged Alternative Solutions at Different Sites
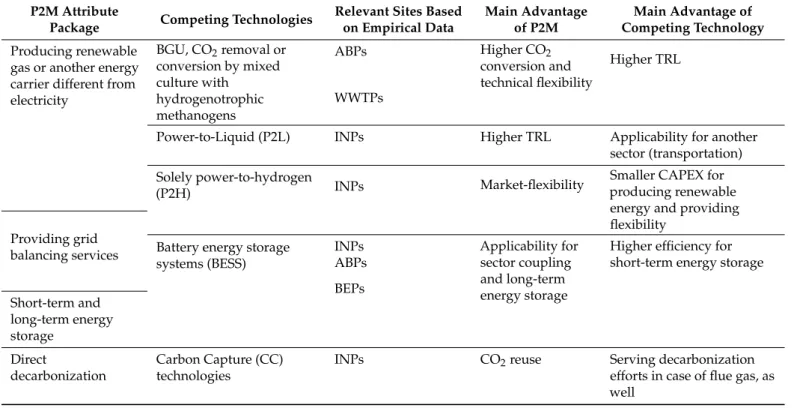
Based on semi-structured interviews with top management teams of different sites, the overall mainstream need is producing and utilizing more renewable energy. While meeting this need, P2M has faced different competing technologies at different sites. Table3 presents the specific opportunities and competing technologies by the identified valuable attributes for potential adopters in producing and utilizing more renewable energy. The table does not contain every possible technology and every aspect of potential competitive advantages of them because it is built on empirical data from the field, the evaluation aspects of the interviewees, but it was iterated with scientific literature:
(1) In case of biogas plants both in an agricultural environment and at WWTPs, BGU can be considered as a competing technology to produce renewable gas (biomethane).
As there were more than 400 facilities with BGU to produce biomethane in 2015 worldwide [68], and even in Hungary there are two [69], one could argue that BGU is a more mature technology than P2M. This higher technology readiness level (TRL) that is associated with lower risks seemed to be an important factor for decision- makers, as prudent risk management appeared as a strategic task, for example in the case of WWTPs [13]. Regarding the other elements of the attribute package, focal
P2M technology with a separate reactor and the patented archaea could have a higher decarbonization effect, as some BGU technologies do not involve CO2conversion (only separation) and even if H2is injected to be reacted with endogenous CO2to produce CH4during in situ biological upgrading, the average CO2removal rate is varying between 43–100%, depending on reactor type and substrate [68]. Furthermore, a clean archaea culture could provide more flexibility for utilizing H2from renewable sources than in situ biological BGU based on the rapid shifts between operation modes of the focal solution based on prototype data of Power-to-Gas Hungary Kft. [13].
(2) In case of industrial companies emitting CO2that could be used with P2M to produce renewable or low-carbon gas depending on the source of input factors [70], power-to- liquid technology (P2L) emerged as an alternative technology. P2L has also a high potential in the future energy sector [71], especially for transportation, but the plan for the first commercial-scale P2L plant is only recently published [72].
(3) The first phase of renewable methane production, power-to-hydrogen (P2H) can be a standalone solution as well. As presented before, the fast warm start of PEMEL or AEL can be useful for providing grid-balancing services for network operators [50,51].
Even though it means that producing renewable energy (gas) and grid-balancing can be achieved with decreased CAPEX, adding the methanation step with a biocatalyst could also provide flexibility, not only in terms of methane production (avoiding the need for the challenging high volume hydrogen storage [73]), but also by assuring market-flexibility. Market-flexibility means here the opportunity to switch between end-products (hydrogen and methane) according to their market demand. From an operational point of view, adding the methanation step and assuring this market flexibility would lead not only to higher CAPEX, but lower energy efficiency for the whole process as well. The reason for that is the additional conversion step (and the energy demand which might be required for CO2capture). Consequently, the value of this market flexibility is highly dependent on the operational context. For example, if (1) hydrogen injection to the natural gas grid remains still strongly limited and/or its local demand is low, but (2) high feed-in-tariffs incite green methane production and/or high carbon taxes incite avoiding carbon emissions, this market-flexibility could add significant value.
(4) Based on the empirical data, if the sites would plan to deploy a large solar park for renewable electricity production, battery energy storage systems (BESS) emerged as a viable option. (In this research, mostly INPs, ABPs, and BEPs have mentioned this option, while some WWTPs stated that they did not have enough free territory to deploy a large solar park.) The main advantages of BESS related to on-site energy storage are the fast response, geographical independence, other energy management functions [74], and also the grid-balancing services [75]. While BESS efficiency for the short-term can be higher than the focal solution’s (55–60%) [13], P2M could provide sector coupling and seasonal energy storage which could be valued or supported by state administration as it appeared as an important goal in the Hungarian National Energy Strategy 2030 [18].
(5) Finally, regarding direct decarbonization, Carbon Capture technologies can be rele- vant. For example, post-combustion capture using wet scrubbing with aqueous amine solutions is commercially advanced [76], but pre-combustion, oxy-fuel combustion and chemical looping combustion are also promising to capture CO2from flue gas [77]
that a P2M solution is not capable solely (in contrast to biogas which also contains CO2and can be injected to the P2M bioreactor). P2M, however, could utilize CO2for renewable energy production.
Table 3.P2M attribute package and alternative technologies based on the evaluation of potential adopters iterated with previous studies.
P2M Attribute
Package Competing Technologies Relevant Sites Based on Empirical Data
Main Advantage of P2M
Main Advantage of Competing Technology Producing renewable
gas or another energy carrier different from electricity
BGU, CO2removal or conversion by mixed culture with
hydrogenotrophic methanogens
ABPs Higher CO2
conversion and technical flexibility
Higher TRL WWTPs
Power-to-Liquid (P2L) INPs Higher TRL Applicability for another
sector (transportation) Solely power-to-hydrogen
(P2H) INPs Market-flexibility Smaller CAPEX for
producing renewable energy and providing flexibility
Providing grid
balancing services Battery energy storage systems (BESS)
INPs Applicability for
sector coupling and long-term energy storage
Higher efficiency for short-term energy storage ABPs
BEPs Short-term and
long-term energy storage
Direct
decarbonization
Carbon Capture (CC) technologies
INPs CO2reuse Serving decarbonization
efforts in case of flue gas, as well
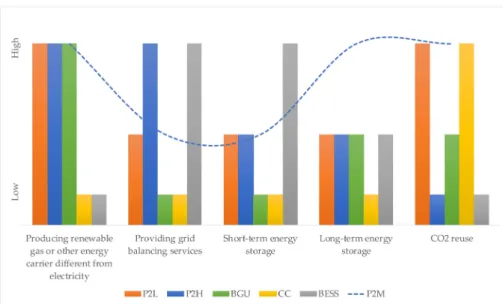
Based on the presented iteration of empirical data and former studies, four main findings can be outlined:
1. There is no other technology that has the same attribute package as P2M (producing renewable energy, providing grid-balancing services, energy storage, and decar- bonization).
2. The most unique attribute in the P2M package is the capability for long-term energy storage with CO2reuse. Renewable gas production is possible with BGU, as well, or P2L is suitable for sector coupling (renewable energy production with transportation), it also assures market flexibility (hydrogen or hydrocarbon fuel production) and direct decarbonization effect, but not with long-term (seasonal) energy storage. In contrast of BGU and P2L, the maturity of P2M is also favorable: the technology is newer than BGU, and it has been implemented in grid-scale, unlike P2L.
3. The least unique attribute of P2M is providing grid-balancing services because P2H and battery energy storage systems are also similarly capable to provide this short- term flexibility.
4. The listed alternative technologies may compete with P2M in one dimension of the value creation, but they can be complementary solutions not only at national energy system-level but also in a given case of a potential technology adopter. For example, battery energy storage and P2M can be combined for short-term and long-term energy storage. Carbon Capture could also provide the main input (CO2) for methanation.
Similarly, P2H is inevitable for P2M if seasonal energy storage is considered (because electrolysis is the first step to absorb surplus renewable electricity), even though they may compete in renewable gas production or grid-balancing.
In summary, based on potential adopter evaluation of P2M and its potential competi- tor technologies, the parallel function of decarbonization and seasonal energy storage is the unique element of the P2M attribute package. It is important to highlight that this uniqueness derives from the absolute capability for decarbonization and energy storage, not from a superior performance, compared to e.g., P2H regarding decarbonization. More- over, this uniqueness is interpreted as a value-creating attribute on a micro-level for a
single technology adopter. This is relevant because different approaches could lead to different results regarding performance evaluations in certain dimensions. For example, Zhang et al. [78] showed that P2M for mobility could result higher GHG emissions than conventional natural gas. This is due to an evaluation that includes a system extension, which also reflects the reduced emissions by CC. Nevertheless, these are meso- or macro- level findings, while this disruption-focused paper is concerned about the aspects of single operators which value that their unwanted CO2can be converted into methane. Finally, it should be mentioned that competitor technologies in one value-creating dimension are rather complementary solutions if we take a holistic view on all value-creating dimensions.
3.2. Potential Sites for Large-Scale P2M Deployment
From the 14 potential sites of the second-round data collection and analysis, the authors identified those sites where the largest P2M plant could be deployed with biological methanation. The potential plant size can be determined based on the CO2input with regard to the stoichiometric ratio of hydrogen and carbon dioxide (4.1:1). Consequently, the maximum electrolyzer capacity (as the indicator of plant size) of a P2M facility is calculated with the presumption of the 4.7 kWh electrical energy demand (see Table1) for the yield of 1 Nm3of hydrogen is 4.7 kWh/Nm [13]3:
PP2Mmax=V·H2·4.7kWh
Nm3 =V·CO2max·4.1·4.7kWh
Nm3 (1)
Equation (1) shows that the maximum size of the P2M plant (PP2Mmax) can be estimated based on the electrical energy demand (4.7 kWh/Nm3) and hydrogen gas volumetric flow (Nm3/h) (V.H2)that is calculated by multiplying the maximum CO2input (Nm3/h) (V.)CO2maxwith its stoichiometric ratio to hydrogen (4.1).
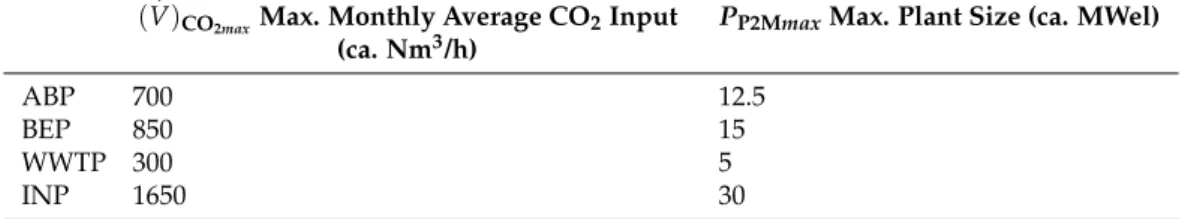
Table4shows the largest possible plants by site type based on empirical data collection and the presented equation based on the characteristics of the focal technology. Because of practical reasons, the calculation considered the autonomous development plans of the sites for the next 2–3 years. For example, a biogas plant planned to expand its biogas producing capacities that would result in higher possible P2M plant size.
Table 4.Largest possible P2M plants by site type based on empirical data collection (with rounding because of confidentiality).
(V.)CO2maxMax. Monthly Average CO2Input (ca. Nm3/h)
PP2MmaxMax. Plant Size (ca. MWel)
ABP 700 12.5
BEP 850 15
WWTP 300 5
INP 1650 30
Based on these empirical data and theoretical calculations, the largest P2M plant could be deployed at INPs. Two additional factors, however, should be considered:
1. First, some seasonality could be seen on yearly data of CO2production. At certain sites, CO2input can be 30–50% lower in certain months than the maximum monthly average. For example, in case of some WWTPs and ABPs, the beginning and the end of the year has lower volumes of biogas production; consequently, there is less CO2available to be converted into methane. This phenomenon may lead to a need for balancing renewable energy gas production (and seasonal energy storage) and decarbonization: while from the decarbonization aspect, it would be important to convert as much CO2to methane as possible, seasonality in CO2emissions limits the financial attractiveness of scaling the plant size up to the maximum emission level.
2. Second, in case of ABPs, BEPs, and WWTPs, CO2is available for efficient use within the P2M plant, but in case of INPs (where the largest P2M plants could be deployed),
there is need for carbon capture (CC) technologies as well, in order to separate CO2 from the flue gas. CC would increase technical complexity, capital, and operational expenditures as well.
3.3. Performance Potential of Large-Scale P2M Plants at Different Sites
Based on these empirical findings, cost–benefit ratios of P2M plants have been assessed according to decarbonization and renewable gas production (as a prerequisite to long-term, seasonal energy storage) at the largest possible plant size, based on the CO2source. Even though the deployment of such large P2M plants may not be financially attractive for a single technology adopter, following the decarbonization efforts, it is worth examining what is the performance potential at different sites regarding not only the methane production but the CO2reuse. As mentioned in the Introduction section, these comparisons may orient public funding decisions to facilitate decarbonization and seasonal energy storage [13,41].
As P2M deployment requires significant investments, the socio-economic value creation at these sites may influence the location, the number and the size of P2M plants that will be deployed. From a disruptive point of view, these comparisons can outline low-end and high-end segments of the P2M technology.
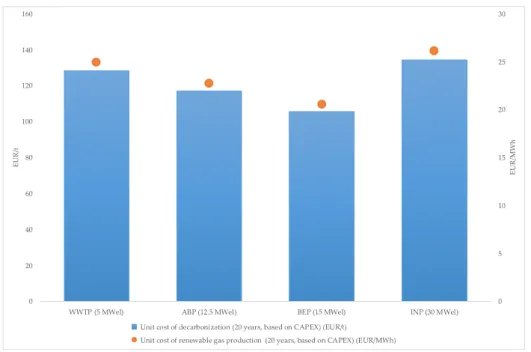
Figure3shows the unit cost of CO2reuse by CAPEX at different sites with the largest possible P2M plant size. In line with the origins of the disruptive theory, the model focuses on the factors that can be affected by technology developers (companies), which means that the important, but hardly predictable regulatory-related interventions (e.g., carbon tax) are out of scope. The unit cost is calculated based on the following factors:
• CAPEX of the P2M plant is based on a recent study by Böhm et al. [40], which focuses on future large-scale P2G technology implementations and takes into account the scaling effects as well. Accordingly, cost reductions due to scaling up differ by site types. Current calculations are predictions for 2025 based on the data of 2020 and estimations for 2030 of Böhm et al. AppendixApresents the basis of CAPEX calculations.
• In case of INP, CC technologies would mean additional costs. It was predicted at ca.
40 EUR/tCO2(49 USD/tCO2) for 2025 by Fan et al. [79].
• CO2conversion and CH4production has been determined based on the prototype data of the Power-to-Gas Hungary Kft with the focal technology. In line with a former study [13], the 1 MWelbase case would mean the conversion of 848 tCO2and 4.363 MWh CH4yearly.
• The ratio of CAPEX and the converted CO2and the produced CH4is calculated for 20 year-long operations of the plant, with 8000 h operations per year. Detailed data can be seen in AppendixA.
Figure3shows that P2M is capable of the best performance at a BEP with 15 MWel
P2M potential regarding decarbonization and renewable gas production, due to the scaling effects and the efficiently useable carbon source (no need for CC), and the worst in case of INP where the cost of CC weakens the cost–benefit ratio more than scaling effects improve it.
Nevertheless, as previously mentioned, the uniqueness of P2M derives from the capability to provide seasonal energy storage and sector coupling with parallel decarbonization.
Consequently, it is important whether infrastructural connections to the natural gas grid are available at (1) these site types and (2) the sites where the largest P2M plants could be deployed. Results showed that, while WWTPs (where smaller plants could be deployed), mostly have a nearby connection to the natural gas grid, this is less frequent in the case of ABPs and BEPs in Hungary. For example, at a BEP with the largest P2M potential, the nearest connection point is 5 km away, while at a ABP with the largest P2M potential, it is 10 km away, where the produced biomethane could be injected into the natural gas grid. Building these missing infrastructural connections would significantly decrease the financial feasibility of P2M seasonal energy storage. If CC technologies would be available at INPs, connection points to the natural gas grid would be more favorable. Consequently,
CC technology associated costs could be an accelerating factor for seasonal energy storage and decarbonization by large-scale P2M plants.
Energies 2021, 14, x FOR PEER REVIEW 12 of 23
Figure 3. Unit capital cost of decarbonization and renewable gas production (as a prerequisite of seasonal energy storage) of large-scale P2M plants at different sites during their operation (2025–2045).
Figure 3 shows that P2M is capable of the best performance at a BEP with 15 MWel
P2M potential regarding decarbonization and renewable gas production, due to the scal- ing effects and the efficiently useable carbon source (no need for CC), and the worst in case of INP where the cost of CC weakens the cost–benefit ratio more than scaling effects improve it. Nevertheless, as previously mentioned, the uniqueness of P2M derives from the capability to provide seasonal energy storage and sector coupling with parallel decar- bonization. Consequently, it is important whether infrastructural connections to the nat- ural gas grid are available at (1) these site types and (2) the sites where the largest P2M plants could be deployed. Results showed that, while WWTPs (where smaller plants could be deployed), mostly have a nearby connection to the natural gas grid, this is less frequent in the case of ABPs and BEPs in Hungary. For example, at a BEP with the largest P2M potential, the nearest connection point is 5 km away, while at a ABP with the largest P2M potential, it is 10 km away, where the produced biomethane could be injected into the natural gas grid. Building these missing infrastructural connections would signifi- cantly decrease the financial feasibility of P2M seasonal energy storage. If CC technologies would be available at INPs, connection points to the natural gas grid would be more fa- vorable. Consequently, CC technology associated costs could be an accelerating factor for seasonal energy storage and decarbonization by large-scale P2M plants.
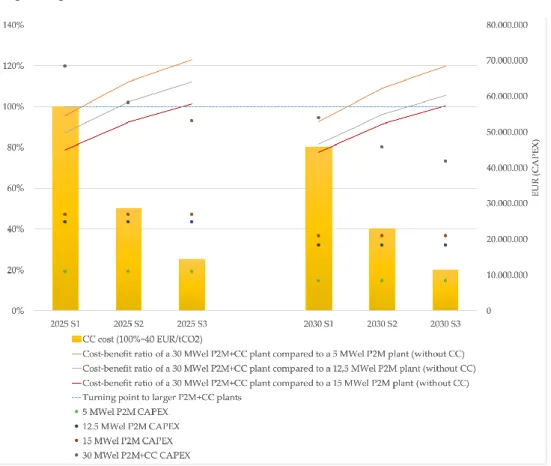
3.4. Scenarios for 2025 and 2030 Regarding Carbon Capture Cost Reduction
To examine how forecasted CC cost reductions might increase the cost–benefit ratio of large-scale P2M deployments at INPs compared to ABPs or BEPs, 3-3 scenarios have been built for 2025 and 2030. Moreover, further scenarios have been built on the prediction of the P2M CAPEX following Böhm et al. [40] (see Appendix A). Scenarios S1–S3 are dif- fering regarding CC costs as well (Table 5), which were estimated by
• following Fan et al. [79] for the 2025 and 2030 values (S1, ca. 40 EUR/tCO2 in 2025, indicated as 100%; ca. 32 EUR/tCO2 in 2030);
Commented [M619]: Please replace commas with points in decimal numbers in figure.
Commented [OU20R19]: We replaced the picture.
There was no reason to show decimal numbers (zeros).
Figure 3. Unit capital cost of decarbonization and renewable gas production (as a prerequisite of seasonal energy storage) of large-scale P2M plants at different sites during their operation (2025–2045).
3.4. Scenarios for 2025 and 2030 Regarding Carbon Capture Cost Reduction
To examine how forecasted CC cost reductions might increase the cost–benefit ratio of large-scale P2M deployments at INPs compared to ABPs or BEPs, 3-3 scenarios have been built for 2025 and 2030. Moreover, further scenarios have been built on the prediction of the P2M CAPEX following Böhm et al. [40] (see AppendixA). Scenarios S1–S3 are differing regarding CC costs as well (Table5), which were estimated by
• following Fan et al. [79] for the 2025 and 2030 values (S1, ca. 40 EUR/tCO2in 2025, indicated as 100%; ca. 32 EUR/tCO2in 2030);
• following Wilberforce et al. [80] showing that CC costs can be around 25 USD/tCO2 mainly at integrated gasification combined cycle (IGCC) and pulverized coal (PC) plants, but also at natural gas combined cycle (NGCC) plants. This is a more optimistic scenario with its 50% reduction (S2), meaning 20 EUR/tCO2in 2025 and 16 EUR/tCO2
in 2030;
• generating an own scenario to identify the CC cost level which could trigger decision- makers to choose industrial sites with the necessity of CC to deploy a large-scale P2M plant there (S3). For this, another 50% cost reduction is determined.
Table 5.Scenarios based on different carbon capture cost-levels for 2025 and 2030.
CC Cost Cost Reductions by
Scenario 2025 2030 Source
Scenario 1 (S1) - 40 EUR/tCO2 32 EUR/tCO2 based on Fan et al. [79]
Scenario 2 (S2) −50% 20 EUR/tCO2 16 EUR/tCO2 based on Wilberforce et al. [80]
Scenario 3 (S3) −50% 10 EUR/tCO2 8 EUR/tCO2 Own estimation
Figure4shows how site preference would change if CC costs would fall by 50% twice.
In case of the lines which indicate the cost–benefit ratios of different comparisons, 100%
means the performance of the ABP/BEP/WWTP regarding the unit costs presented in the previous chapter and their value in 2030. If the unit cost of decarbonization and seasonal energy storage is lower in the case of 30 MWelP2M+CC configuration at an INP than the
value of 5/12.5/5 MWelP2M configurations at a(n) ABP/BEP/WWTP, it means that the cost–benefit ratio of P2M+CC is higher than theirs, so the indicating line goes beyond 100%.
Regarding CC costs, 100% means 40 EUR/tCO2in line with Table5.
1
Figure 4.The role of carbon capture costs in choosing certain sites and plant sizes for decarbonization and renewable gas production with P2M.
Findings suggest that the cost–benefit ratio of 30 MWelINPs would be better regarding renewable gas production, seasonal energy storage, and decarbonization at CC costs 20–30 EUR/tCO2or lower than 5–15 MWelP2M facilities at ABPs or BEPs even if they would have a connection to the natural gas grid in 2025. Nevertheless, due to the estimated cost reductions of P2M CAPEX for 2030, a 12.5 MWel P2M plant would have a better cost–benefit ratio at 16 EUR/tCO2CC cost than a 30 MWelP2M + CC configuration plant.
Assuming that the main goal is seasonal energy storage and the connection to the grid is not an obstacle, 15 MWelor larger P2M facilities at ABPs or BEPs would be competitive with P2M facilities at INPs for decarbonization and seasonal energy storage (renewable gas production and injecting it into the grid) even if costs of CC would radically decrease.
In addition, it is important to highlight that, as CC cost would start to decrease from 40 EUR/tCO2, a 30 MWelP2M + CC plant would outperform 5MWel or smaller P2M plants based on the unit capital costs of decarbonization and renewable gas production.
4. Discussion
RQ1 was focusing on key attributes of P2M for potential technology adopters and their evaluation compared to other technologies. According to the literature, disruptive technologies create value with a different attribute package than sustaining technologies, and initially do not meet the mainstream needs. To justify this assumption for P2M, it must be identified whether there are sustaining and disruptive technologies in this market segment at all. As sustaining technologies mean continuous incremental improvements in satisfying mainstream needs, it assumes technologies with widespread utilization and high TRL. Regarding the identified mainstream needs of potential P2M adopters (producing and utilizing more renewable energy) and the recent literature about the identified alternative
technologies, mainly BGU and BESS could be considered as sustaining technologies. In the case of BGU and BESS, frequent use and relatively high TRL can be seen [81,82] for renew- able energy production and utilization, but there are also novel ways for BGU (TRL3-7) [83]
and there are also efforts to optimize and develop the efficiency of batteries [84], which may indicate incremental developments. In contrast, P2H, CC, and P2L are rather in the demonstration phase or less frequently used. In the case of P2H, while low-temperature electrolyzers are at TRL9 (readiness for full-scale implementation), high-temperature elec- trolysis processes are at TRL6-8 [85]. A recent study, however, pointed out that “the scale of P2H pilots is very small” ([86], p. 1369), and these are demonstration projects, even if one reaches 100 MW (Hybridge). Regarding CC, there are several technologies from TRL2-3, (such as oxygen transport membranes which integrate O2separation and combustion) to TRL8-9 (e.g., the commercial CO2capture plant in Canada, the Boundary Dam project) [87].
Finally, as there are only plans for P2L facilities on commercial-scale [72] and the P2L technology is rather in demonstration phase with TRL-5-6 [88], P2L cannot be considered as a sustaining technology.
Based on the above, one could argue that P2M can be disruptive against BGU and BESS. This statement can be justified based on the P2M unique attribute package (producing renewable energy, providing grid-balancing services, energy storage, and decarbonization), which is different from BGU and BESS. While BGU is less flexible to provide grid-balancing, BESS does not produce renewable energy. However, it can be also seen that the initial performance of the P2M is inferior compared to them. For example, the capital costs of traditional BGU technologies can be lower, where there is no need for electrolyzers to generate hydrogen [89]. Furthermore, Lithium-Ion Batteries (LIBs) can provide 95–98% ef- ficiency [90]. Assuming that the mainstream market need naturally integrates cost-efficient renewable gas production and high-efficiency energy storage (on the short-term) at ABPs, BEPs, WWTPs, or INPs, P2M has the disruption potential because of this inferiority. Never- theless, according to the theory, this inferiority of P2M will turn into superior performance later due to the fit of the unique attribute package and environmental changes. Regard- ing the growing share of renewables in the energy mix, the volatile production may go beyond the capacities of BESSs, and long-term, high volume, seasonal energy storage will be needed. The incitement of this may result in better business opportunities (e.g., high biomethane feed-in-tariff) due to state interventions [18]. This would justify the invest- ments into more CAPEX intensive projects with P2H and P2M (compared to traditional BGU) or expanding the battery-dominated energy storage systems with P2M to realize profits from low priced surplus electricity. As the empirical research pointed out based on RQ2, really large P2M plants which could impact the sector intensely can be deployed at INPs (in Hungary). Results also showed that these large P2M plants with CC can have a better cost–benefit ratio than smaller P2M plants at ABPs or BEPs if CC costs would decrease significantly. If one considers that P2M at INPs are not only relevant by their size but by the commissioned number of them, and emitted CO2(energy supply and industry together was responsible for 48.3% of the greenhouse gas emission, agriculture for only 11.3% in Europe in 2014 [91]), CO2reuse with parallel energy storage of P2M at INPs can lead to disruption, but only if CC costs would radically fall. If INPs can be the high-end market for P2M, this is because of the better cost–benefit ratio, the higher potential of a single P2M plant size, and the higher number of possible plants (market potential). In contrast, WWTPs, ABPs, and BEPs representing the low-end segment of the market can be more suitable for P2M implementations in grid-scale. Nevertheless, the applicability of the revised theory about disruptive innovation (not technology) by Christensen et al. [38]
is limited in this study, as incumbents (established large companies with sustaining tech- nologies) who may overlook the low-end segment and will be challenged by disruption were not identified. Probably, this is because of the relatively new market generated by sustainability efforts.
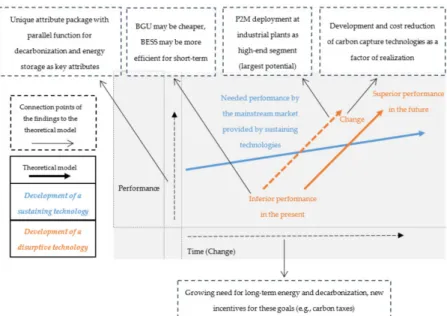
Figure5summarizes these findings aligned with the research framework. The answers to the research questions are the following:
RQ1: What are the key attributes of P2M for potential technology adopters and how can they be evaluated compared to other (maybe sustaining) technologies? The key attributes of P2M are (1) producing renewable gas or another energy carrier different from electricity, (2) providing grid balancing services, (3) short-term and long-term energy storage, and (4) direct decarbonization. This attribute package is unique with a parallel function for decarbonization and energy storage.
RQ2: What is the largest P2M plant size possible at different types of sites and what sites are preferred for large-scale P2M deployments as possible low-end and high-end segments? Based on the empirical data collection and analysis, the largest possible P2M plant size was identified at an INP (30 MWel), which would need CC solutions as well. Because of the larger P2M potential, INPs are the high-end segments for P2M;
ABPs, BEPs, and WWTPs are the low-end segments (with lower P2M potential, but without CC).
RQ2: Which environmental factors and technological advancements could lead to superior performance compared to other (maybe sustaining) technologies and accel- erate the process of P2M implementation? A significant decrease of CC costs could enable the disruption potential of the P2M technology in the future, along with further growth of renewable energy production, decarbonization incentives, and significant support of the regulatory environment (e.g., on the regulatory side, the volume of carbon taxes which can be as much important as CC costs).
Figure 5.The disruption potential of P2M technology (main conclusions aligned with the research framework).
In summary, due to its unique attribute package, the P2M technology today is rather a value innovation [92], and a potentially disruptive technology of the future. Figure6shows the unique attribute package of P2M as a value curve indicating the value innovation.
The identified unique attributes of P2M (the parallel CO2reuse and the energy storage potential) are in line with former micro-level achievements and energy evaluations as well.
For example, Castellani et al. [93] found that methane production has a higher energy storage capability than methanol production, which can be the basis of the P2L process.
Figure 6.P2M attribute package as a new value curve (relative values).
P2M and CC together could become disruptive in the future as CC costs would decrease and volatile renewable energy production and decarbonization pressure would increase further. Regarding CC technologies, oxy-combustion is seen as a promising and cost-effective method in the literature [94], but regarding the oxygen by-product of the electrolysis in the P2M process, it could lead to even more synergies in theory, which could be re-used in the oxy-fuel CC process.
Finally, two other points should be highlighted based on the empirical results. First, in contrast to underlying assumptions, no “competition” between catalytic or biological methanation, nor between AEL or PEMEL, was relevant from a disruptive point of view.
Second, findings suggest that P2H, P2M, and P2L, and even BESS, can be parts of an integrated energy system at a large industrial company, providing short-term and long- term energy storage, renewable energy production with market-flexibility (hydrogen, methane or hydrocarbon fuel), and capability for grid-balancing.
5. Conclusions
The starting point of this study was that P2M could be considered a disruptive technology because of its predicted future impact on the energy sector, and the new opportunities and new challenges it generates. The disruptiveness of the technology, however, hasn’t been assessed yet. The working hypothesis of the study was that P2M could become disruptive. This can be accepted based on the results. Using hybrid (quantitative and qualitative) methodology, it was concluded that P2M currently is rather a value innovation due to its unique attribute package, the combined seasonal energy storage and direct decarbonization function. Besides that, it was demonstrated that P2M has the potential of becoming a disruptive technology if associated with CC technologies, and if the current CAPEX volumes related to this technology would decrease significantly. It was also presumed that renewable energy generation would continue to grow because the largest P2M potential can be identified at those industrial plants where CO2should be captured from flue gas. This conclusion has another practical contribution as well, by highlighting that CC technology developments should get a higher priority to completely exploit the disruption potential of the P2M technology. From a practical point of view, findings suggest that agricultural biogas plants and bioethanol plants with efficiently usable carbon sources, as well as industrial sites with carbon capture solutions, could be equally suitable from the aspect of CO2input for building the largest P2M plant worldwide, which could also be located in Hungary (over 6 MWel). For seasonal energy storage, however, agricultural biogas plants and bioethanol plants are not as promising as formerly presented large wastewater treatment plants [13], while, in the case of industrial adopters, the costs of
carbon capture decrease the economic attractiveness currently, which may change over time.
Nevertheless, some technological possibilities or alternatives might not have emerged because of the research framework. For example, while P2L was relevant for opening new market opportunities in the transportation sector, solutions for CNG or LNG production are one step ahead after P2M in the value chain. The combination of the P2M process and LNG production [95] would be, however, the competitor of P2L in the transforming transportation sector. Accordingly, future research could focus on the techno-economic comparisons of P2L and P2M + LNG. Another limitation of the study is that cost–benefit ratios were determined based on CAPEX, but hardly predictable operational expenses and revenue streams can accelerate or decelerate the possible disruption process of P2M.
For example, the avoided carbon taxes could influence the unit costs of decarbonization at INPs, or the effects of other regulatory interventions (e.g., feed-in-tariffs, electricity prices) could be researched from this aspect, as well. Furthermore, the background of mainstream consumer needs could also be explored deeper. Finally, analyzing the synergies of oxy-combustion and P2H/P2M process could be a relevant topic in relation to increasing the market attractiveness of seasonal energy storage and decarbonization for multiple stakeholders, which this research also focused on.
Author Contributions:Conceptualization, G.P., Z.C., and M.Z.; methodology, M.Z.; validation, G.P.
and Z.C., formal analysis, Z.C. and M.Z.; investigation, G.P., Z.C., and M.Z.; data curation, M.Z.;
writing—original draft preparation, G.P. and M.Z.; writing—review and editing, Z.C.; visualiza- tion, M.Z.; supervision, Z.C.; project administration, Z.C. All authors have read and agreed to the published version of the manuscript.
Funding:This research received no external funding.
Acknowledgments:The authors would like to thank Hiventures Zrt./State Fund for Research and Development and Innovation for their investment that enabled this research.
Conflicts of Interest:The authors declare no conflict of interest.
Appendix A
CAPEX estimation of large-scale P2M plants with biological methanation for 2025:
kWel 5000 12,500 15,000 30,000 Source
2025
Electrolyzer system (PEMEC) (thEUR/kWel)
0,90 0.85 0.80 0.75 [40]
Methanation system (biological) (thEUR/kWel)
0.35 0.30 0.25 0.2 [40]
Infrastructure, installation, storage for gas puffer (H2, CO2), injection (thEUR/kWel)
0.45 0.40 0.35 0.30 ca. 20% of CAPEX
([55], p. 34) Project development, planning,
expert services, quality management (+ %)
28% 28% 28% 28% ([55], p. 34)
2030
Electrolyzer system (PEMEC) (thEUR/kWel)
0.90 0.85 0.80 0.75 [40]
Methanation system (biological) (thEUR/kWel)
0.35 0.30 0.25 0.2 [40]
Infrastructure, installation, storage for gas puffer (H2, CO2), injection (thEUR/kWel)
0.45 0.40 0.35 0.30 ca. 20% of CAPEX
([55], p. 34]
Project development, planning, expert services, quality management (+ %)
28% 28% 28% 28% ([55], p. 34)
Appendix B
Detailed data of large-scale P2M plants with 8000 h/year operation:
WWTP ABP BEP INP
Size (MWel) 5 12.5 15 30
Converted CO2/year (tons) 4240 10,600 12,720 25,440
Produced CH4/year (MWh) 21,815 54,538 65,445 130,890
Converted CO2/ 20 years (tons) 84,800 212,000 254,400 508,800
Produced CH4/ 20 years (MWh) 436,300 1,090,750 1,308,900 2,617,800
P2M CAPEX (EUR, prediction for 2025) 10,880,000 24,800 000 26,880,000 48,000,000
Cost of carbon capture (20 years) (EUR) - - - 20,352,000
Unit cost of decarbonization (20 years) (EUR/t) 128 117 106 134
Unit cost of renewable gas production (20 years) (EUR/MWh) 25 23 21 26
Abbreviations
ABP Agricultural biogas plant AEL Alkaline electrolysis BEP Bioethanol plant
BESS Battery energy storage systems BGU Biogas upgrading
CAPEX Capital expenditures
CC Carbon capture
CHP Combined heat and power (unit) CNG Compressed natural gas
EMG-BES Bioelectrochemical system for electromethanogenesis IGCC Integrated gasification combined cycle
INP Industrial plant LIB Lithium-ion battery LNG Liquified natural gas NGCC Natural gas combined cycle
P2G Power-to-Gas
P2H Power-to-Hydrogen P2L Power-to-Liquid
P2M Power-to-Methane
PC Pulverized coal
PEMEL Polymer electrolyte membrane electrolysis SOEL Solid-oxide electrolysis
TRL Technological readiness level WWTP Wastewater treatment plant References
1. Lund, H.; Østergaard, P.A.; Connolly, D.; Ridjan, I.; Mathiesen, B.V.; Hvelplund, F.; Thellufsen, J.Z.; Sorknæs, P. Energy Storage and Smart Energy Systems.Int. J. Sustain. Energy Plan. Manag.2016,11, 3–14. [CrossRef]
2. Ergüden, E.; Çatlioglu, E. Sustainability Reporting Practiceses In Energy Companies With Topsis Method.J. Account. Financ.2016, 71, 201–221.
3. Bollino, C.A.; Madlener, R. Foreword to the Special Issue on High Shares of Renewable Energy Sources and Electricity Market Reform.Energy J.2016,37, 1–4. [CrossRef]
4. Adil, A.M.; Ko, Y. Socio-technical evolution of Decentralized Energy Systems: A critical review and implications for urban planning and policy.Renew. Sustain. Energy Rev.2016,57, 1025–1037. [CrossRef]
5. Alagoz, B.B.; Kaygusuz, A. Dynamic energy pricing by closed-loop fractional-order PI control system and energy balancing in smart grid energy markets.Trans. Inst. Meas. Control2016,38, 565–578. [CrossRef]
6. Costa-Campi, M.; Duch-Brown, N.; García-Quevedo, J. R & D drivers and obstacles to innovation in the energy industry.Energy Econ.2014,46, 20–30. [CrossRef]
7. European Commission.Report From The Commission To The European Parliament, The Council, The European Economic And Social Committee And The Committee Of The Regions. Renewable Energy Progress Report; European Commission: Brussels, Belgium, 2020.
8. European Commission.European Climate Pact—Communication From The Commission To The European Parliament, The Council, The European Economic And Social Committee And The Committee Of The Regions; European Commission: Brussels, Belgium, 2020.
9. Pintér, G. The Potential Role of Power-to-Gas Technology Connected to Photovoltaic Power Plants in the Visegrad Countries—A Case Study.Energies2020,13, 6408. [CrossRef]
10. Götz, M.; Lefebvre, J.; Mörs, F.; Koch, A.M.; Graf, F.; Bajohr, S.; Reimert, R.; Kolb, T. Renewable Power-to-Gas: A technological and economic review.Renew. Energy2016,85, 1371–1390. [CrossRef]
11. STORE&GO. The STORE&GO Demonstration Sites. Available online: https://www.storeandgo.info/demonstration-sites (accessed on 11 February 2021).
12. Bailera, M.; Lisbona, P.; Romeo, L.M.; Espatolero, S. Power to Gas projects review: Lab, pilot and demo plants for storing renewable energy and CO2.Renew. Sustain. Energy Rev.2017,69, 292–312. [CrossRef]
13. Guilera, J.; Morante, J.R.; Andreu, T. Economic viability of SNG production from power and CO2.Energy Convers. Manag.2018, 162, 218–224. [CrossRef]
14. Peters, R.; Baltruweit, M.; Grube, T.; Samsun, R.C.; Stolten, D. A techno economic analysis of the power to gas route.J. CO2 Util.
2019,34, 616–634. [CrossRef]
15. European Commission. Study on Energy Storage—Contribution to the Security of the Electricity Supply in Europe; European Commission: Brussels, Belgium, 2020.
16. Csed˝o, Z.; Zavarkó, M. The role of inter-organizational innovation networks as change drivers in commercialization of disruptive technologies: The case of power-to-gas.Int. J. Sustain. Energy Plan. Manag.2020,28, 53–70. [CrossRef]
17. Csed˝o, Z.; Sinóros-Szabó, B.; Zavarkó, M. Seasonal Energy Storage Potential Assessment of WWTPs with Power-to-Methane Technology.Energies2020,13, 4973. [CrossRef]
18. Cantwell, J. Innovation and competitiveness. InThe Oxford Handbook of Innovation; Fagerber, J., Mowery, D.C., Nelson, R.R., Eds.;
Oxford University Press: New York, NY, USA, 2005; pp. 543–567.
19. Feurer, R.; Chaharbaghi, K. Defining Competitiveness: A Holistic Approach.Manag. Decis.1994,32, 49–58. [CrossRef]
20. Schwab, K.The Global Competitiveness Report 2019; World Economic Forum: Geneva, Switzerland, 2019.
21. Almutairi, J.; Aldossary, M. Modeling and Analyzing Offloading Strategies of IoT Applications over Edge Computing; Joint Clouds.Symmetry2021,13, 402. [CrossRef]
22. Diener, F.; Špaˇcek, M. Digital Transformation in Banking: A Managerial Perspective on Barriers to Change.Sustainability2021,13, 2032. [CrossRef]
23. Lekan, A.; Clinton, A.; Owolabi, J. The Disruptive Adaptations of Construction 4.0 and Industry 4.0 as a Pathway to a Sustainable Innovation and Inclusive Industrial Technological Development.Buildings2021,11, 79. [CrossRef]
24. Servi, M.; Zulli, A.; Volpe, Y.; Furferi, R.; Puggelli, L.; Messineo, A.; Ghionzoli, M.; Facchini, F. Handheld Optical System for Pectus Excavatum Assessment.Appl. Sci.2021,11, 1726. [CrossRef]
25. Ullah, N.; Al-Rahmi, W.; Alzahrani, A.; Alfarraj, O.; Alblehai, F. Blockchain Technology Adoption in Smart Learning Environments.
Sustainability2021,13, 1801. [CrossRef]
26. Santamaria, B.M.; Gonzalo, F.A.; Aguirregabiria, B.; Ramos, J.H. Evaluation of Thermal Comfort and Energy Consumption of Water Flow Glazing as a Radiant Heating and Cooling System: A Case Study of an Office Space.Sustainability2020,12, 7596.
[CrossRef]
27. Radu, L.-D. Disruptive Technologies in Smart Cities: A Survey on Current Trends and Challenges. Smart Cities2020,3, 51.
[CrossRef]
28. Yigitcanlar, T.; DeSouza, K.C.; Butler, L.; Roozkhosh, F. Contributions and Risks of Artificial Intelligence (AI) in Building Smarter Cities: Insights from a Systematic Review of the Literature.Energies2020,13, 1473. [CrossRef]
29. Enescu, F.M.; Bizon, N.; Onu, A.; Răboacă, M.S.; Thounthong, P.; Mazare, A.G.; S,erban, G. Implementing Blockchain Technology in Irrigation Systems That Integrate Photovoltaic Energy Generation Systems.Sustainability2020,12, 1540. [CrossRef]
30. Ullah, N.; Alnumay, W.S.; Al-Rahmi, W.M.; Alzahrani, A.I.; Al-Samarraie, H. Modeling Cost Saving and Innovativeness for Blockchain Technology Adoption by Energy Management.Energies2020,13, 4783. [CrossRef]
31. Zeng, Y.; Dong, P.; Shi, Y.; Li, Y. On the Disruptive Innovation Strategy of Renewable Energy Technology Diffusion: An Agent-Based Model.Energies2018,11, 3217. [CrossRef]
32. Müller, J.M.; Kunderer, R. Ex-Ante Prediction of Disruptive Innovation: The Case of Battery Technologies.Sustainability2019,11, 5229. [CrossRef]
33. Schiebahn, S.; Grube, T.; Robinius, M.; Tietze, V.; Kumar, B.; Stolten, D. Power to gas: Technological overview, systems analysis and economic assessment for a case study in Germany.Int. J. Hydrog. Energy2015,40, 4285–4294. [CrossRef]
34. Schäfer, M.; Gretzschel, O.; Steinmetz, H. The Possible Roles of Wastewater Treatment Plants in Sector Coupling.Energies2020, 13, 2088. [CrossRef]
35. Breyer, C.; Tsupari, E.; Tikka, V.; Vainikka, P. Power-to-Gas as an Emerging Profitable Business Through Creating an Integrated Value Chain.Energy Procedia2015,73, 182–189. [CrossRef]
36. Bower, J.L.; Christensen, C.M. Disruptive technologies: Catching the wave.Harvard Business Review, 19 February 1995, 43–53.
37. Christensen, C.M.; Raynor, M.E.; McDonald, R. What is disruptive innovation?Harvard Business Review, 20 December 2015, 44–53.
38. Govindarajan, V.; Kopalle, P.K. Disruptiveness of innovations: Measurement and an assessment of reliability and validity.Strateg.
Manag. J.2006,27, 189–199. [CrossRef]
39. Böhm, H.; Zauner, A.; Rosenfeld, D.C.; Tichler, R. Projecting cost development for future large-scale power-to-gas implementations by scaling effects.Appl. Energy2020,264, 114780. [CrossRef]
![Figure 1. Research framework based on Bower and Christensen’s original model [36]. Research question 1 (RQ1) examines whether there are unique attributes of the P2M compared to other technologies from the aspect of potential technology adopters](https://thumb-eu.123doks.com/thumbv2/9dokorg/900841.50114/4.892.260.786.147.477/research-framework-christensen-research-attributes-technologies-potential-technology.webp)
![Figure 2. Simplified overview of the P2M process at an INP with carbon capture (orange), at a biogas plant of an agricultural company or a WWTP (green) or at a BEP (navy blue), based on Sinóros-Szabó [63], Laude et al](https://thumb-eu.123doks.com/thumbv2/9dokorg/900841.50114/6.892.97.795.229.622/figure-simplified-overview-process-capture-agricultural-company-sinóros.webp)