THE IMPACTS OF EU ACCESSION ON THE AGRICULTURE OF THE VISEGRAD COUNTRIES
1CSABA CSAKI1 – ATTILA JAMBOR2
1 Professor Emeritus, Corvinus University of Budapest Email: csaba.csaki@uni-corvinus.hu
2 Assistant Professor, Corvinus University of Budapest Email: attila.jambor@uni-corvinus.hu
The Visegrad Countries (VC)2 joined the European Union in 2004, which has offered several possibilities and challenges for their agriculture. The aim of the paper is to evaluate the status of the sector in the light of latest available data as well as to identify the factors lying behind different country performances. Results suggest that EU accession has had a diverse impact on the Visegrad Countries’ agriculture and member states capitalised their possibilities in a different manner, due to initial conditions and pre- and post-accession policies.
Key words: EU accession, Visegrad Countries, agriculture JEL code: Q18
1. INTRODUCTION
Twelve New Member States (NMS, including the Visegrad Countries: VC) joined the European Union in 2004 and 2007, causing several changes in the field of agriculture. Many books around the Millennium have quantitatively estimated the impact of EU enlargement in agriculture on EU expenditures, on agricultural protection levels, on commodity markets and trade (see e.g. Banse et al. 2000, Tangermann – Banse 2000, Hartell – Swinnen 2000). A few years after accession, Gorton et al. (2006) analysed the international competitiveness of Hungarian agriculture by calculating domestic resource cost (DRC) ratios and making estimations for 2007 and 2013. They projected that EU enlargement will have a negative impact on the international competitiveness of Hungarian agriculture by increasing land and labour prices. Similar estimations were conducted by Erjavec (2006), forecasting that the newly accessed countries will gain from higher prices and budgetary support, indicating real improvements in most agricultural sectors on recent production levels. Ivanova et al. (2007) analysed Bulgarian agriculture following EU accession by the AGMEMOD model and found that accession would have a very positive effect on the crop sector in Bulgaria, whereas the effect is the opposite on the livestock sector. Ciaian and Swinnen (2006) analysed how transaction costs and imperfect competition in the land market affect the welfare effects of agricultural subsidies in the NMS. Their results show that the EU’s common agricultural policy (CAP) might have an ambiguous effect on NMS agriculture as decoupling of payments shifts policy rents to farmers, but constrains productivity-enhancing restructuring.
1 The authors gratefully acknowledge financial support from the Hungarian Scientific Research Fund, grant no.
83119 “Changes and determinants of Central and Eastern European agricultural trade”.
2 Czech Republic, Hungary, Poland and Slovakia
A large amount of literature is also dedicated to the analysis of trade impacts after 2004.
Bojnec and Ferto (2008) analysed agri-food trade competitiveness with the EU-15 of the newly accessed Member States and concluded that trade has increased as a result of enlargement, though there have been ‘catching-up’ difficulties for some countries in terms of price and quality competition, more so in higher value-added processed products. Bojnec and Ferto (2012) investigated the complementarities of trade advantage and trade competitiveness measures for agro-food trade of five Central European Countries with the European Union and confirmed that the revealed trade advantage is consistent with the one way export and the successful price and quality competition categories in two way trade.
Artan and Lubos (2011) analysed the agrarian trade transformation in the Visegrad Countries and found that the value and volume of VC export and import operations increased significantly. Fertő and Soós (2009) presented the duration of trade of former communist countries in the EU market and found that for the majority of countries, the length of trade is greater in EU10 markets than in EU15 markets. Ambroziak (2012) investigated the relationship between Foreign Direct Investment (FDI) and intra-industry trade (IIT) in the Visegrad countries and found that FDI stimulated not only vertical IIT in the region but also horizontal IIT. He found that differences in country size and income were positively related to IIT as is FDI, while distance and IIT showed a negative relationship.
Policy-oriented analysis of the impacts of accession can be found in Möllers et al. (2011), analysing the changes in agricultural structures and rural livelihoods in the NMS and reaching several agricultural policy conclusions, especially regarding the ongoing debate of the Common Agricultural Policy. Gorton et al. (2009) analysed why the CAP does not fully fit the region and identified several reasons valid for the NMS. Csáki and Jámbor (2009) analysed the impacts of the first five years of EU accession on NMS agriculture and concluded that EU accession has had an overall positive impact, although member states capitalised their possibilities in a different manner. Kiss (2011) echoed this conclusion and added that accession has created an incentive for NMS agriculture but also had negative effects due to tough competition in the enlarged market.
Despite the apparent importance of the topic, there are a limited number of research papers dealing with impacts of EU accession on the VC agriculture. Therefore, the aim of this article is to evaluate the status of the sector in the light of the latest available data as well as to identify the factors lying behind different country performances in the four Member States concerned. The paper is structured as follows. Section 2 analyses changes in agricultural performance after accession, followed by agricultural trade, price-income issues and farming structures. Section 3 identifies agricultural policy factors lying behind different country performance, while Section 4 considers positive and negative effects of EU accession. Section 5 concludes.
The first part of the paper uses simple descriptive statistics as a method to highlight recent changes in VCs agriculture, while the second part conducts agricultural policy analyses to show the background to these changes. Our data are derived from the FAO, Eurostat and World Bank databases and cover the period 2000-2010.
2. CHANGING AGRICULTURAL PERFORMANCE
Impacts of EU accession on agricultural performance can be measured in a number of areas such as production, trade, incomes or farm structures.
2.1. Mixed production performance
As to agricultural production performance, a number of indicators are available as the role of agriculture, values and indices of agricultural output and productivity to catch the impacts of accession. The role of agriculture in a national economy is best characterised by the share of agriculture in GDP, which is shrinking all over the world. This tendency continued after EU- accession in the Visegrad Countries as well. The highest role of agriculture in GDP can be observed in Hungary (5.5%) in 2000 but all other countries had a similar share (4-5%). After EU accession, shares in all cases decreased below 4%, though we should note that this is consistently higher in all countries if the food industry is taken into account as well. Note that shares experienced in the VC were still more than twofold than the euro zone average (Table 1).
Table 1. Share of agriculture in GDP in the Visegrad Countries (percentage) Country 2000 2003 2006 2010
Czech Republic 3.89 3.13 2.60 2.40
Hungary 5.54 4.30 4.01 3.53
Poland 4.96 4.39 4.29 3.54
Slovakia 4.47 4.52 3.59 3.86
Euro zone 2.41 2.09 1.73 1.54
Source: Compilation of the authors based on World Bank (2012)
The development of agricultural production is another key indicator of assessing the impact of accession. As Table 2 suggests, there are significant differences regarding the index of agricultural output in the Visegrad Countries. It can be seen that Poland increased gross agricultural output significantly in real terms from 2000 to 2011, while agricultural output in real terms decreased or remained stable in all other countries analysed. Note that the latter trend is valid for EU15 as well. The highest increase can be observed in Poland (approximately +40% in a decade), while the largest decrease occurred in Slovakia (around - 15% in a decade).
Table 2. Index of agricultural output in real terms in the Visegrad Countries (2000=100) Country 2003 2006 2008 2011*
Czech Republic 83.58 87.18 90.97 94.21
Hungary 86.54 88.29 79.63 100.87
Poland 97.95 110.46 96.77 141.96
Slovakia 97.68 86.53 84.94 85.99
EU15 94.98 85.12 93.13 93.40
* Estimated data
Source: Compilation of the authors based on World Bank (2012)
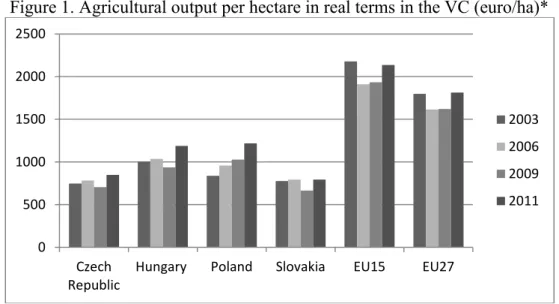
Similar conclusions can be drawn if analysing agricultural output per hectare in the VC after accession (Figure 1). This indicator varied between 500-1000 euro/ha in the years analysed.
The highest values of agricultural output per hectare can be observed in Hungary and Poland (around 1000 euro/ha), while lowest values show up for Slovakia in all years analysed.
Agricultural output per hectare increased significantly after EU accession and thereby Hungary and Poland could reach the 1000 euro/ha level by 2011. Figure 1 also well presents the effects of climatic conditions and the economic crisis, showing consistently lower values
for 2009. Note the gap between EU15 (or EU27) and the Visegrad Countries in land productivity.
Figure 1. Agricultural output per hectare in real terms in the VC (euro/ha)*
Source: Compilation of the authors based on Eurostat (2012).
Another measure closely linked to agricultural production performance is land productivity.
Figure 2 shows the diversity of cereal yields in the VC. In 2010, the highest yield occurred in Hungary (4.76 tonnes/ha), while the lowest in Poland (3.22 tonnes/ha). After EU accession, all countries analysed could increase their cereal yields, of which Hungarian growth was the biggest (almost 60%). However, VC still lags behind EU-15 levels in land productivity.
Figure 2. Yield of cereals in the VC (tonnes/ha)
Source: Compilation of the authors based on FAO (2012).
As to changes in labour productivity, all VC showed an increase after accession, though a considerable 4-5 times lag still exists compared to EU-15 countries (Figure 3). In 2011, the highest value was recorded in the Czech Republic (34,000 euro/AWU), which was around the EU-27 average, while the lowest was in Poland (10,000 euro/AWU).
0 500 1000 1500 2000 2500
Czech Republic
Hungary Poland Slovakia EU15 EU27
2003 2006 2009 2011
0,00 1,00 2,00 3,00 4,00 5,00 6,00 7,00
Czech Republic
Hungary Poland Slovakia EU15 EU27
2003 2006 2010
Figure 3. Agricultural output per annual work unit (AWU) in real terms in the VC (1000 euro/AWU)*
* Data for 2011 are based on estimations.
Source: Compilation of the authors based on Eurostat (2012).
EU accession has also affected the structure of agricultural production in the VC (Figure 4).
The structure of production after accession has shifted towards a more extensive direction, namely towards crop production. In 2011, the share of crop output was around 50-60% in the majority of the cases. Such a change was mainly due to the grain intervention system of the Common Agricultural Policy and increasing cereal prices leading to rising feed prices in the region, causing hard times for the capital-poor animal husbandry sector.
Figure 4. Rate of crop output in total agricultural output in the VC (percentage)
Source: Compilation of the authors based on Eurostat (2012).
On the whole, it can be concluded that EU accession has had a considerable impact on the agricultural performance of the VCs. The role of agriculture in GDP has decreased, agricultural output has changed to a limited extent, while the productivity lag has decreased somewhat but has still remained significant. Moreover, accession has made the agricultural production structure of the VCs to become more extensive, resulting in a decline of the livestock sector in the region.
2.2.Increased agri-food trade
0 10 20 30 40 50 60
Czech Republic
Hungary Poland Slovakia EU15 EU27
2003 2006 2009 2011
0 10 20 30 40 50 60 70
Czech Republic Hungary Poland Slovakia
2003 2006 2009 2011
Besides agricultural production, accession has had a significant impact on agri-food trade in the VCs. First of all, the value of agri-food trade has increased in nominal terms after 2004 (Table 3). The agri-food export of Hungary doubled from 2003 to 2011, while that of Slovakia increased almost five times. At the same time, agri-food import tripled in the majority of the cases. The biggest increase occurred in Slovakia for exports and also for imports, while the smallest increase was in the Czech Republic for exports and in Hungary for imports.
Table 3: Changes in agri-food trade in nominal terms in the VC (2003=100)
Country Export Import
2006 2009 2011 2006 2009 2011
Czech Republic 189 245 310 173 224 278
Hungary 128 164 225 205 244 310
Poland 212 268 351 188 271 362
Slovakia 258 329 477 224 338 433
Source: Compilation of the authors based on Eurostat (2012).
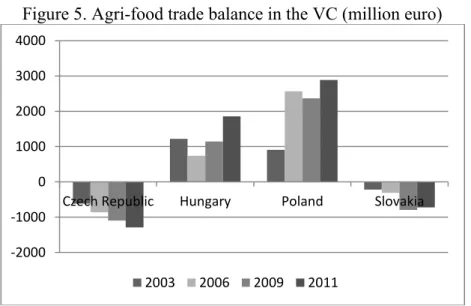
However, agri-food trade growth in nominal terms has not resulted in an improvement of agri- food trade balance in most of the countries analysed, as indicated by Figure 5. Only Hungary and Poland showed a positive agri-food trade balance in the period analysed, out of which the Polish balance exceeded 2.5 billion euro and the Hungarian almost reached 2 billion euro in 2011. However, accession has further deteriorated agri-food trade balance in the Czech Republic and Slovakia. The Czech Republic has suffered the biggest deficit (around 1.3 billion euro in 2011).
Figure 5. Agri-food trade balance in the VC (million euro)
Source: Compilation of the authors based on Eurostat (2012).
Country performances were based on different product structure though (Table 4). Except for the case of Poland, the share of raw materials in agri-food export has increased everywhere from 2003 to, while that of processed products in agri-food import has also increased in all cases except for Slovakia.
Table 4. Share of raw materials and processed products in VC agri-food trade (%) Country Raw materials in export Processed products in import
2003 2006 2009 2011 2003 2006 2009 2011
-2000 -1000 0 1000 2000 3000 4000
Czech Republic Hungary Poland Slovakia
2003 2006 2009 2011
Czech Republic 22 32 36 35 67 71 75 74
Hungary 33 34 38 35 72 73 75 76
Poland 28 24 25 20 62 66 68 67
Slovakia 26 32 36 35 75 73 77 75
Source: Compilation of the authors based on Eurostat (2012).
Regarding agri-food trade performance, it can be concluded that both exports and imports increased in the region in nominal terms after accession, while country performances have differed significantly. The largest agri-food exporters of the region were Poland and Hungary, while the other two countries have experienced an increasing deficit after 2004. Moreover, there was an increasing share of raw materials in agri-food exports of the VCs together with a same trend of processed products in agri-food imports in most of the cases. It is important to notice that Poland had a remarkable success in its agricultural trade performance since from an agricultural importer it became the largest exporter in a region in a decade.
2.3. Increasing prices and incomes
EU accession has also had a significant impact on agricultural prices and incomes.
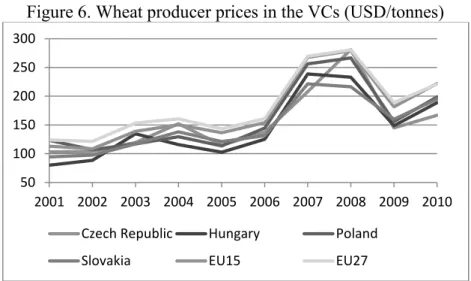
Agricultural raw material prices have shown a remarkable increase for a few years, usually demonstrated by changes in wheat producer prices (Figure 6). Wheat producer prices in the VCs have followed EU respective average prices to a great extent and by 2008 they increased by roughly two times compared to 2000. According to general price trends, the initial decline was followed by another price hike in 2011 in world agricultural product markets, also in the Visegrad Countries.
Figure 6. Wheat producer prices in the VCs (USD/tonnes)
Source: Compilation of the authors based on FAO (2012).
Similarly to wheat producer prices, those of fresh cow milk have also shown a significant increase during the past few years (Figure 7). Milk prices varied just to a limited extent country by country and ranged between 290 USD (Slovakia) and 386 USD (Czech Republic) per tonnes in 2010. Compared to 2000, milk producer prices have increased by 50-100% in the VCs. Milk prices in the region were generally below EU-15 prices. The largest price adjustment occurred in countries where pre-accession producer prices were lower.
Figure 7. Fresh cow milk producer prices in the VC (USD/tonnes)
50 100 150 200 250 300
2001 2002 2003 2004 2005 2006 2007 2008 2009 2010 Czech Republic Hungary Poland
Slovakia EU15 EU27
Source: Compilation of the authors based on FAO (2012).
Increasing producer prices have also resulted in an increase in producer incomes in the VCs after accession. Real farm income per annual work unit (AWU) has grown in each and every country in the region from 2003 to 2011, though to a different extent (Figure 8). The biggest increase can be recognised in Poland (almost three times), while the smallest in Slovakia (almost two times). EU average farm incomes have hardly changed in the period analysed and thereby agricultural income adjustment, similarly to price adjustment, has begun between old and new Member States.
Figure 8. Index of real farm income per annual work unit in the VCs (2003=100)
Source: Compilation of the authors based on Eurostat (2012).
On the whole, a significant increase has occurred in VC agricultural producer prices in nominal terms, while real producer prices have still remained below EU15 levels. Price adjustment was larger in countries with lower pre-accession levels. There has been a significant increase of farming incomes in the VCs, mainly due to agricultural subsidies, while initial differences have remained among countries.
2.4. Significant differences in farming structures
0 50 100 150 200 250 300 350 400 450
Czech Republic
Hungary Poland Slovakia EU15 EU27
2000 2003 2006 2010
50 100 150 200 250 300 350
2003 2004 2005 2006 2007 2008 2009 2010 2011 Czech Republic Hungary Poland
Slovakia EU27 EU15
There are huge differences among countries regarding land use structure of large and small farms (Table 5). On the one hand, majority of land was cultivated by small farms only in Poland, which has dominated agriculture during the socialist period, and has not changed much after 1990. On the other hand, large farms ruled land use in all the other countries. Land use in the Czech Republic and Slovakia (around 90% for large farms) show an extreme dominance of large scale farming. EU accession has just had a limited impact on farming structures of the VCs as initial conditions have remained.
Table 5. Share of farms by land use (UAA) in VC (%)
Country 2003 2010
≤100 ha >100 ha ≤100 ha >100 ha Czech Republic 10.81 89.19 11.43 88.57
Hungary 40.31 59.69 35.26 64.74
Poland 80.92 19.08 78.40 21.60
Slovakia 6.68 93.32 8.92 91.08
Source: Compilation of the authors based on FAO (2012).
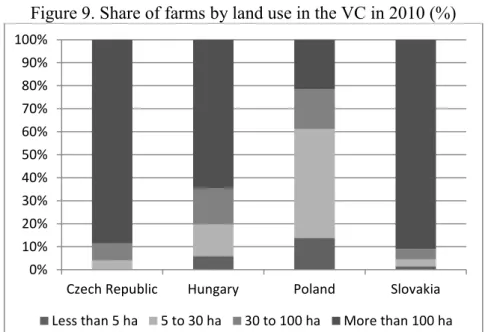
Differences remain if we split up the farms by land use into four parts (Figure 9). It can be seen in Figure 9 that medium scale farms had just a limited role in each country, except for Poland. In the Czech Republic and Slovakia, small farms were actually missing from land use, while in Hungary, their share was 6% in 2010. These patterns stayed relatively stable compared to pre-accession levels (Csáki and Jámbor, 2010)
Figure 9. Share of farms by land use in the VC in 2010 (%)
Small farm: less than 5 ha, medium farm: 5-100 ha, large farm: more than 100 ha Source: Compilation of the authors based on Eurostat (2012).
Average sizes of large and small scale farms also show significant differences (Table 6). In 2010, average farm size of small farms was below 2 hectares in the VCs, whilst that of large farms was 550 hectares. Biggest differences in sizes can be observed in Hungary in 2010, where a large farm was 670 times bigger than the regarding average UAA (utilized agricultural area) per farm than a small one. Large farms had the greatest average area (698 ha) in the Czech Republic and the lowest in Poland (323 ha). Hungarian farmers had the
0%
10%
20%
30%
40%
50%
60%
70%
80%
90%
100%
Czech Republic Hungary Poland Slovakia Less than 5 ha 5 to 30 ha 30 to 100 ha More than 100 ha
smallest farm sizes in 2010, while Poland had the biggest average size of small farms in the VCs.
Table 6. Average area cultivated by farms in the VC in 2010 (ha) Country Less than 5 ha 5-29.99 ha 30-99.99 ha 100 ha or more
Czech Republic 1.79 13.22 54.49 698.00
Hungary 0.61 11.93 52.60 407.26
Poland 2.43 11.16 47.49 323.41
Slovakia 1.89 11.66 55.46 781.22
Source: Compilation of the authors based on Eurostat (2012).
3. UNDERLYING FACTORS BEHIND CHANGES
It can be seen from the analyses above that EU accession has had an impact on regional agriculture, though individual country performances have significantly differed from each other. These differences have evolved due to a number of reasons.
3.1. Initial conditions
The first reason behind different country performances lies in initial conditions. Different distribution of agricultural land quality and quantity together with the differences in agricultural labour and capital endowment definitely had an impact. Poland had the biggest agricultural land and labour endowment together with the largest capital endowment among the VCs, while Slovakia had the smallest. In other words, initial differences in the factors of production have had a considerable impact on country performances after accession.
Another important difference lies in farm structures. Except for Poland where small scale agriculture proves to be beneficial, present farm structures in the VCs are the result of a complex process of land privatisation and farm restructuring where both end of the ‘dual’
farming system are still suffering by a kind of ‘transition phenomena’. The small farms are generally too small and farmers do not have enough knowledge and lack of resources, while large farms still have some heritage of the collective farming system with some embedded inefficiencies. Moreover, one of the key characteristics of the region is the high but decreasing number of small farms (Möllers et al. 2011).
In addition to these factors, national agricultural policy and institutional framework basically determines individual country performances. The assessment of these policies before and after accession provides a better understanding of such differences.
3.2. Impacts of pre-accession policies
The post-accession performance of the VCs has been influenced strongly by the agricultural policy framework prevailing in the individual countries during the pre-accession period especially from 1998 to 2004. The candidate countries implemented quite different policies some with positive, others with negative impacts after accession.
Measures in favour of competitiveness enhancement have definitely proven to be beneficial.
On the one hand, those countries where agricultural subsidies to farmers remained at a low level (e.g. Poland) have gained with the accession which has provided visible incentives for production and led to the increase of agri-food trade balance. On the other hand, those
countries providing initially high and uneven price and market support (e.g. Hungary) are considered to lose with accession as it has brought hardly any price increase. Agricultural policy not in favour of measures aiming to enhance competitiveness was a failure, resulting in a situation where the majority of farmers were not prepared for the EU-accession.
Differently implemented land and farm consolidation policies have also had diverse effects on post-accession country performance. Restrictive pre-accession land policies and the lack of land and farm consolidation (e.g. in Hungary) has negatively influenced the capacity to take advantage of the enlarged markets by constraining significantly the flow of outside capital to the agricultural sector. Conversely, liberal land policies helped the agricultural sector to obtain more resources and utilise better the possibilities created by the accession (Ciaian et al.
2010).
The ways in which the countries used EU-funded pre-accession programmes such as SAPARD, ISPA and PHARE was also important. Those who focused on competitiveness enhancement and production improvement were better placed to realise the benefits after the accession. On the contrary, delays in creating the required institutions as well as the initial disturbances of implementation resulted in the loss of some EU funds in a number of countries.
3.3. Impacts of post-accession policies
Besides pre-accession policies, individual country performances were also affected by policies implemented after 2004 and 2007. One of the most important issues in this regard was the introduction of the CAP based on the Copenhagen Agreement which provided a uniform framework for national agricultural policies. According to the agreement, the countries could choose between a simplified area-based payment system (SAPS) complemented with additional support for rural development and for implementing the EU-15 type CAP. All the countries, except Slovenia and Malta, opted for the simplified payment system, whereby the direct payment was 25% of the EU-15 level in 2004. The countries had the freedom to top up the direct payments which initially were set at 25% the EU-15 level.
They could transfer part of the rural development support to the direct payment or use national funds (initially a maximum of 30 percentage points above the set EU level); all of the countries used this latter opportunity but to different degrees. Despite the fact that the NMSs were not eligible for the total payments of the EU-15, the CAP has significantly increased farmers’ incomes, as shown before in Figure 8.
However, it is important to note that the level of support was set on the basis of the yields in the pre-accession period, causing a huge diversity in the distribution of direct payments at the European level (Figure 10). Direct payments varied between 100 euro and 800 euro per hectare and between 1,000 euro and 40,000 euro per beneficiary in 2008 in EU27. The average level of direct payments was 300 euro/ha and around 6,000 euro/farm, while the respective values for NMS were 200 euro/ha and approximately 2,500 euro/farm (calculated at 100% of direct payments). These differences have had a significant impact on country performances in the VCs after accession.
Figure 10. Average direct payments per hectare and per beneficiary in EU-27 in 2008
Source: DG Agri (2011).
Total payments for agriculture have also differed in the VC after accession. As Figure 11 suggests, direct payments played a significant role in total national payments for agriculture.
It can also be seen that Hungary and Poland spent a relatively high share of their GDP on agriculture, while there also existed significant differences between old and new member states (the average of EU-15 was 0.5%, while that of NMS was 1.5%).
Figure 11. Total payments for agriculture in EU27 as share of their GDP (2009)
Source: DG Agri (2011).
Besides direct payments, the second pillar of the CAP also provides support for farms and for broader rural development purposes. However, individual country priorities in this regard were also different, as indicated by Figure 12.
Figure 12. CAP expenditure between pillars in 2009
Source: DG Agri (2011).
Most VCs give priority to the second pillar, while EU-15 countries mainly focus on the first pillar. In the second pillar (rural development measures), the biggest support goes to competitiveness enhancement and agri-environmental measures.
The grain market intervention system of the CAP has also proved to be important as a post- accession policy, experiences of which are controversial in the region. On the one hand, the intervention system helped to ease crop farmers’ problems and provided them significant income, while on the other hand, it stabilised grain-feed prices on a significantly higher level prior to accession resulting significant difficulties for the livestock sector. However, after the price shock in 2007, increasing grain prices have led to rising agricultural income as the intervention system with relatively low intervention prices has slowly eroded.
Finally, it is important to emphasise that the Common Agricultural Policy has brought safety for VC agriculture. During the years of the economic crisis, national budgets under pressure might not have been able to appropriately subsidise agriculture and ease the impacts of the crisis.
4. POSITIVE AND NEGATIVE AGRICULTURAL EFFECTS OF ACCESSION On the whole, it is evident that EU accession has had several positive impacts on agriculture in the Visegrad Countries. First, the enlarged EU market with over half a billion consumers offers tremendous opportunities for their agricultural sectors. Second, as discussed above, EU accession has increased farmers’ incomes. Third, the accession has provided a solid and uniform policy and institutional framework under which national agricultural policies are implemented.
However, besides these benefits, several difficulties of EU membership have emerged. First of all, the accession has made the VCs part of a large, rather competitive market, where they have limited potential to withhold competitive pressure. This situation is due to the rapid emergence of vertically coordinated food chains including hypermarkets, supermarkets and multinational agro-processing companies with regional procurement systems, thus creating new and much more competitive conditions both for producers and consumers; the market
share of foreign-origin products has increased significantly, while domestically produced products have to compete with the free flow of foreign produce. Due to very strong price competition, consumers are generally the beneficiaries of these changes. At the same time producers are not always able to adjust, or to cope with business practices employed by the large chains. The concentrated and Europe-wide procurement systems of the major chains create high requirements for suppliers and impose strong price pressures as well. Farmers’
adjustment to the enlarged integrated food markets is one of the most pressing demands of the post accession situation and requires public involvements (Csaki – Jambor, 2010).
The evolving food crisis has also resulted in several difficulties. High prices of agricultural raw materials and energy, in addition to the obligatory EU standards after accession, have all made the manufacture of processed products more expensive. These additional costs are difficult to pass on to consumers due to the fierce price competition. As a result, the regional food industry has found itself under extreme pressure, from which it still has not recovered.
The subsidy policy of competitors is also a source of concern. The traditionally high agricultural subsidies of the EU15 have artificially increased the competitiveness of agri-food products imported by the VCs after accession, generating unequal competitive market positions in EU27 markets (Ciaian et al. 2010). This argument is strengthened if account is taken of the small proportion of direct payments that have been received by the VCs immediately after accession. Moreover, adjustment to EU subsidy levels, coupled with familiarization with the new system and the creation of the necessary institutional infrastructure have been time consuming, which has delayed the response of the region to address its competitive disadvantages.
The handicap of small farmers also raises serious problems. As discussed earlier, one of the major characteristics of VC agriculture is the diversity of farming structures. This diversity means that large as well as small farms exist in national agricultures at the same time, differing in terms of both attitudes towards commercialisation and factual circumstances.
However, the large number of subsistence and semi-subsistence farms is a special characteristic of the VCs since these farms are fundamentally different from those which are called ‘small farms’ in the EU15 and they are hardly comparable to any segments of the EU15 farming sector and thus require special attention and policies (Möllers et al. 2011). However, it appears that subsistence and semi-subsistence farms are handicapped in many ways. Before accession, agricultural policies mainly neglected these farms and currently the CAP provides almost nothing for these farms. As a result, on the one hand, the agricultural incomes of small farms fail to provide them with an acceptable level of living in most cases. The majority of small farms hardly have any relationship with national or regional markets, making it difficult for them to sell their produce. On the other hand, the number of jobs outside agriculture is also limited in rural areas, therefore family members are often forced to leave the rural area permanently. Specific policies are needed for managing this problem including policy actions focused on small farms (Csaki – Jambor, 2010).
Moreover, one of the major problems of accession for VCs was the widening urban-rural income gap. Rural population and rural areas have been lagging behind since the beginning of the transition in the early 90s and this has not been yet solved by accession. On the whole, it can be concluded that the ‘one size fits all’ approach of the CAP does not work as it fails to recognise the structural diversity of individual member states. More targeted and locally adjusted agricultural policy programmes are needed in the future.
On the whole, the question arises whether there is any real convergence between the Visegrad Countries and the EU15. Figure 13 suggests that convergence is limited between old and new member states (including the VCs) as land productivity and farm income levels show huge differences. Agricultural output per hectare is almost two times higher in EU15 than in the VCs, while the same difference in farm net value added is almost threefold. Therefore it is clear that post-transition of the Visegrad Countries is still an issue.
Figure 13. Land productivity and farm income at real prices
Source: Compilation of the authors based on Eurostat (2012).
5. CONCLUSIONS
The review of developments in the agricultural sector of the Visegrad Countries has led to a number of conclusions. First of all, EU accession has had diverse impacts on the agricultural performance of the VCs. The role of agriculture has further decreased in national economies, agricultural output has somewhat changed, while the productivity lag has decreased but remained remarkable. Furthermore, accession has strengthened extensive ways of production.
Regarding agri-food trade performance, it can be concluded that both exports and imports have increased in the region in nominal terms after accession, while country performances have differed significantly. The biggest agri-food exporters of the region were Poland and Hungary, while the other two countries have experienced an increasing trade balance deficit in the region after 2004. There was a high and increasing share of raw materials in agri-food exports of the VCs together with the same trend of processed products in agri-food import in the majority of the cases. As to agricultural producer prices, a significant increase has occurred in the VCs in nominal terms, while real producer prices have still remained below EU-15 levels. Price adjustment was larger in countries with lower pre-accession levels. There has been a significant increase of farming incomes in the VCs, mainly due to agricultural subsidies, while initial differences have remained among countries. However, EU accession has just had a limited impact on farming structures of the VCs as initial conditions have remained.
It is also clear from the analyses that the VCs have significantly differed in using the possibilities of the enlarged market which has generated different performances due to initial conditions, pre-accession policies and post-accession policies. Among initial conditions, different distribution of agricultural land quality and quantity together with the differences in
0 100 200 300 400 500 600 700 800 900
0 500 1000 1500 2000 2500
Czech Republic
Hungary Poland Slovakia EU15 NMS Farm net value added/ha (euro/ha)
Agricultural output per ha (euro/ha)
2003 2011 2003 2011
agricultural labour and capital endowment have to be mentioned. Regarding pre-accession policies, measures in favour of competitiveness enhancement, liberal land and farm consolidation policies as well as efficiently used pre-accession funds have proven to be beneficial. As to post-accession policies, the uniform policy framework has to be emphasised together with different levels of national support and the impact of macro policies.
On the whole, results suggest that EU accession has had both positive and negative impacts on VC agriculture. As to positive impacts, the enlarged EU market, increased farmers’
incomes as well as the solid and uniform policy and institutional framework should be mentioned. However, besides these benefits, several difficulties have also emerged after accession, out of which the limited potential to withhold competitive pressures, the lack of harmonised support levels, the handicap of small farmers and the rural-urban income gap should be emphasised.
REFERENCES
Ambroziak, L. (2012): FDI and intra-industry trade: theory and empirical evidence from the Visegrad Countries. International Journal of Economics and Business Research 4(1):
180-198.
Artan, Q. – Lubos, S. (2011): The Agrarian Trade Transformation in the Visegrad Countries.
Paper provided by European Association of Agricultural Economists in its series 2011 International Congress, August 30-September 2, 2011, Zurich, Switzerland
Banse, M. – Munch, W. – Tangermann, S. (2001): Eastern Enlargement of the European Union: A General and Partial Equilibrium Analysis. Proceedings of the Twenty-fourth International Conference of Agricultural Economists, Berlin, Germany, 13-18 August 2000.
Bojnec, Š. – Fertő, I. (2008): European Enlargement and Agro-Food Trade. Canadian Journal of Agricultural Economics 56(4): 563-579.
Bojnec, Š. – Fertő, I. (2012): Complementarities of trade advantage and trade competitiveness measures. Applied Economics 4(4): 399-408.
Csáki, C. – Jámbor, A. (2010): Five Years of Accession: Impacts on Agriculture in the NMS.
EuroChoices 9(2): 10–17.
Csáki, C. – Jámbor, A (2009): The Diversity of Effects of EU Membership on Agriculture in New Member States. FAO Regional Office for Europe and Central Asia, Policy Studies on Rural Transition, No. 2009-4, October 2009.
Ciaian, P. – Swinnen, J.F.M. (2006): Land market imperfections and agricultural policy impacts in the New EU Member States: a partial equilibrium analysis. American Journal of Agricultural Economics 88(4): 799-815.
Ciaian, P. – Kancs, D. – Swinnen, J.F.M. (2010): EU land markets and the Common Agricultural Policy. CEPS Brussels, 2010.
DG Agri (2011): Agricultural Policy Perspectives, http://ec.europa.eu/agriculture/publi/app- briefs/02_en.pdf, accessed 25/03/2013
Erjavec, E. – Donnellan, T. – Kavcic, S. (2006): Outlook for CEEC Agricultural Market After EU Accession. Eastern European Economics 44(1): 83-103.
Eurostat (2012): Statistics by Theme,
http://epp.eurostat.ec.europa.eu/portal/page/portal/statistics/themes, accessed 25/03/2013
Fertő, I. – Soós, K.A. (2009): Duration of trade of former communist countries in the EU market. Post-Communist Economies 21(1): 31-39.
FAO (2012): http://faostat.fao.org/site/339/default.aspx
Gorton, M. – Davidova, S. – Banse, M. – Bailey, A. (2006): The International Competitiveness of Hungarian Agriculture: Past Performance and Future Projections.
Post-Communist Economies 18(1): 69-84.
Gorton, M. – Hubbard, C. – Hubbard, L. (2009): The Folly of European Union Policy Transfer: Why the Common Agricultural Policy (CAP) Does Not Fit Central and Eastern Europe. Regional Studies 43(10): 1305–1317.
Hartell, J. – Swinnen, J.F.M., eds) (2000): Agriculture and East-West European Integration.
Aldershot: Ashgate.
Ivanova, N. – Peneva, M. – Mishev, P. – Golemanova, A. – Erjavec, E. (2007): Bulgarian Agriculture and EU Accession. Post-Communist Economies 19(3): 263-280.
Kiss, J. (2011): Some impacts of the EU accession on the new member states’ agriculture.
Eastern Journal of European Studies 2(2): 49–60.
Möllers, J. – Buchenrieder, G. – Csaki, C., eds. (2011): Structural Change in Agriculture and Rural Livelihoods: Policy Implications for the New Member States of the European Union, IAMO Studies on the Agricultural and Food Sector in Central and Eastern Europe. Vol. 61., Halle (Saale), Germany
Swinnen, J.F.M. – Rozelle, S. (2006): From Marx and Mao to the Market: The Economics and Politics of Agricultural Transition. Oxford University Press, UK.
Tangermann S. – Banse, M. (2000): Central and Eastern European Agriculture in an Expanding European Union. Wallingford: CABI Publishing.
World Bank (2012): World Development Indicators,
http://databank.worldbank.org/ddp/home.do?Step=12&id=4&CNO=2, accessed 25/03/2012.