serum plGF and eGF are
independent prognostic markers in non-metastatic colorectal cancer
sebastian schölch 1,2,3,4, Andreas Bogner 2, Ulrich Bork2, Mohammad Rahbari 1, Balázs Győrffy5,6, Martin schneider3,4,7, Christoph Reissfelder1,2,3,4, Jürgen Weitz2,3,4
& Nuh N. Rahbari1,2
the aim of this study was to determine the prognostic value of circulating angiogenic cytokines in non-metastatic colorectal cancer (CRC) patients. Preoperative serum samples of a training (TC) (n = 219) and a validation cohort (VC) (n = 168) were analyzed via ELISA to determine PlGF, EGF, VEGF, Ang1, PDGF-A, PDGF-B, IL-8 and bFGF levels. In addition, survival was correlated with PlGF and EGF expression measured by microarray and RNAseq in two publicly available, independent cohorts (n = 550 and n = 463, respectively). Prognostic values for overall (OS) and disease-free survival (DFS) were determined using uni- and multivariate Cox proportional hazard analyses. Elevated PlGF is predictive for impaired OS (TC: HR 1.056; p = 0.046; VC: HR 1.093; p = 0.001) and DFS (TC: HR 1.052;
p = 0.029; VC: HR 1.091; p = 0.009). Conversely, elevated EGF is associated with favorable DFS (TC: HR 0.998; p = 0.045; VC: HR 0.998; p = 0.018) but not OS (TC: p = 0.201; VC: p = 0.453). None of the other angiogenic cytokines correlated with prognosis. the prognostic value of plGF (os + DFS) and EGF (DFS) was confirmed in both independent retrospective cohorts. Serum PlGF and EGF may serve as prognostic markers in non-metastatic CRC.
With an estimated 1.4 million new cases and 700.000 deaths worldwide, colorectal cancer (CRC) is among the three most frequent malignant diseases1. Although the worldwide incidence is declining due to better early detec- tion and treatment methods, CRC remains one of the leading causes of cancer-related death2, mainly due to syn- chronous or metachronous distant metastases3. While many patients never experience recurrence after curative resection, others suffer from recurrence and ultimately succumb to the disease. It therefore remains an important task to develop new prognostic markers and techniques in order to identify high risk patients requiring aggressive treatment and avoid overtreatment in low risk disease4–6.
Neoangiogenesis is essential for tumor growth and metastatic spread. Therefore, angiogenic factors are impor- tant targets of anti-tumor therapy. There is a broad panel of known cytokines involved in tumor angiogenesis including vascular endothelial growth factor (VEGF), Angiopoietin 1 (Ang1), platelet-derived growth Factor A and B (PDGF-A, PDGF-B), the chemokine Interleukin 8 (IL-8) and basic fibroblast growth factor (bFGF)7–9.
Placental growth factor (PlGF) is a member of the vascular endothelial growth factor (VEGF) family and a key molecule in angiogenesis and vasculogenesis10,11; however, its molecular mechanisms of action remain incompletely understood12. Aside from its role in pregnancy, preeclampsia and early pregnancy loss detection, PlGF may also be involved in pathologic and physiological responses to hypoxia13. Elevated PlGF levels are found in several inflammatory diseases and are involved in the recruitment and homing of regulatory immune cells14,15. PlGF thus contributes to immune escape mechanisms by suppressing anti-tumor immunity within solid malig- nancies16. Another tumor-promoting mechanism of PlGF is its binding capacity to vascular endothelial growth
1Department of Surgery, Universitätsmedizin Mannheim, Medical faculty Mannheim, Heidelberg University, Mannheim, Germany. 2Department of Gastrointestinal, thoracic and Vascular Surgery, Medizinische fakultät carl Gustav carus, technische Universität Dresden, Dresden, Germany. 3German cancer consortium, Heidelberg, Germany. 4German cancer Research center (DKfZ), Heidelberg, Germany. 5MtA ttK Lendület cancer Biomarker Research Group, Magyar Tudósok körútja 2., H-1117, Budapest, Hungary. 6Semmelweis University, 2nd Department of Pediatrics, Bókay u. 53-54., H-1083, Budapest, Hungary. 7Department of General, Gastrointestinal and transplant Surgery, University Hospital Heidelberg, Medical faculty Heidelberg, Heidelberg University, Heidelberg, Germany.
Sebastian Schölch and Andreas Bogner contributed equally. correspondence and requests for materials should be addressed to S.S. (email: sebastian.schoelch@umm.de)
Received: 28 January 2019 Accepted: 17 July 2019 Published: xx xx xxxx
opeN
factor receptor 1 (VEGFR1), which is a known tumor driver and upregulated in a variety of different malignant tumors17. Its activation triggers angiogenesis, tumor spread and growth. As a result, VEGF(R) inhibitors are widely used in the treatment of many solid tumors including metastatic CRC18.
Epidermal growth factor receptor (EGFR) is a member of the HER/ERBB family of receptor tyrosine kinases and responsible for downstream activation of several oncogenic mechanisms including angiogenesis, endothelial cell invasion, proliferation and migration. Epidermal growth factor (EGF) is the main activator of EGFR and its downstream signaling cascade19,20.
There are only few studies that tested serum levels of PlGF and EGF in patients with CRC indicating PlGF and EGF as potential prognostic markers of tumor recurrence and survival21,22. However, the currently available data on these two factors was derived mainly from stage IV patients. In addition, serum PlGF and EGF were primarily evaluated for their predictive rather than their prognostic value. The aim of this study was therefore to evaluate the serum levels of a panel of angiogenic factors including PlGF and EGF as potential prognostic markers in patients with non-metastatic CRC.
Methods
patients. This report is in accordance with the REMARK guidelines23. Informed consent to this study was obtained from every patient prior to enrollment. A total of 387 CRC patients were recruited between 08/1997 and 05/2010 and divided into a training cohort (TC; n = 219; 1997–2007) and a validation cohort (VC; n = 168;
2007–2010). Patients were prospectively enrolled in this study and underwent surgery with curative intent at the Department of Surgery, University of Heidelberg, Germany for histologically proven, non-metastatic CRC.
Preoperative staging included colonoscopy with biopsy and a CT scan of the chest and abdomen to exclude metastatic disease. Surgical procedures included (extended) right and left hemicolectomy, transverse colon resec- tion, sigmoid colon resection, anterior and abdominoperineal rectal resection. All adjuvant and neoadjuvant treatments were given according to German S3 guidelines for colorectal cancer and did not change during the patient recruitment period. Neoadjuvant therapy was only given to rectal cancer patients (mid or lower rectum) as short-course chemoradiation (5 × 5 Gy + 5-Fluorouracil) without additional antibodies, particularly no anti- EGFR antibodies.
Adjuvant therapy was given only to patients with UICC III or high risk UICC II (T4 tumors, L1, V1, emer- gency surgery for tumor-related bowel obstruction). Adjuvant therapy consisted of 6 months of 5-FU +/− oxalip- latin/leucovorin without additional antibodies.
The study was approved by the institutional ethics board of the Faculty of Medicine of the University of Heidelberg and was conducted in accordance with the Declaration of Helsinki as well as the ICH Harmonized Tripartite Guideline for Good Clinical Practice in their most current versions.
sample collection. Serum samples from all patients were drawn in the operating room prior to the first inci- sion from a central venous catheter. Standard 9 mL serum collection tubes (S-Monovette; Sarstedt, Nümbrecht, Germany) were used for sample collection, immediately transferred to the laboratory, centrifuged, aliquoted and stored at −80 °C.
ELISA. Enzyme-linked immunosorbent assays (ELISA) were used to determine the serum levels of human PlGF, human EGF, human VEGF, human Ang1, human PDGF-A, human PDGF-B, human IL-8 and human bFGF using commercially available kits (Quantikine, R&D Systems, Minneapolis, MN, USA) according to the manufacturer’s instructions. Data collection was carried out on an Infinite 200 Pro ELISA reader (Tecan, Männedorf, Switzerland).
Affymetrix CRC cohort. A database of publicly available CRC patient samples measured by Affymetrix gene chips was set up as described previously24. In brief, gene chip datasets with transcriptome-wide gene expression data generated by Affymetrix gene arrays and available survival data were identified in the Gene Expression Omnibus repository (www.ncbi.nlm.nih.gov/geo/). Samples were MAS5 normalized and a second scaling normalization was performed to set the mean expression across all probes to 1000. We selected the probe sets 209652_s_at for PlGF and 206254_at for EGF.
TCGA CRC cohort. CRC patients measured by RNA-seq were published in The Cancer Genome Atlas (TCGA)25. Pre-processed level 3 data generated using Illumina HiSeq. 2000 RNA Sequencing V2 and probe IDs 5228 (PlGF) and 1950 (EGF) were used. For each sample, the expression level was determined using a combina- tion of MapSplice and RSEM. The individual sample files were merged in R using the plyr package26.
statistical analysis. All values are reported with standard deviation (SD). For univariate analyses, categor- ical variables were compared using the χ2-test. Continuous variables were expressed as arithmetic mean with standard deviation and compared using students’ t-test. All variables with p < 0.05 were included in a stepwise backward, multivariate logistic regression model using the median as a cutoff. Survival analysis was performed by employing Cox proportional hazard regression in the R statistical environment (www.r-project.org) as described previously27. Hazard ratios with 95% confidence intervals and log-rank P values were calculated using the library
“survival”. Overall survival, defined as time to death, and disease-free survival, defined as time to recurrence, were determined. Kaplan-Meier curves were drawn to visualize the survival differences. All variables with p < 0.05 on univariate analysis were added to a multivariate Cox regression model adjusting for age, sex, site of disease (SOD) and UICC stage and addressed for multiple testing controlling the false discovery rate by using the Benjamini-Hochberg procedure28. Statistical analyses were carried out using IBM SPSS Statistics v23 (SPSS Inc., Chicago, IL), R (www.r-project.org) and GraphPad Prism v7 (Graph Pad Software Inc., La Jolla, CA).
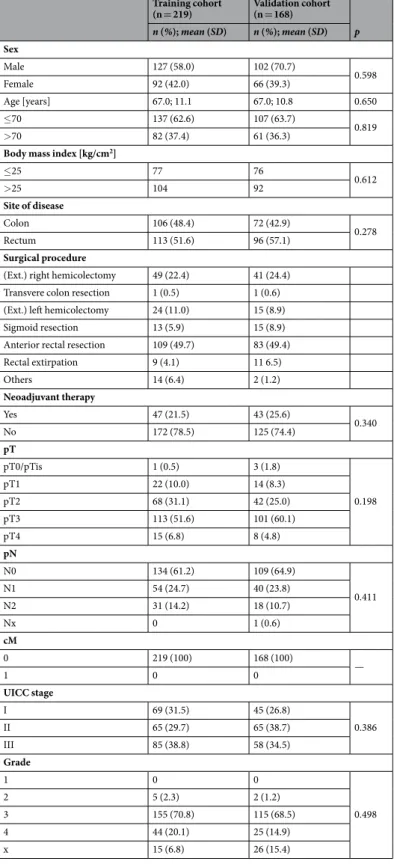
patient demographics. Characteristics of the study cohorts are listed in Table 1. There were 127 male (58.0%) and 92 female (42.0%) patients with a mean age of 67.0+/− 11.1 years in the TC. The VC included 102 male (60.7%) and 66 (39.3%) female patients aged 67.0+/− 10.8 years. All patients had histologically confirmed postoperative negative resection margins (R0). There were no significant differences in any demographic, clinical or histological variables between patients in the TC and VC.
Training cohort
(n = 219) Validation cohort (n = 168)
p n (%); mean (SD) n (%); mean (SD) Sex
Male 127 (58.0) 102 (70.7)
0.598
Female 92 (42.0) 66 (39.3)
Age [years] 67.0; 11.1 67.0; 10.8 0.650
≤70 137 (62.6) 107 (63.7)
0.819
>70 82 (37.4) 61 (36.3)
Body mass index [kg/cm2]
≤25 77 76
0.612
>25 104 92
Site of disease
Colon 106 (48.4) 72 (42.9)
0.278
Rectum 113 (51.6) 96 (57.1)
Surgical procedure
(Ext.) right hemicolectomy 49 (22.4) 41 (24.4) Transvere colon resection 1 (0.5) 1 (0.6) (Ext.) left hemicolectomy 24 (11.0) 15 (8.9)
Sigmoid resection 13 (5.9) 15 (8.9)
Anterior rectal resection 109 (49.7) 83 (49.4)
Rectal extirpation 9 (4.1) 11 6.5)
Others 14 (6.4) 2 (1.2)
Neoadjuvant therapy
Yes 47 (21.5) 43 (25.6)
0.340
No 172 (78.5) 125 (74.4)
pT
pT0/pTis 1 (0.5) 3 (1.8)
0.198
pT1 22 (10.0) 14 (8.3)
pT2 68 (31.1) 42 (25.0)
pT3 113 (51.6) 101 (60.1)
pT4 15 (6.8) 8 (4.8)
pN
N0 134 (61.2) 109 (64.9)
0.411
N1 54 (24.7) 40 (23.8)
N2 31 (14.2) 18 (10.7)
Nx 0 1 (0.6)
cM
0 219 (100) 168 (100)
1 0 0 —
UICC stage
I 69 (31.5) 45 (26.8)
0.386
II 65 (29.7) 65 (38.7)
III 85 (38.8) 58 (34.5)
Grade
1 0 0
0.498
2 5 (2.3) 2 (1.2)
3 155 (70.8) 115 (68.5)
4 44 (20.1) 25 (14.9)
x 15 (6.8) 26 (15.4)
Table 1. Patient characteristics of the training and validation cohorts. Abbreviations: SD, standard deviation; BMI, body mass index; Ext., extended; UICC, Union Internationale Contre le Cancer; PlGF, Phosphatidylinositol-glycan biosynthesis class F protein/Placental growth factor; EGF, epidermal growth factor.
Results
Association of angiogenic factors with clinicopathologic variables. The arithmetic mean of serum PlGF levels was 15.5 pg/mL (+/− 5.8) in the TC and 14.4 pg/mL (+/− 4.5) in the VC (p = 0.042). Serum EGF levels in the TC were 251.8 pg/mL (+/− 175.2) and 343.3 pg/mL (+/− 197.2) in the VC (p < 0.001). Neither in the TC (r = − 0.180, p = 0.023) nor in the VC (r = − 0.027, p = 0.728) a strong correlation between EGF and PlGF serum levels was observed. Associations of serum PlGF and EGF with clinicopathologic variables on univariate analysis are shown in Table 2. Univariate analysis and arithmetic means for VEGF, Ang1, PDGF-A, PDGF-B, IL-8 and bFGF are given in Supplementary Tables 1–3. The multivariate logistic regression models were adjusted for age, sex, SOD and UICC stage (Table 3). Higher serum PlGF levels were observed in patients with age > 70 in VC (Odds Ratio (OR) 0.425; 95% Confidence Interval (CI): 0.215–0.840; p = 0.014), BMI > 25 in VC (OR 0.439; 95%
CI 0.226–0.852; p = 0.015) and neoadjuvant chemotherapy (TC: OR 0.457; 95% CI 0.222–0.940; p = 0.033; VC:
Training cohort Validation cohort
PlGF EGF PlGF EGF
mean p mean p mean p mean p
Sex
male 16.4
0.100 240.9
0.348 15.5
0.011 328.6 0.261
female 15.1 267.4 13.6 366.0
Age (y)
≤70 15.5
0.206 272.6
0.022 14.4
0.216 364.6 0.042
>70 16.5 219.4 15.3 305.9
BMI [kg/cm2]
≤25 15.8
0.639 285.7
0.248 13.9
0.035 317.2 0.106
>25 16.3 252.2 15.4 364.9
Site of disease
Colon 15.7
0.793 267.8
0.229 14.0
0.077 374.6 0.075
Rectum 15.9 234.7 15.3 319.8
Validation cohort
Yes 17.6
0.016 252.2
0.986 16.9
<0.001 289.3
0.037
No 15.3 251.6 14.0 361.9
pT
0/Tis/1/2 15.5
0.522 237.3
0.440 14.1
0.165 354.9 0.946
3/4 16.1 261.3 15.1 337.0
pN
0 16.2
0.510 225.2
0.032 14.6
0.608 354.7 0.552
1/2 15.3 288.1 15.0 320.5
UICC stage
I/II 16.2
0.356 225.2
0.032 14.6
0.563 355.3 0.307
III 15.3 288.1 15.0 320.5
Grade
1/2 14.14
0.551 51.65
0.104 15.2
0.831 336.5 0.934
3/4 15.68 253.96 14.5 348.4
Table 2. Univariate analysis of factors associated with serum PlGF and EGF levels. Abbreviations: BMI, body mass index; UICC, Union Internationale Contre le Cancer; PlGF, Phosphatidylinositol-glycan biosynthesis class F protein/Placental growth factor; EGF, epidermal growth factor.
Training cohort Validation cohort
PlGF EGF PlGF EGF
OR (95%CI) p OR (95%CI) p OR (95%CI) p OR (95%CI) p
Sex 0.736 (0.397–1.365) 0.331 0.962 (0.480–1.929) 0.906 0.585 (0.297–1.152) 0.121 0.970 (0.503–1.871) 0.948 Age ≤70 [years] 1.699 (0.898–3.214) 0.103 0.571 (0.287–1.138) 0.142 0.425 (0.215–0.840) 0.014 0.899 (0.463–1.745) 0.808 BMI ≤ 25 [kg/cm2] 1.041 (0.557–1.946) 0.901 0.903 (0.458–1.782) 0.769 0.439 (0.226–0.852) 0.015 0.953 (0.879–1.032) 0.234 Site of disease 0.633 (0.329–1.336) 0.250 1.060 (0.541–2.075) 0.771 0.799 (0.369–1.731) 0.570 0.670 (0.318–1.412) 0.292 Neoadjuvant therapy 0.457 (0.222–0.940) 0.033 0.921 (0.365–2.322) 0.861 0.320 (0.152–0.674) 0.003 0.456 (0.226 − 0.922) 0.029 UICC I/II vs III 0.876 (0.462–1.626) 0.656 1.668 (0.843–3.330) 0.142 0.937 (0.470–1.870) 0.880 0.844 (0.435–1.636) 0.597
Table 3. Multivariate analysis of factors associated with serum PlGF and EGF levels. Abbreviations: BMI, body mass index; UICC, Union Internationale Contre le Cancer; PlGF, Phosphatidylinositol-glycan biosynthesis class F protein/Placental growth factor; EGF, epidermal growth factor.
OR 0.320; 95% CI 0.152–0.674; p = 0.003, Supplementary Table S4). Serum EGF levels were significantly lower in patients who had received neoadjuvant chemotherapy in the VC (OR 0.456; 95% CI 0.226–0.922; p = 0.029) but not in the TC. The UICC stage did neither influence serum PlGF nor EGF serum levels.
prognostic impact of serum plGF and eGF levels. Overall survival. Within the follow-up periods of 6.8 years (+/− 3.9, TC) and 4.7 years (+/− 2.1, VC), 54 patients (24.7%) and 42 patients (25.0%) died, respec- tively. Of the clinical variables, only age >70 years (TC: p = 0.009; VC p < 0.001) and UICC III (TC: p = 0.065;
VC: p = 0.013) were significantly associated with impaired OS on univariate survival analysis. Serum PlGF levels correlated significantly with OS in the VC only (TC: p = 0.630; VC: p = 0.020) when using the median as cutoff (Fig. 1); stronger results were seen when using the 75th percentile as cutoff (Supplementary Fig. S3) (Figs 1,2).
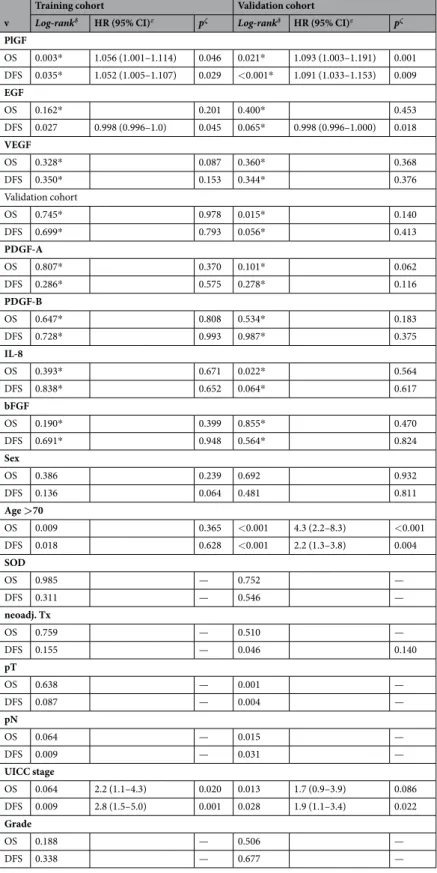
EGF (Fig. S2, Supplementary Figs S2 & S4), VEGF, PDGF-A/B, and bFGF serum levels failed to show any sig- nificant influence on OS. Additionally, low Ang1 (p = 0.015) and elevated IL-8 (p = 0.022) were associated with reduced OS in the VC. In the multivariate Cox regression model, adjusted for age, sex, SOD and UICC stage, only elevated PlGF (>75th percentile) was significantly associated with reduced OS in both cohorts (TC: Hazard ratio (HR): 1.056; 95% CI 1.001–1.114; p = 0.046; VC: HR 1.093; 95% CI 1.003–1.191; p = 0.001). The data for cutoffs other than the median showed similar results and are reported in Supplementary Figs S1–S4.
Disease-free survival. A total of 31 patients (14.2%) in the TC and 37 (22.0%) in the VC developed recurrent disease within the follow-up period. Univariate analysis identified age >70 (TC: p = 0.018; VC: p < 0.001), UICC stage (TC: p = 0.009; VC: p = 0.028) and neoadjuvant therapy in the VC (p = 0.046), but not in the TC, as prog- nostic factors for DFS. Of the measured angiogenic factors, serum PlGF levels significantly correlated with DFS in the VC cohort (TC: p = 0.324; VC p = 0.024) when using the median as cutoff (Fig. 1), when using the 75th per- centile as cutoff, significant effects were seen in both cohorts (Supplementary Fig. S3). Similarly, serum EGF levels correlated with DFS significantly in the VC (TC: p = 0.299; VC p < 0.01, Fig. 2); these effects were even stronger when using the 75th percentile as cutoff (Supplementary Fig. S4). Multivariate analysis showed elevated PlGF to be associated with worse DFS in both cohorts (TC: HR 1.052; 95% CI 1.005–1.107; p = 0.029; VC: HR 1.091; 95% CI 1.033–1.153; p = 0.009). Conversely, elevated serum EGF significantly predicted longer DFS in both cohorts (TC:
HR 0.998; 95% CI 0.996–1.000; p = 0.045; VC: HR 0.998; 95% CI 0.996–1.000; p = 0.018). Serum VEGF, Ang1, PDGF-A/B, IL-8 and bFGF levels did not show any influence on DFS (Table 4). Again, the 75th percentile as cutoff exhibited the strongest effects. The results for other cutoffs are given in Supplementary Figs S1–S4, significance levels for all analyses are reported in Supplementary Table S5. Of note, no synergistic effects of PIGF and EGF Figure 1. Prognostic effect of serum PlGF levels on overall and disease-free survival in training and validation cohorts. Survival analysis for serum PlGF levels in the training and validation cohorts for overall survival and disease-free survival (log-rank test). Abbreviations: PIGF, Phosphatidylinositol-glycan biosynthesis class F protein/Placental growth factor.
were found (Supplementary Table S6) and the inclusion of neoadjuvant therapy in the Cox proportional hazard model does not significantly change the results reported above (Supplementary Table S7).
prognostic impact of intratumoral plGF and eGF expression. Given the prognostic relevance of serum PlGF (OS + DFS) and EGF (DFS), we hypothesized that these cytokines may be produced by tumor cells and thus analyzed their prognostic role in two publically available, independent cohorts: The Affymetrix cohort with 550 CRC patients of all stages and expression data from Affymetrix microarrays24, and the TCGA cohort with 463 CRC patients of all stages and RNA expression data generated via RNAseq25. In both cohorts, our find- ings were independently confirmed (Fig. 3).
There was no influence of EGFR expression levels on the prognostic value of EGF in both cohorts (Supplementary Fig. S5). In patients with non-metastatic disease in the Affymetrix cohort, PlGF expression higher than the median showed a tendency towards being a negative prognostic factor for overall survival, but failed to reach statistical sig- nificance (p = 0.193; HR 1.45; 95% CI 0.83–2.55). In the same patients, EGF proved to be a positive prognostic factor for overall survival (p = 0.019; HR 0.51; 95% CI 0.29–0.9). For disease-free survival, both factors were confirmed as negative (PlGF, p = 0.036; HR 2.14; 95% CI 1.03–4.45) and positive (EGF, p = 0.041; HR 0.48; 95% CI 0.23–0.99) prognostic factors. There was no data on disease recurrence available for the TCGA cohort.
When including metastatic patients, PlGF and EGF expression again showed the same prognostic effects as demon- strated before: While PlGF was a negative prognostic factor for overall survival in both the Affymetrix and the TCGA cohorts (Affymetrix cohort: p = 0.0013; HR 1.59; 95% CI 1.2–2.11; TCGA cohort: p = 0.0091; HR 1.74; 95% CI 1.14–
2.64), EGF was a significant positive prognostic factor for overall survival in the Affymetrix cohort (p = 0.0022; HR 0.65; 95% CI 0.49–0.86) und but not in the TCGA cohort (p = 0.32; HR 0.81; 95% CI 0.54–1.23) (Fig. 4).
Discussion
This study demonstrates elevated serum PlGF levels to be a negative prognostic factor for OS and DFS in non-metastatic CRC patients. This prognostic association was demonstrated in two independent patient cohorts.
Additionally, elevated serum EGF levels are associated with favorable DFS, but not OS, in both cohorts. Serum VEGF, Ang1, PDGF-A/B, IL-8 and bFGF levels did not predict OS or DFS on multivariate analysis. Our find- ings suggest that quantification of serum PlGF and EGF may be useful for preoperative risk stratification of patients with non-metastatic CRC. On tissue RNA level, identical prognostic effects could be demonstrated for both cytokines in two other independent cohorts with expression data measured via microarray and RNA next generation sequencing, respectively, thus strongly confirming the data from our own cohorts.
Figure 2. Prognostic effect of serum EGF levels on overall and disease-free survival in training and validation cohorts. Survival analysis for serum EGF levels in the training and validation cohorts for overall survival and disease-free survival (log-rank test). Abbreviations: EGF, epidermal growth factor.
v
Training cohort Validation cohort
Log-rankδ HR (95% CI)ε pζ Log-rankδ HR (95% CI)ε pζ PlGF
OS 0.003* 1.056 (1.001–1.114) 0.046 0.021* 1.093 (1.003–1.191) 0.001 DFS 0.035* 1.052 (1.005–1.107) 0.029 <0.001* 1.091 (1.033–1.153) 0.009 EGF
OS 0.162* 0.201 0.400* 0.453
DFS 0.027 0.998 (0.996–1.0) 0.045 0.065* 0.998 (0.996–1.000) 0.018 VEGF
OS 0.328* 0.087 0.360* 0.368
DFS 0.350* 0.153 0.344* 0.376
Validation cohort
OS 0.745* 0.978 0.015* 0.140
DFS 0.699* 0.793 0.056* 0.413
PDGF-A
OS 0.807* 0.370 0.101* 0.062
DFS 0.286* 0.575 0.278* 0.116
PDGF-B
OS 0.647* 0.808 0.534* 0.183
DFS 0.728* 0.993 0.987* 0.375
IL-8
OS 0.393* 0.671 0.022* 0.564
DFS 0.838* 0.652 0.064* 0.617
bFGF
OS 0.190* 0.399 0.855* 0.470
DFS 0.691* 0.948 0.564* 0.824
Sex
OS 0.386 0.239 0.692 0.932
DFS 0.136 0.064 0.481 0.811
Age >70
OS 0.009 0.365 <0.001 4.3 (2.2–8.3) <0.001
DFS 0.018 0.628 <0.001 2.2 (1.3–3.8) 0.004
SOD
OS 0.985 — 0.752 —
DFS 0.311 — 0.546 —
neoadj. Tx
OS 0.759 — 0.510 —
DFS 0.155 — 0.046 0.140
pT
OS 0.638 — 0.001 —
DFS 0.087 — 0.004 —
pN
OS 0.064 — 0.015 —
DFS 0.009 — 0.031 —
UICC stage
OS 0.064 2.2 (1.1–4.3) 0.020 0.013 1.7 (0.9–3.9) 0.086
DFS 0.009 2.8 (1.5–5.0) 0.001 0.028 1.9 (1.1–3.4) 0.022
Grade
OS 0.188 — 0.506 —
DFS 0.338 — 0.677 —
Table 4. Survival analysis of factors associated with serum PlGF and EGF levels. δP-values using the univariate log-rank test, median was used as a cutoff for PlGF and EGF; εHazard ratio (HR) and 95% confidence
interval (CI) for the multivariate Cox regression model; ζp-values of the multivariate Cox regressions model;
*75%-percentile was used as a cutoff. Abbreviations: BMI, body mass index; UICC, Union Internationale Contre le Cancer; PlGF, Phosphatidylinositol-glycan biosynthesis class F protein/placental growth factor; EGF, epidermal growth factor; SOD, site of disease; OS, overall survival; PFS, progression free survival.
The currently available body of evidence on PlGF and EGF in CRC is limited. Gomceli et al. reported high PlGF to be prognostic for local recurrence but not OS in non-metastatic CRC, thus supporting our findings29. Contradictory to our present finding of PlGF as a negative prognostic marker, previously published data from our own group demonstrated PlGF to be of positive prognostic value for recurrence-free survival in metastatic CRC30. However, different cutoffs were chosen in the metastatic cohort previously published and only patients with PlGF levels >90th percentile experienced favorable survival. Additionally, PlGF indicated only favorable disease-free survival and was not associated with overall survival. Moreover, the previously published data are from metastatic patients undergoing liver resection for CRC metastases, representing a different patient cohort as well as a dif- ferent microenvironment in hepatic metastases. These differences in the angiogenic microenvironment between hepatic metastases and the primary colorectal tumor have resulted in anti-VEGF treatment to be used only in metastatic disease and may thus also explain the different effects of PlGF in different disease stages. This disparity in tumor biology is emphasized by data indicating that primary tumor cell lines produced more PlGF than cell lines from metastatic CRC31.
PlGF stimulates the chemotactic migration of human mesenchymal progenitor cells and stimulates neovas- cularization via the VEGF pathway, especially under hypoxic conditions32,33, and facilitates vessel growth and maturation34. PlGF is able to independently activate endothelial cells and synergizes with VEGF in driving angi- ogenesis12,35. In addition to angiogenesis, PlGF influences intratumoral macrophage polarization towards an immunosuppressive phenotype via the VEGF1 pathway36. Furthermore, PlGF, but not VEGF-A or VEGF-B, is increased in obesity15,36. Our data confirmed a correlation of PlGF levels with obesity and may partly explain the clinically well-known unfavorable outcome of obese cancer patients15,36. While the data presented here is insufficient to confirm PlGF as the reason for the more malignant biology of cancer in obese patients, they clearly warrant further studies on this matter.
An interesting finding is the markedly increased PlGF level in patients after neoadjuvant therapy. The addition of bevacizumab, a humanized, monoclonal antibody targeting VEGF-A, to chemoradiation in the neoadjuvant setting for non-metastatic rectal cancer has limited benefit, which may indicate escape mechanisms to bevaci- zumab treatment37,38. As PlGF is elevated during neoadjuvant therapy and able to activate the VEGF signaling axis independent of VEGF-A or -B39, it may act as a mediator of such escape mechanisms after bevacizumab-mediated VEGF depletion. This theory is supported by the activity of PlGF inhibitors in anti-VEGF-resistant tumors40,41. Figure 3. Prognostic effect of PlGF and EGF RNA expression on overall and disease-free survival in non- metastatic disease in the Affymetrix microarray cohort. Survival analysis for PlGF and EGF expression levels in non-metastatic disease in the Affymetrix cohort for overall survival and disease-free survival (log-rank test). Survival analyses with different cutoffs are displayed in Supplementary Fig. S6. Abbreviations: PIGF, Phosphatidylinositol-glycan biosynthesis class F protein/Placental growth factor; EGF, epidermal growth factor.
Consequently, elevated PlGF may be a negative predictive factor in this setting and if so, agents targeting VEGF signaling downstream of PlGF may be of more benefit than bevacizumab. This question needs to be addressed in future clinical trials investigating neoadjuvant anti-angiogenic therapy in rectal cancer.
In addition to PlGF, our data identified elevated serum EGF levels as a positive prognostic factor in CRC.
The biological role of EGF in CRC is currently unclear. Although intuitively it should act as a negative prog- nostic factor due to its activation of the MAPK/RAS/RAF signaling cascade, previous studies were unable to demonstrate a correlation between serum EGF levels and prognosis in CRC21 and the here presented study even observed a positive correlation. In breast cancer, the prognostic value of EGF is also a matter of debate while most studies point toward a positive correlation between serum EGF levels and prognosis42,43. The EGF receptor (EGFR, HER1, ErbB1) is a receptor for ligands of the epidermal growth factor family.
Other receptors in this family include HER2 (ErbB2), HER3 (ErbB3) and HER4 (ErbB4)44. Upon ligand binding, receptors of the HER family form homo- or heterodimers, thus potentiating the MAPK activation as compared to their activity as monomers44. Ligands of the EGF family include EGF, Heparin-binding EGF-like growth factor (HB-EGF), transforming growth factor-α (TGF-α), Amphiregulin (AR), Epiregulin (EPR), Epigen, Betacellulin (BTC), neuregulin-1 (NRG1), neuregulin-2 (NRG2), neuregulin-3 (NRG3) and neuregulin-4 (NRG4)45. While EGFR is activated by EGF, HB-EGF, TFG-α, AR, EPR, BTC and Epigen, neuregulins activate HER3 and HER4 and no ligand is known for HER244, suggesting a role of HER2 as a co-receptor transactivated by EGFR ligands. In summary, the EGF ligand and receptor families form a complex and incompletely understood network. The reason for the positive prognostic role of EGF is still unknown and leaves room for speculation: Dropping EGF serum levels after resection of CRC suggest the origin of elevated EGF levels within the tumor46. Low intratumoral MAPK/RAS/RAF signaling activity, suggesting low proliferative activity of the tumor cells and thus favorable prognosis, may lead to compensa- tory EGF excretion in tumor cells. Interestingly, EGF seems to be a prognostic factor in CRC independently of both activating RAS/RAF mutations and cetuximab treatment47, suggesting a role of EGF outside of the MAPK/RAS/RAF axis, possibly adding a second explanatory approach. Clearly, further research investigat- ing the role of EGF in CRC is needed.
In this study, we compared the prognostic effects of serum proteins in some cohorts (TC and VC) and the prognostic effects of the respective mRNA levels in other cohorts. The correlation between mRNA and pro- tein levels is highly dependend on the stability of both mRNA and protein. While in steady state mRNA the Figure 4. Prognostic effect of PlGF and EGF RNA expression on overall survival in patients of all stages in the Affymetrix microarray and TCGA RNAseq cohorts. Survival analysis for PlGF and EGF expression levels in patients of all stages in the Affymetrix and TCGA cohorts for overall survival (log-rank test). Survival analyses with different cutoffs are displayed in Supplementary Fig. S7. Abbreviations: PIGF, Phosphatidylinositol-glycan biosynthesis class F protein/Placental growth factor; EGF, epidermal growth factor; TCGA, The Cancer Genome Atlas.
concordance between mRNA and protein abundance is 100%, the concordance between mRNA and protein variation is significantly lower48. Despite this, we found highly concordant prognostic effects between groups with protein and mRNA data; however, the comparison between mRNA and protein levels can still be considered a limitation of this study.
The here presented study includes a prospective training cohort and an independent prospective validation cohort which confirmed the main findings of the training cohort, thus representing high quality evidence. In addition, most findings could be validated in two more large cohorts, thus adding to the high level of evidence.
The conclusions are clinically relevant, but the underlying molecular biology is still poorly understood. Therefore, molecular studies investigating the mechanistic principles as well as prospective clinical trials involving different centers and patient collectives are required prior to implementation of PlGF and EGF serum testing in clinical routine.
In summary, this study suggests preoperative serum PlGF and EGF levels as prognostic factors in non-metastatic CRC. The prognostic value of these cytokines in two independent prospective and another two independent retrospective cohorts supports their evaluation in larger multi-center studies on preoperative risk stratification and may ultimately enable clinicians to identify subgroups of patients who may benefit from adju- vant therapy while sparing others the side effects of potentially unnecessary systemic treatment.
Data Availability
All authors declare that they had full access to all information and data published in this article. These data have not been published elsewhere.
References
1. Torre, L. A. et al. Global cancer statistics, 2012. CA Cancer J Clin 65, 87–108, https://doi.org/10.3322/caac.21262 (2015).
2. Weitz, J. et al. Colorectal cancer. Lancet 365, 153–165, https://doi.org/10.1016/S0140-6736(05)17706-X (2005).
3. Cunningham, D. et al. Colorectal cancer. Lancet 375, 1030–1047, https://doi.org/10.1016/S0140-6736(10)60353-4 (2010).
4. Vantaku, V. et al. Large-scale profiling of serum metabolites in African American and European American patients with bladder cancer reveals metabolic pathways associated with patient survival. Cancer 125, 921–932, https://doi.org/10.1002/cncr.31890 (2019).
5. Jiao, L. et al. A Prospective Targeted Serum Metabolomics Study of Pancreatic Cancer in Postmenopausal Women. Cancer prevention research, https://doi.org/10.1158/1940-6207.CAPR-18-0201 (2019).
6. Li, X. Z., Zhang, S. N. & Yang, X. Y. Serum-based metabolomics characterization of patients with reticular oral lichen planus. Arch Oral Biol 99, 183–189, https://doi.org/10.1016/j.archoralbio.2019.01.019 (2019).
7. Angelucci, A., Delle Monache, S., Cortellini, A., Di Padova, M. & Ficorella, C. “Vessels in the Storm”: Searching for Prognostic and Predictive Angiogenic Factors in Colorectal Cancer. International journal of molecular sciences 19, https://doi.org/10.3390/
ijms19010299 (2018).
8. Kahlert, C. et al. Prognostic impact of a compartment-specific angiogenic marker profile in patients with pancreatic cancer.
Oncotarget 5, 12978–12989, https://doi.org/10.18632/oncotarget.2651 (2014).
9. Amara, C. S. et al. Serum Metabolic Profiling Identified a Distinct Metabolic Signature in Bladder Cancer Smokers: A Key Metabolic Enzyme Associated with Patient Survival. Cancer epidemiology, biomarkers & prevention: a publication of the American Association for Cancer Research, cosponsored by the American Society of Preventive Oncology, https://doi.org/10.1158/1055-9965.
EPI-18-0936 (2019).
10. Carmeliet, P. et al. Synergism between vascular endothelial growth factor and placental growth factor contributes to angiogenesis and plasma extravasation in pathological conditions. Nature medicine 7, 575–583, https://doi.org/10.1038/87904 (2001).
11. De Falco, S., Gigante, B. & Persico, M. G. Structure and function of placental growth factor. Trends Cardiovasc Med 12, 241–246 (2002).
12. Autiero, M. et al. Role of PlGF in the intra- and intermolecular cross talk between the VEGF receptors Flt1 and Flk1. Nature medicine 9, 936–943, https://doi.org/10.1038/nm884 (2003).
13. Gobble, R. M., Groesch, K. A., Chang, M., Torry, R. J. & Torry, D. S. Differential regulation of human PlGF gene expression in trophoblast and nontrophoblast cells by oxygen tension. Placenta 30, 869–875, https://doi.org/10.1016/j.placenta.2009.08.003 (2009).
14. Luttun, A. et al. Revascularization of ischemic tissues by PlGF treatment, and inhibition of tumor angiogenesis, arthritis and atherosclerosis by anti-Flt1. Nature medicine 8, 831–840, https://doi.org/10.1038/nm731 (2002).
15. Pervanidou, P. et al. Increased placental growth factor (PlGF) concentrations in children and adolescents with obesity and the metabolic syndrome. Hormones (Athens) 13, 369–374, https://doi.org/10.14310/horm.2002.1491 (2014).
16. Ribatti, D. The discovery of the placental growth factor and its role in angiogenesis: a historical review. Angiogenesis 11, 215–221, https://doi.org/10.1007/s10456-008-9114-4 (2008).
17. Rahbari, N. N. et al. Expression and prognostic value of circulating angiogenic cytokines in pancreatic cancer. BMC cancer 11, 286, https://doi.org/10.1186/1471-2407-11-286 (2011).
18. Seow, H. F., Yip, W. K. & Fifis, T. Advances in targeted and immunobased therapies for colorectal cancer in the genomic era. Onco Targets Ther 9, 1899–1920, https://doi.org/10.2147/OTT.S95101 (2016).
19. Schlessinger, J. Cell signaling by receptor tyrosine kinases. Cell 103, 211–225 (2000).
20. Kato, Y. et al. Bmk1/Erk5 is required for cell proliferation induced by epidermal growth factor. Nature 395, 713–716, https://doi.
org/10.1038/27234 (1998).
21. Lee, W. S., Baek, J. H., You, D. H. & Nam, M. J. Prognostic value of circulating cytokines for stage III colon cancer. The Journal of surgical research 182, 49–54, https://doi.org/10.1016/j.jss.2012.08.051 (2013).
22. Karabulut, M. et al. Evaluation of epidermal growth factor receptor serum levels and their association with clinicopathological characteristics in patients with colorectal cancer. Mol Clin Oncol 7, 787–797, https://doi.org/10.3892/mco.2017.1405 (2017).
23. McShane, L. M. et al. Reporting recommendations for tumor marker prognostic studies (remark). Exp Oncol 28, 99–105 (2006).
24. Garcia, S. A. et al. LDB1 overexpression is a negative prognostic factor in colorectal cancer. Oncotarget 7, 84258–84270, https://doi.
org/10.18632/oncotarget.12481 (2016).
25. Cancer Genome Atlas, N. Comprehensive molecular characterization of human colon and rectal cancer. Nature 487, 330–337, https://doi.org/10.1038/nature11252 (2012).
26. Hadley, W. The Split-Apply-Combine Strategy for Data Analysis. Vol. 40 (2011).
27. Mihaly, Z. et al. A meta-analysis of gene expression-based biomarkers predicting outcome after tamoxifen treatment in breast cancer. Breast cancer research and treatment 140, 219–232, https://doi.org/10.1007/s10549-013-2622-y (2013).
28. Glickman, M. E., Rao, S. R. & Schultz, M. R. False discovery rate control is a recommended alternative to Bonferroni-type adjustments in health studies. Journal of clinical epidemiology 67, 850–857, https://doi.org/10.1016/j.jclinepi.2014.03.012 (2014).
29. Gomceli, I. et al. Is serum placental growth factor a prognostic marker for stage III colorectal cancer patients? Hepato- gastroenterology 59, 1437–1440, https://doi.org/10.5754/hge11393 (2012).
30. Rahbari, N. N. et al. Correlation of circulating angiogenic factors with circulating tumor cells and disease recurrence in patients undergoing curative resection for colorectal liver metastases. Annals of surgical oncology 18, 2182–2191, https://doi.org/10.1245/
s10434-011-1761-9 (2011).
31. Abajo, A. et al. Identification of colorectal cancer metastasis markers by an angiogenesis-related cytokine-antibody array. World journal of gastroenterology: WJG 18, 637–645, https://doi.org/10.3748/wjg.v18.i7.637 (2012).
32. Fiedler, J., Leucht, F., Waltenberger, J., Dehio, C. & Brenner, R. E. VEGF-A and PlGF-1 stimulate chemotactic migration of human mesenchymal progenitor cells. Biochemical and biophysical research communications 334, 561–568, https://doi.org/10.1016/j.
bbrc.2005.06.116 (2005).
33. Ahmed, A., Dunk, C., Ahmad, S. & Khaliq, A. Regulation of placental vascular endothelial growth factor (VEGF) and placenta growth factor (PIGF) and soluble Flt-1 by oxygen–a review. Placenta 21(Suppl A), S16–24 (2000).
34. Freitas-Andrade, M., Carmeliet, P., Charlebois, C., Stanimirovic, D. B. & Moreno, M. J. PlGF knockout delays brain vessel growth and maturation upon systemic hypoxic challenge. Journal of cerebral blood flow and metabolism: official journal of the International Society of Cerebral Blood Flow and Metabolism 32, 663–675, https://doi.org/10.1038/jcbfm.2011.167 (2012).
35. Verheul, H. M. & Pinedo, H. M. Possible molecular mechanisms involved in the toxicity of angiogenesis inhibition. Nat Rev Cancer 7, 475–485, https://doi.org/10.1038/nrc2152 (2007).
36. Incio, J. et al. PlGF/VEGFR-1 Signaling Promotes Macrophage Polarization and Accelerated Tumor Progression in Obesity. Clinical cancer research: an official journal of the American Association for Cancer Research 22, 2993–3004, https://doi.org/10.1158/1078- 0432.CCR-15-1839 (2016).
37. Banerjee, S. & Cunningham, D. Targeted therapies as adjuvant treatment for early-stage colorectal cancer: first impressions and clinical questions. Clinical colorectal cancer 9(Suppl 1), S28–35, https://doi.org/10.3816/CCC.2010.s.004 (2010).
38. Petrelli, F. et al. Efficacy of oxaliplatin-based chemotherapy + bevacizumab as first-line treatment for advanced colorectal cancer: a systematic review and pooled analysis of published trials. American journal of clinical oncology 38, 227–233, https://doi.org/10.1097/
COC.0b013e3182a2d7b8 (2015).
39. Itatani, Y., Kawada, K., Yamamoto, T. & Sakai, Y. Resistance to Anti-Angiogenic Therapy in Cancer-Alterations to Anti-VEGF Pathway. International journal of molecular sciences 19, https://doi.org/10.3390/ijms19041232 (2018).
40. Fischer, C. et al. Anti-PlGF inhibits growth of VEGF(R)-inhibitor-resistant tumors without affecting healthy vessels. Cell 131, 463–475, https://doi.org/10.1016/j.cell.2007.08.038 (2007).
41. Van de Veire, S. et al. Further pharmacological and genetic evidence for the efficacy of PlGF inhibition in cancer and eye disease. Cell 141, 178–190, https://doi.org/10.1016/j.cell.2010.02.039 (2010).
42. Kim, J. W. et al. Serum epidermal growth factor is associated with prognosis and hormone receptor status in patients with HER2- positive metastatic breast cancer treated with first-line trastuzumab plus taxane chemotherapy. Cancer chemotherapy and pharmacology 72, 1023–1029, https://doi.org/10.1007/s00280-013-2268-9 (2013).
43. Revillion, F., Lhotellier, V., Hornez, L., Bonneterre, J. & Peyrat, J. P. ErbB/HER ligands in human breast cancer, and relationships with their receptors, the bio-pathological features and prognosis. Annals of oncology: official journal of the European Society for Medical Oncology/ESMO 19, 73–80, https://doi.org/10.1093/annonc/mdm431 (2008).
44. Rubin, I. & Yarden, Y. The basic biology of HER2. Annals of oncology: official journal of the European Society for Medical Oncology/
ESMO 12(Suppl 1), S3–8 (2001).
45. Dreux, A. C., Lamb, D. J., Modjtahedi, H. & Ferns, G. A. The epidermal growth factor receptors and their family of ligands: their putative role in atherogenesis. Atherosclerosis 186, 38–53, https://doi.org/10.1016/j.atherosclerosis.2005.06.038 (2006).
46. Grieco, M. J. et al. Minimally invasive colorectal resection is associated with a rapid and sustained decrease in plasma levels of epidermal growth factor (EGF) in the colon cancer setting. Surgical endoscopy 24, 2617–2622, https://doi.org/10.1007/s00464-010- 1018-x (2010).
47. Hatch, A. J. et al. Blood-based markers of efficacy and resistance to cetuximab treatment in metastatic colorectal cancer: results from CALGB 80203 (Alliance). Cancer Med 5, 2249–2260, https://doi.org/10.1002/cam4.806 (2016).
48. Zhang, B. et al. Proteogenomic characterization of human colon and rectal cancer. Nature 513, 382–387, https://doi.org/10.1038/
nature13438 (2014).
Acknowledgements
This study was conceived by Prof. Moritz Koch, who passed away in 2015. This paper is dedicated to his memory. The authors thank Melanie Bernhard, Maria Thomalla-Starzl, and Marzena Knyssok-Sypniewski for outstanding technical assistance. This work was funded by the KFO 227 program (Clinical Research Group 227: Colorectal cancer: from primary tumor progression towards metastases (WE 3548/4–1/2) of Deutsche Forschungsgemeinschaft (DFG).
Author Contributions
Sebastian Schölch: study design and supervision, data collection, statistical analysis, data interpretation, drafting of the manuscript. Andreas Bogner: data collection, statistical analysis, data interpretation, drafting of the manuscript. Ulrich Bork: data collection, data interpretation, critical revision of manuscript. Mohammad Rahbari: data collection, data interpretation, critical revision of manuscript. Balázs Győrffy: data interpretation, statistical analysis, critical revision of manuscript. Martin Schneider: data collection, data interpretation, critical revision of manuscript. Christoph Reissfelder: study design and supervision, data interpretation, critical revision of manuscript. Jürgen Weitz: study design and supervision, data interpretation, critical revision of manuscript.
Nuh N. Rahbari: study design and supervision, statistical analysis, data interpretation, drafting of the manuscript
Additional Information
Supplementary information accompanies this paper at https://doi.org/10.1038/s41598-019-47429-5.
Competing Interests: The authors declare no competing interests.
Publisher’s note: Springer Nature remains neutral with regard to jurisdictional claims in published maps and institutional affiliations.
Open Access This article is licensed under a Creative Commons Attribution 4.0 International License, which permits use, sharing, adaptation, distribution and reproduction in any medium or format, as long as you give appropriate credit to the original author(s) and the source, provide a link to the Cre- ative Commons license, and indicate if changes were made. The images or other third party material in this article are included in the article’s Creative Commons license, unless indicated otherwise in a credit line to the material. If material is not included in the article’s Creative Commons license and your intended use is not per- mitted by statutory regulation or exceeds the permitted use, you will need to obtain permission directly from the copyright holder. To view a copy of this license, visit http://creativecommons.org/licenses/by/4.0/.
© The Author(s) 2019