THESES OF DOCTORAL (PhD) DISSERTATION
KAPOSVÁR UNIVERSITY
FACULTY OF ANIMAL SCIENCES Department of Animal Genetics and Biotechnology
Head of Doctoral School MELINDA KOVÁCS
Correspondent Member of the Hungarian Academy of Sciences
Supervisor:
ISTVÁN NAGY Senior researcher
PUREBRED AND CROSSBRED BREEDING VALUES FOR SOME PERFORMANCE TRAITS OF
ECONOMICALLY IMPORTANT PIG BREEDS
Written by
HENRIETTA NAGYNÉ KISZLINGER
Kaposvár 2014
1. INTRODUCTION, AIMS
Basis of continuous performance improvement of all farm animals is the estimation of genetic abilities as accurately as possible, selection of valuable animals for breeding, planned mating of breeding animals and the production of progeny as basis for further selection.
The size of pig livestock in Hungary began to decrease dramatically from the 90th of the last century, and by our days it hardly exceeds the number of 3 million individuals (KSH, 2014). By such low number it is essential that the most precise method is to choose for selection of breeding animals. The Hungarian pig breeding value estimation was based for over 50 years on the Hazel index (HAZEL, 1943), of which biggest disadvantage was that it restrictedly accounted for environmental effect, and the estimations were based on phenotypic performance. It concludes that the results were biased, and the values of the breeding animals were only valid in the herds where the measurements had been conducted. This method did not either enabled the ranking of animals between herds.
While the Hazel index method was the solely applied method until the 90th among the Hungarian pig breeders, the surrounding countries introduced the BLUP method worked out by HENDERSON (1975) which eliminated the disadvantages of the applied index method. Since the 90th each breeding animal obtained a BLUP index besides the Hazel evaluation, but the BLUP method only became official in 2008.
In the vertical structure of pig breeding the proportion of crossbred animals increases downwards which made it necessary to include also the crossbred performance in the breeding value estimation. Selection at nucleus level affects performance at the commercial level in dependence on the genetic correlation between purebred and crossbred performance
(BRANDT és TÄUBERT, 1998; NEWMAN és mtsai, 2010). WONG et al (1971) dealt with the question whether selection of purebred animals should be based on the performance of purebred or crossbred progeny.
WEI et al (1991) studied the association between performance of purebred and crossbred offspring. They concluded that regression of crossbred performance on the purebred performance is influenced by the allele frequencies of the parental lines and the dominance.
To the important question, how crossbred performance is influenced if selection of parents is based either on the performance of purebred or that of crossbred progeny, WEI et al (1991) found the following. Selection based on purebred and crossbred performance influences the crossbred performance in the same direction if rpc is positive. On the contrary, if rpc
is negative, crossbred performance changes in positive direction based on crossbred performance, but in negative direction if choosing purebred information.
WEI and van der WERF (1994) proposed the possibility that in order to increase crossbred performance, considering both purebred and crossbred information could be useful. They regarded purebred and crossbred performance as separate traits studying the genetic correlation between them. They found that if rpc approaches zero, the crossbred performance can be developed more efficiently using combined purebred-crossbred selection. Only if rpc is close to 1 can be achieved better result with purebred selection.
The current breeding value estimation method treats the breed as fixed effect, thus only breed effect can be estimated. All breeds included in the model will obtain the same genetic parameters which might bias the breeding values. In addition, approximately the 40-50 % of the breeding pigs is crossbred (NÉBIH, 2013). However, only purebred breeding values have been estimated for the purebred animals, although crossbred breeding
values could be estimated, too, through the crossbred relationship, which might affect the selection decision.
Aims:
1. Estimation of genetic parameters for growth traits in purebred and crossbred sire pig breeds.
2. Estimation of genetic parameters for growth traits in purebred and crossbred dam pig breeds.
3. Estimation of genetic parameters for reproduction traits in purebred and crossbred dam pig breeds.
4. Estimation of genetic trends and breeding value stability for growth traits in purebred and crossbred sire pig breeds.
5. Estimation of genetic trends and breeding value stability for growth traits in purebred and crossbred dam pig breeds.
6. Estimation of genetic trends and breeding value stability for reproduction traits in purebred and crossbred dam pig breeds.
2. MATERIALS AND METHODS
1. Estimation of genetic parameters for growth traits in purebred and crossbred sire pig breeds
The analysis was based on the data collected by the National Institute for Agricultural Quality Control (presently Agricultural Agency of Administration) in the course of field test conducted between 1997-2010.
The analyzed breeds were the Pietrain (Pi), Duroc (Du) and their cross (Pi x Du), and Hampshire (Ha) and its cross with Pietrain (PixHa) (Table 1).
The total number of animals in the pedigree file for the (PixHa) and (Pi x Du) genotypes was 42004 and 60926, respectively.
In the field test ultrasonic (SONOMARK 100) fat depth measurements were taken from boars and gilts between 80 and 110 kg between the 3rd and 4th lumbar vertebrae (8 cm laterally from the spinal cord), between the 3rd and 4th rib (6 cm laterally from the spinal cord) and the loin muscle area between the 3rd and 4th rib (6 cm laterally from the spinal cord). Using these measurements lean meat percentage can be calculated as follows:
h =56.333381 - 0.122854 x sz1 - 0,786312 x sz2 + + 0,006160 x sz2 x sz2 + 0,237677 x k2
where
h = lean meat %
sz1 backfat depth between 3. és 4. lumbar vertebra, mm;
sz2 backfat depth between 3. és 4. ribs, mm;
k2 loin depth at sz2 measurement point, mm
Age and body weight (with an accuracy of 1 kg) of the animals were recorded at the same time from which their average daily gain was also calculated. The regulations of animal housing and feeding conditions are defined in the Hungarian Pig Performance Testing Code (MGSZH, 2009).
Basic descriptive statistics were calculated applying SAS (SAS Inst. Inc., Cary, NC) (Table 2). Genetic parameters of average daily gain and the lean meat percentage were estimated separately by REML method using the PEST (Groeneveld, 1990) (only for data coding) and VCE5 software (Kovac and Groeneveld, 2003) applying two-trait animal models. Average daily gain and lean meat percentage records of the purebred and crossbred pigs were considered as separate traits. Altogether two runs were performed. The structure of the animal model was the following:
+
+
+
=
2 1 2 1 2 1 2
1 2 1 2
1 2 1 2
1
e e c
c W 0
0 W a
a Z 0
0 Z b
b X 0
0 X y
y
where y = vector of observations, b = vector of fixed effects, a = vector of random animal effects, c = vector of common litter effects, e = vector of random residual effects, and X, Z and W are incidence matrices relating to fixed effects, random animal effects and random common litter effects, respectively.
2. Estimation of genetic parameters for growth traits in purebred and crossbred dam pig breeds
The analysis was based on the data collected by the National Institute for Agricultural Quality Control (presently Agricultural Agency of Administration) in the course of field test conducted between 1997-2010.
The analyzed breeds were the Hungarian Large White (MNF) (n = 232 755), the Hungarian Landrace (ML) (n = 100 321) and the reciprocal cross (MNF x ML) (n = 223 899). Hungarian Large White pigs were kept in 120 herds, Hungarian Landrace in 64 herds, and the cross in 130 herds.
Purebred and crossbred animals were kept partly in the same herds. The study covered 5 generations beginning from the individuals with measurements. The number of animals in the pedigree related to the database MNF – MNF x ML 508 009, that of animals related to the database ML – MNF x ML 393 707.
Analyzed traits were average (lifetime) daily gain, lean meat percentage and age. In the performance testing traits were measured the same way written in the previous analyse. Besides, housing and feeding occurred based on the regulations of the Hungarian Pig Performance Testing Code (MGSZH, 2009).
Basic descriptive statistics were calculated applying SAS (SAS Inst. Inc.
2004). Purebred and crossbred performance were treated as separate traits.
Genetic parameters of average daily gain, lean meat percentage and age were estimated separately by REML method using the PEST (Groeneveld, 1990) (only for data coding) and VCE6 software (Groeneveld et al, 2008) applying two-trait animal models. Altogether six runs were performed.
The structure of the animal model corresponds with that described in the previous analyse. For the trait age the body weight was considered as a covariant.
3. Estimation of genetic parameters for reproduction traits in purebred and crossbred dam pig breeds
The analysis was based on the data collected by the National Institute for Agricultural Quality Control (presently Agricultural Agency of
Administration) in the course of field test conducted between 2001 and 2010. The analyzed breeds were the Hungarian Large White, the
Hungarian Landrace and their reciprocal cross. Number of herds was 102, 45 and 80 for HLW, HL and the cross, respectively. Analyzed traits were age at firs insemination (ÉEI), number of piglets born alive (ÉMSZ), gestation length (VH), and farrowing interval (KI). 10.5 % and 9.6 % of the sires and 14 % and 20.6 % of the sows had both purebred and crossbred progeny from the breed HWL and HL, respectively. The
purebred and crossbred pigs were kept partly in the same herds that means there was overlap among the herds mentioned above. The magnitude of the overlap was 43.3 % for HLW and the cross and 11.6 % for HL and the cross. Parity ranged between 1 and 17. The analyzed traits were age at first insemination (ÉEI), number of born alive piglets (ÉMSZ), gestation length (VH) and farrowing interval (KI). The pooled data was divided in two subsets, each of them contained records of one purebred genotype and that of the cross. The analyzed records of the purebred and crossbred pigs were considered as separate traits. Genetic parameters were estimated
separately by REML method using the PEST (Groeneveld, 1990) and VCE6 software (Groeneveld et al., 2008) applying two-trait repeatability models for ÉMSZ, VH, KI, and two trait animal model for ÉEI. The records were set to a missing value when not observed in the following intervals: for VH 105-125 days, for KI 139-290 days and for ÉEI 150-450 days. Altogether eight runs were performed. The structure of repeatability model for ÉMSZ, VH, KI, and the animal model for ÉEI was the
following:
+
+
+
=
2 1 2 1 2 1 2
1 2 1 2
1 2 1 2
1
e e pe
pe W 0
0 W a
a Z 0
0 Z b
b X 0
0 X y
y
+
+
=
2 1 2 1 2 1 2
1 2 1 2
1
e e a
a Z 0
0 Z b
b X 0
0 X y
y
where y = vector of observations, b = vector of fixed effect, a = vector of random animal effects, pe= vector of random permanent environmental effects, and X, Z and W are incidence matrices relating to fixed effects, random animal effects and random permanent environmental effects, respectively.
In the repeatability model number of farrowing, farrowing year- month and herd (ÉMSZ, VH, KI) were treated as fixed effects, animal and permanent environmental were random effects. In the animal model herd and inseminating year-month were treated as fixed effects, while animal was considered as random effect.
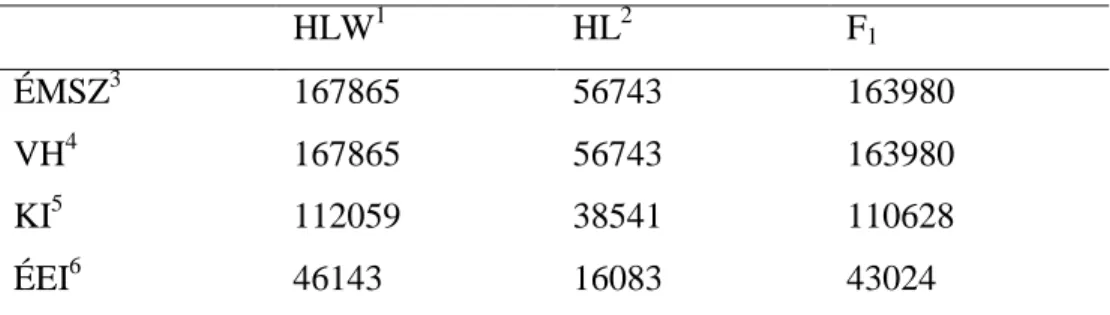
The total number of animals in the pedigree was 126340. The used factors of the models are given in table 1.
table 1. Records of sows for the considered traits
HLW1 HL2 F1
ÉMSZ3 167865 56743 163980
VH4 167865 56743 163980
KI5 112059 38541 110628
ÉEI6 46143 16083 43024
1 Hungarian Large White, 2 Hungarian Landrace, 3 number of piglets born alive, 4 gestation length, 5 farrowing interval, 6 age at first insemination
4. Estimation of genetic trends and breeding value stability for growth traits in purebred and crossbred sire pig breeds
Considered breeds were Pietrain, Duroc, Hampshire, and the reciprocal crosses of Pietrain x Duroc and Pietrain x Hampshire. The source of data corresponds that of the 1. study. Analyzed traits were the average (lifetime) daily gain and the lean meat percentage. Purebred and crossbred performance were treated as separate traits. Descriptive statistics were calculated applying SAS (SAS Inst. Inc. 2004). Significant differences between breeds were assessed applying SAS (SAS Inst. Inc. 2004) using GLM procedure. Genetic parameters of average daily gain and lean meat percentage were estimated separately by REML method using the PEST (Groeneveld, 1990) (only for data coding) and VCE6 software (Groeneveld et al, 2008) applying two-trait animal models. Altogether two runs were performed for both traits. In the model year-month, sex, and herd were considered fixed effects while animal and random litter were treated as random effects.
Genetic trends were estimated for average daily gain and lean meat content based on the annual means of breeding values of the analyzed traits linearly regressed on the years of birth using SAS. Genetic trends of purebred pigs were calculated on the basis of their purebred and crossbred breeding values for every trait, while genetic trends of crossbred pigs were calculated only based on their crossbred breeding values. Comparison of purebred and crossbred genetic trends was done according to Mead et al.
(1993) in case of significant trends in couples.
Stability of the breeding values: because of the small datasets the purebred Pi, Du and Ha pigs were ranked for the entire period. Stability of breeding values was characterized by the common representatives of the top 100
sires and 1000 dams based on the purebred and crossbred breeding values for every trait. Taking the top 100 and 1000 pigs based on the purebred and crossbred breeding values the difference of the breeding values using the crossbred breeding values of the same pigs were also calculated.
5. Estimation of genetic trends and breeding value stability for growth traits in purebred and crossbred dam pig breeds
Analyzed breeds were the Hungarian Large White, the Hungarian Landrace and their reciprocal cross. The source of data corresponds that of 2. study. Further the method is the same used in the 4. study. Only the breeding value stability was calculated in a different way: for reason of large datasets the Hungarian Large White and Hungarian Landrace purebred pigs were annually ranked for average daily gain and lean meat percentage based on their purebred and crossbred breeding values.
6. Estimation of genetic trends and breeding value stability for reproduction traits in purebred and crossbred dam pig breeds
Data for age of first insemination, number of piglets born alive, and the farrowing interval is identical to the source of 4. study. The software and models used to calculate descriptive statistics, estimate genetic parameters and breeding values also correspond with that written in the 4. study.
Methods of estimation of genetic trends and breeding value stability are the same presented in the 5. study.
3. RESULTS
1. Study
The heritability estimates for average daily gain were moderately high, 0,20±0,02, 0,24±0,02, 0,25±0,03, 0,37±0,06, 0,37±0,02 for Pi, Du, Pi x Du, Ha, Pi x Ha, respectively; lean meat percentage was low heritable, 0,17±0,02, 0,15±0,02, 0,13±0,02, 0,22±0,06, 0,20±0,02 for Pi, Du, Pi x Du, Ha, Pi x Ha, respectively.
The relative importance of random litter effect was extremely high, it exceeded the heritability. The estimates are 0,41±0,01, 0,25±0,01, 0,35±0,01, 0,23±0,03 and 0,25±0,01 for Pi, Du, Pi x Du, Ha, Pi x Ha respectively. For lean meat percentage it was lower: 0,26±0,01, 0,15±0,01, 0,18±0,01, 0,18±0,02, 0,10±0,009 for Pi, Du, Pi x Du, Ha, Pi x Ha respectively.
Genetic correlation between the purebreds and the crossbreds in sire breeds ranged from moderately high to high for average daily gain (0,93±0,15, 0,85±0,12, 0,56±0,14, 0,75±0,12) and from moderate to moderately high for lean meat percentage (0,65±0,16, 0,56±0,16, - 0,38±0,17, 0,48±0,20) for Pi – P ix Du, Du – Pi x Du, Ha – Pi x Ha, Pi – Pi x Ha, respectively.
2. Study
In the maternal breeds I estimated medium to high values for the growth traits. For average daily gain these are 0,24±0,005, 0,21±0,007, 0,26±0,007 and 0,27±0,007, for lean meat percentage 0,28±0,004, 0,33±0,007, 0,36±0,006 and 0,37±0,007 and for age 0,25±0,004, 0,24±0,007, 0,32±0,007 and 0,33±0,007 for HLW, HL and the crosses respectively.
In the maternal breeds I estimated high, for age unusually high random litter effect. These were for average daily gain, lean meat percentage and age as following: 0,29±0,002, 0,33±0,004, 0,29±0,003 and 0,29±0,003; 0,28±0,004, 0,21±0,004, 0,36±0,006 and 0,18±0,002;
0,50±0,002, 0,45±0,004, 0,47±0,003 and 0,48±0,003 for HLW, HL and the reciprocal crosses respectively.
In the maternal breeds basically I got lower estimates for genetic correlations. For average daily gain the values are 0,47±0,03 and 0,37±0,04, for lean meat percentage 0,46±0,03 and 0,28±0,03 for HLW – HLW x HL and HL – HLW x HL, respectively.
3. Study
Age at first insemination was of moderate heritability with large difference between purebreds and crossbreds: 0,28±0,001for HWL;
0,26±0,002 for HL; 0,40±0,001 for the cross from dataset HLW-HLW x HL and 0,41±0,001 for the cross from dataset HL-HLW x HL. Estimated heritability for gestation length both in purebred and crossbred pigs was moderate: 0,30±0,006 for HWL; 0,22±0,009 for HL; 0,25±0,008 for the cross from dataset HLW-HLW x HL and 0,25±0,008 for the cross from dataset HL-HLW x HL, Heritability of NBA and FI was low 0,09±0,004;
0,06±0,005; 0,07±0,004 and 0,06±0,004; 0,06±0,003; 0,06±0,006;
0,06±0,004 and 0,06±0,003 for HWL, HL and for their cross from the two datasets, respectively.
The estimates for permanent environmental effect for gestation length and number of piglets born alive were 0,06±0,01, 0,04±0,01, 0,07±0,01 and 0,07±0,01; 0,06±0,00, 0,06±0,01, 0,06±0,00 and 0,06±0,00 for HLW, HL and the reciprocal cross, while for farrowing interval I estimated zero for all genotypes.
In the reproduction traits the genetic correlations ranged between low to high. I estimated for age at first insemination 0,28±0,055 and 0,39±0,095, for gestation length 0,96±0,018 and 0,82±0,083, for number of piglets born alive 0,82±0,052 and 0,93±0,091 and for farrowing interval 0,65±0,071 and 0,33±0,138.
4. Study
Genetic trends for average daily gain in the sire breeds for purebred breeding value was 0,18-1,62 g/day, for crossbred breeding value it was 0,10-1,96 g/day. For lean meat percentage I estimated -0,003-0,001
%/year and -0,003-0,021 %/year for purebred and crossbred breeding value, respectively. The common number of highest ranked pigs based on the purebred and crossbred breeding values was high (68-97 %) except of hampshire breed where the stability of the breeding value for lean meat percentage was found surprising low (5 %). Calculating the difference between the average crossbred breeding values of the ranked (once on the purebred then on the crossbred breeding value) pigs no remarkable difference could be established in either of both traits.
5. Study
In the maternal breeds the progress for average daily gain and lean meat percentage was 1,84 and 2,51 g/day, 1,50-2,18 g/day and 0,010 and 0,017
%/year, 0,010-0,033 %/year for HLW and HL, respectively. The common number of highest ranked pigs based on the purebred and crossbred breeding values was low and unbalanced both in the HLW and the HL.
Calculating the difference between the average crossbred breeding values of the ranked (once on the purebred then on the crossbred breeding value)
pigs I obtained values up to 15-16 g for average daily gain while for lean meat percentage there was no substantial difference in either of both traits.
6. Study
Purebred and crossbred genetic trends of maternal breeds were as following: -1,59 and -2,61 day/year; -1,57- -4,30 day/year for age at first insemination, 0,01 and 0,03 pig/year; 0,01-0,02 pig/year for number of piglets born alive; -0,38 and -0,84 day/year; -0,36- -1,01 day/year for farrowing interval for HLW and HL, respectively. The common number of highest ranked sows based on the purebred and crossbred breeding values was medium and unbalanced in the breed HLW for age at first insemination while that for HL was medium to high. For the number born alive piglets high stability (89 – 100 %) was found in each of the breeds.
The common number of sows for farrowing interval was little higher for HLW than HL. Differences between the average crossbred breeding values of the annual ranked (once on the purebred then on the crossbred breeding value) pigs were significant both for HLW and HL for age of first insemination (0,9 -7 days), while the differences for farrowing interval were negligible. In the trait number born alive piglets no difference could be confirmed.
4. CONCLUSIONS AND RECOMMANDATIONS
Based on the results the following conclusions can be drawn.
1. Diversity of genetic parameters draws attention to that breeding values estimated by the current model may be biased.
2. Average daily gain and lean meat percentage exhibited different characteristics. In the sire breeds genetic correlations between purebred and crossbred performances for growth traits ranged from low to high, and in accordance changed also the breeding value stability. Based on that it would be useful to consider the crossbred breeding value, too, at least for the lean meat percentage in the course of selection. On the grounds of lower genetic correlations for growth traits in the maternal breeds, usage of the model applied by me was justified in the breeding value estimation.
3. On the Hungarian pig breeding farms observed, non additive effects play a considerable role. Because of moderate genetic correlations, apply of multivariate model which considers purebred and crossbred performance separate traits, would be justified. In addition, in the course of selection of purebred animals for cross breeding crossbred breeding values should be taken into account in order to utilize the plus information at production level.
4. By the genetic correlations between purebred and crossbred performance for reproduction traits usage of crossbred breeding values is not definitely necessary in the trait number of piglets born alive, though crossbred information always improves the breeding goal. I found lower genetic correlations for the age at first insemination and the farrowing
interval. These result are in agreement with the breeding value stability, from which it can be concluded that the solely consideration of purebred breeding value for selection might bias the prediction of abilities in cross breeding.
5. Breeding values for lean meat percentage have been slightly improved, especially in the sire breeds because the variability of this trait was very low in the observed herds. On the contrary, breeding values for average daily gain have progressed to a more remarkable extent both in sire and dam breeds.
6. From among reproduction traits number of piglets born alive is a trait difficult to improve. On the contrary, age of first insemination and farrowing interval exhibited remarkable progress during the observed period of time.
On the whole it can be concluded that the multivariate model using purebred and crossbred performance as separate traits enables a more accurate estimation of genetic parameters and breeding values, thus a faster genetic improvement could be achieved.
5. NEW SCIENTIFIC RESULTS
1. I estimated the genetic correlations between purebred and crossbred performance for average daily gain and lean meat percentage in the economically important sire and dam breeds. I obtained for average daily gain in sire breeds values of 0,56-0,96, for lean meat percentage 0,48-0,65.
In the maternal breeds for average daily gain 0,37 and 0,47, and for lean meat percentage 0,28 and 0,46.
2. I estimated the genetic correlations between purebred and crossbred performance in maternal breeds for age at first insemination (0,28 and 0,39), for number of piglets born alive (0,82 and 0,93), for gestation length (0,82 and 0,96), and for farrowing interval (0,33 and 0,65).
3. I estimated the annual genetic trend of purebred and crossbred breeding values of ecologically important pig breeds for average daily gain and lean meat percentage. Purebred trends for average daily gain in sire breeds:
0,18-1,62 g/day, crossbred trends: 0,10-1,96g/day. For lean meat percentage the values are: -0,003-0,001 %/year and -0,003-0,008 %/year, respectively. Maternal purebred and crossbred genetic trends for average daily gain: 1,84-2,51 g/day and 1,50-2,18 g/day, respectively. For lean meat percentage the trends are: 0,10-0,017 %/year and 0,10-0,033 %/year, respectively.
6. PUBLICATIONS ON THE SUBJECT OF THE DISSERTATION
6.1. Papers published in foreign language
Nagyné Kiszlinger H., Farkas J., Kövér Gy., Onika-Szvath Sz., Nagy I.
(2011). Genetic parameters of growth traits from a joint evaluation of purebred and crossbred pigs. Agriculturae Conspectus Scientificus 76. (3) 223-226.
Nagyné Kiszlinger H., Farkas J., Kövér Gy., Nagy I. (2012). Estimation of purebred and crossbred genetic value in the Hungarian pig population.
Állattenyésztés és Takarmányozás 61. (2) 38-50.
Nagy I., Nagyné Kiszlinger H., Farkas J., Kövér Gy., Czakó B., Gorjanc G. (2012).
Estimation and decomposition of genetic trends in a two-way cross using Hungarian pig breeds. Acta Agriculturae Slovenica 100.(SUPPL.3) 175- 179.
Nagy I., Nagyné Kiszlinger H., Farkas J., Kövér Gy., Czakó B., Gorjanc G. (2012).
Estimation and decomposition of genetic trends in a two-way cross using Hungarian pig breeds. Acta Agriculturae Slovenica 100.(SUPPL.3) 175- 179.
Nagyné Kiszlinger H., Farkas J., Kövér Gy., Götz K.-U., Nagy I. (2012).
Genetische Parameter der Mast- und Schlachtleistungsmerkmale von Reinzucht- und Kreuzungsschweinen unter simultaner Parameterschätzung. Züchtungskunde 84.(3)242-249.
Nagyné Kiszlinger H., Farkas J., Kövér Gy., Nagy I. (2013). Genetic trends and breeding value stability in Hungarian purebred and crossbred maternal pig breeds. Állattenyésztés és takarmányozás 62.(1) 45-51.
Nagyné Kiszlinger H., Farkas J., Kövér Gy., Nagy I. (2013). Selection for reproduction traits in Hungarian pig breeding in a two-way cross. Animal Science Papers And Reports 31. (4). 315-322.