Methodological Background of the New Motor Third-Party Liability Insurance Index of the Magyar Nemzeti Bank*
Gabriella Merész – Norbert Holczinger – Koppány Nagy
In order to provide an accurate description of developments in the Hungarian motor third-party liability insurance (MTPL) market, as well as to inform the public and stimulate competition, the Magyar Nemzeti Bank (the Central Bank of Hungary, MNB) has elaborated an index to indicate the MTPL premium level. The method offers a comprehensive picture of changes in average premiums, as it uses data from the central itemised MTPL database to cover not only the population switching insurers but also remaining contracts and new entrants. It reduces bias due to seasonal effects and trends by eliminating changes in the stock composition. It can also illustrate how much the premium has changed in relation to the change in the magnitude of claims, taking into account the estimated average change in claims. In our study, we present the statistical and methodological considerations used in the calculation of the MTPL index and describe the relevant characteristics of Hungarian MTPLs.
Journal of Economic Literature (JEL) Codes: C18, C51, G14, G22
Keywords: insurance, non-life insurance, motor third-party liability insurance, MTPL index, MTPL premium level, use of claims
1. Introduction
The market for compulsory motor vehicle insurance started on 1 July 1991; up to then it had been a charge built into the price of fuel and thus paid for at every refuelling. Since 1 July 1991, risks have been covered by a standalone, compulsory insurance contract to be taken out separately for each motor vehicle. Motor third- party liability insurance (MTPL) is currently regulated by Act LXII of 2009.1 Due to its compulsory nature, it is the product with the largest number of contracts in the
* The papers in this issue contain the views of the authors which are not necessarily the same as the official views of the Magyar Nemzeti Bank.
Gabriella Merész is a Senior Actuary at the Magyar Nemzeti Bank. Email: mereszg@mnb.hu Norbert Holczinger is a Head of Division at the Magyar Nemzeti Bank. Email: holczingern@mnb.hu Koppány Nagy is a Director at the Magyar Nemzeti Bank. Email: nagykoppany@mnb.hu.
The Hungarian manuscript was received on 18 March 2021.
DOI: http://doi.org/10.33893/FER.20.3.5979
1 Act LXII of 2009 on motor third-party liability insurance https://mkogy.jogtar.hu/jogszabaly?docid=a0900062.TV
Hungarian insurance market, as MTPL accounted for 40 per cent of the 14.5 million insurance contracts outstanding on 31 December 2020. In 2020, the 5.8 million outstanding, in-force contracts accounted for one fifth of the gross premium income (HUF 247 billion) in the non-life segment and for more than one quarter of profit after tax (HUF 23 billion). The pandemic situation played a significant role in the extent of the latter, but even after eliminating the one-off effect of Covid-19, the result would have been substantial, in line with the previous 3-year, sector-level business profit of over HUF 10 billion.
The significant weight of the MTPL business line is not specific to Hungary. Although its extent varies more widely across countries, the product accounts for 16 per cent of total non-life insurance premium income in Europe (EIOPA 2021). Although we were unable to find sufficiently detailed, up-to-date data in the course of our research, previous information suggests that in Central and Eastern Europe, the weight of MTPL contracts regarding non-life insurance segment exceeds the EU average, but this share is decreasing compared to 2004, due to the strengthening of property insurance products (Wieczorek-Kosmala 2016). Premium income in the MTPL market in the countries covered by Insurance Europe grew 1 per cent in 2015 and 4 per cent in 2016 to reach EUR 61 billion. The increase is mainly attributable to Turkey (76 per cent), Poland (43 per cent) and Hungary (34 per cent) (Insurance Europe 2019). Nevertheless, average premiums in Hungary remained below the European average in 2016. There may be several reasons for this, such as different vehicle stock and varying service and labour fees, but a detailed analysis of this is beyond the scope of this study.
Overall, MTPL is a business line that affects a broad cross-section of society and also has a substantial impact on insurers’ performance. It is, therefore, not surprising that the study of this product, and in particular of changes in premiums, is receiving a great deal of attention from the professional community and the wider public.
Prior to 1 January 2010, the announcement of MTPL premiums was concentrated in a campaign period (the November preceding the reference year), which was then replaced by continuous premium announcement. The insurance anniversary for vehicles purchased after the abolition of the single end-of-year anniversary, i.e. after 1 January 2010, is no longer 31 December, but the date on which the MTPL for the vehicle was taken out, which is, of course, a different date during the year for each motorist. This also made it more difficult to compare premiums. However, there was a market and societal need to compare changes in premium levels, i.e. to establish a reference point. In the past, some brokerage firms developed methodologies and published data in this respect, but these cannot give an accurate picture of market developments, as the intermediaries only have information on the contracts they mediate.
The reports produced by international organisations also contain data on the evolution of MTPL premiums, but these cannot usually provide accurate answers to questions about changes in the average premium. Moreover, in our experience, a detailed methodology for the published data is not available, and the frequency of updating the reports is not necessarily sufficient for up-to-date monitoring of developments. The annual Consumer Trends Report published by the European Insurance and Occupational Pensions Authority (EIOPA), for example, only shows the evolution of total premium income, with no information on average premiums (EIOPA 2021). In the case of the data in the report published by the professional organisation of European insurers, the Insurance Europe, the main problem – apart from methodological issues – is the timeliness of data. The last report was published in 2019 (Insurance Europe 2019). However, the wide range of information available to the MNB has made it possible to create a comprehensive MTPL price index that provides a complete, up-to-date overview of changes in average premiums.
In this study, we describe the statistical background of the index, especially the data used for the calculations, and the methodology. In the second section, we present the key features of the central itemised MTPL database (KKTA) created and operated by the MNB, which forms the basis for the calculations, and analyse the data used in the light of the main factors determining the MTPL premium. Section 3 presents the methods used to determine the premium level of the MTPL index, while fourth section considers the indicators for the average premium level of other vehicle categories. In the fifth section, some weaknesses of the method are discussed, and the results are then described in the sixth section.
2. Available data
According to the amendment to Act LXII of 2009 on MTPL, adopted in the autumn of 2018, the itemised motor third-party liability insurance contracts and claims database (KKTA) created and operated by the MNB will assist all actors in the MTPL market. In addition to supervisory use, insurers performing KKTA data supply can request aggregated data. Motor third-party liability insurance contracts and claims are submitted to the KKTA in an itemised form on a quarterly basis by insurers obliged to supply data. Since 1 January 2011, the database has been collecting data on all domestic MTPL contracts and claims, with a level of detail adapted to legal and professional actuarial standards. The system currently has data available on nearly 22 million contracts and 1.5 million claims; thus, the database offers a wide range of possibilities for actuarial calculations and analyses.
Data quality requirements are ensured by a three-level data check. Submission of data is possible if the format of the data is in accordance with the XSD schema available on the MNB’s website.2 If data provision has passed the formal check, the next step is a content check for acceptance, in the course of which the system checks the completeness of the required data and basic quality compliance. In the last step, content errors that do not prevent acceptance are displayed to the MNB, which may request correction if a content error is confirmed. This three-step check ensures that the data is correct and usable. Despite the automatic processes built into the system, data quality problems cannot be completely ruled out, but the checks carried out by the MNB’s experts and the multi-stage review of the data used for publications minimise the likelihood of major errors.
We are not aware of a supervised database with the same level of detail, but it is worth noting a similar example from abroad. In Estonia, there is a register of MTPL contracts, which contains contracts for Estonian vehicles and insurance events occurring in Estonia. The database includes a number of queries, such as information on the claims history of a vehicle, the validity of motor third-party liability insurance, or even a map showing the location of claims. The queries are available free of charge.3
The KKTA provides a comprehensive database of the full range of contracts in the market at the end of the given period (quarter), including new contracts and those in which the insurer did not change. Since MTPL insurance is required by law, we obtain a nearly complete picture of the motor vehicles in use. This is true even if we know that not all motor vehicles have an MTPL contract. Indeed, based on the available data, the number of uninsured motor vehicles is relatively low, at around 2 per cent (MABISZ 2020), i.e. the database covers virtually all domestic motor vehicles. Our goal is to create a metric that objectively measures changes in premiums. Objectivity also requires that the impact of portfolio composition changes on premiums be eliminated from the data. To this end, we examined in detail the portfolio of domestic MTPL contracts, which consisted of 5.8 million contracts as on 31 December 2020. The segment affecting the population, and within it, passenger cars accounted for 69 per cent of the portfolio in terms of the number of cars and 65 per cent of it in terms of the 12-month regular premium4 as at 31 December 2020 (see Figure 1).
2 The technical guidelines for the central itemised MTPL database (KKTA) are available on the MNB’s website.
https://www.mnb.hu/felugyelet/adatszolgaltatas/biztositok/2018-evre-vonatkozo-adatszolgaltatasok/a- kozponti-kgfb-teteles-adatbazis-kkta-technikai-segedletei
3 Motor Insurance Register, Eesti.ee. https://www.eesti.ee/en/traffic/traffic-management/motor-insurance /#motorinsuranceregister8
4 12-month regular premium: the premium for insurance policies valid during a given period for one insurance period (one year) in the insurer’s statistics.
The MTPL index measures the changes in the average premium of passenger cars;
thus, in the following, we look at the data on MTPL contracts for passenger vehicles.
For each contract, the number of contracts with an anniversary date in the given quarter is known, which shows strong seasonality due to the campaign period previously regulated (before 2010). One fifth of the contracts are still linked to what is known as ‘31 December – 1 January’5 or calendar anniversary stock. This stock differs significantly from the others in terms of its characteristics, as it consists mostly of contracts in bonus-malus ratings B8 and B10, and the vehicle keepers are older persons. The composition of vehicles is also different from the average, as the overall portfolio composition has shifted towards more powerful vehicles in recent years, while these motor vehicles are typically less powerful. The specific characteristics of the portfolio are also reflected in the insurance premiums; thus, if we examine the quarterly series, and changes in premiums during the year, seasonal and trend-like effects can cause bias (see Section 3 for details). In order to analyse the average premium level and to draw the right conclusions, it is thus necessary to eliminate these effects.
5 Although the initial recognition date for these contracts is 1 January, for administrative reasons, some insurers set 31 December as the anniversary date, while other institutions set 1 January.
Figure 1
Distribution of the number and 12-month regular premium of MTPL contracts by main vehicle type at 31 December 2020
65%
15%
3% 8%
9%
69%
0 20 40 60 80 100
0 20 40 60 80 100
12-month regular premium Number of contracts
Per cent Per cent
CarsPower assisted bicycles Trucks
Lorries
Motors Trailers, semi-trailers Slow-moving vehicles Other
Source: MNB
Before further investigation, it is useful to clarify the principles of premium calculation. The insurance premium is the compensation given for services and claims payments provided by the insurer, i.e. for risk bearing. In simple terms, we can think of the insurance premium as being something that should include, as a minimum, cover for claims and technical risks, called the risk premium part, plus the insurers’ costs, profit expectation and tax liability, also known as the entrepreneurial premium part. The traditional calculation of premiums is based on mathematical models; the most commonly used and simplest principle for calculating non-life insurance premiums is the expected value principle. Traditional non-life insurance premium calculation techniques are reviewed by Arató (2001).
For passenger car MTPL premiums, insurers apply a number of differentiating factors, which are basically related to the vehicle keeper or the insured motor vehicle. In our experience, the most important elements are:
• the vehicle keeper’s – age
– place of residence – bonus-malus rating
– the date the vehicle keeper obtained the driving licence (driving experience)
• the vehicle’s – make
– engine power – fuel type – age
As the KKTA does not cover all of the above criteria (MNB 2018) and does not include information on driving experience and the vehicle’s make, fuel and age, we are not in a position to analyse their evolution over time. However, it is possible to examine the stability of the stock in relation to the other elements. We have chosen the first quarter of 2016 as the starting point, because for the sake of stable results, this is also the period that (1) represents a time series of sufficient length to provide a benchmark for the MTPL index, and (2) is less distant in time from the introduction of the KKTA, thereby increasing the reliability of the data. The last data are from the fourth quarter of 2020, allowing us to examine the evolution and possible seasonality of the above factors over the last five years.
The age of vehicle keepers can be considered stable over the time span under review, with changes of 1–2 percentage points in the six age groups we have examined. For example, the weight of the 40–49-year-old age group, i.e. the largest group of vehicle keepers, has ranged between 26 and 27 per cent throughout the period (Figure 2).
Regional distribution is similar, i.e. the address distribution of vehicle keepers is stable in terms of regions: the share of those with a Budapest address ranged between 15.6 and 16.5 per cent in the period under review, which represents a minimal shift (Figure 3).
Figure 2
Distribution of MTPL contracts by age of vehicle keeper
0
2016Q1 2016Q2 2016Q3 2016Q4 2017Q1 2017Q2 2017Q3 2017Q4 2018Q1 2018Q2 2018Q3 2018Q4 2019Q1 2019Q2 2019Q3 2019Q4 2020Q1 2020Q2 2020Q3 2020Q4
10 20 30 40 50 60 70 80 90 100
0 10 20 30 40 50 60 70 80 90
Per cent Per cent 100
<30 30–39 40–49 50–59 60–69 70+
Source: MNB
Figure 3
Regional distribution of MTPL contracts (capital – countryside)
0
2016Q1 2016Q2 2016Q3 2016Q4 2017Q1 2017Q2 2017Q3 2017Q4 2018Q1 2018Q2 2018Q3 2018Q4 2019Q1 2019Q2 2019Q3 2019Q4 2020Q1 2020Q2 2020Q3 2020Q4
10 20 30 40 50 60 70 80 90 100
0 10 20 30 40 50 60 70 80 90
Per cent Per cent 100
Budapest Non-Budapest Source: MNB
By contrast, there has been a major shift in the engine power of insured passenger cars in recent years towards more powerful passenger vehicles (Figure 4). This phenomenon is well illustrated by the fact that the share of cars with an engine power of 71 kW or more was only 40.9 per cent in the first quarter of 2016, which rose to 53.7 per cent by the fourth quarter of 2020.
The bonus-malus (BM) rating cannot be considered constant over time (Figure 5), as it typically varies depending on the claims in the given year: in the case of no claims, the rating will improve year by year until it reaches the most favourable category (B10), whereas if damage occurs, the rating goes down by 2 categories all the way to category M4. In addition to the anniversary bonus-malus variation, the seasonal effect of the calendar anniversary stock mentioned earlier is also important. To exclude these, variations in the bonus-malus ratings need to be addressed.
Figure 4
Distribution of MTPL contracts by engine power of insured motor vehicle
0
2016Q1 2016Q2 2016Q3 2016Q4 2017Q1 2017Q2 2017Q3 2017Q4 2018Q1 2018Q2 2018Q3 2018Q4 2019Q1 2019Q2 2019Q3 2019Q4 2020Q1 2020Q2 2020Q3 2020Q4
10 20 30 40 50 60 70 80 90 100
0 10 20 30 40 50 60 70 80 90
Per cent Per cent 100
Car 0–37 kW
Car 71–100 kW Car 101–180 kWCar 38–50 kW Car 181– kWCar 51–70 kW Source: MNB
Thus, our analysis suggests that among the principal factors affecting the MTPL premium, bonus-malus rating and vehicle power have changed substantially over time, i.e. they may bias the results when we examine changes in average premiums.
For this reason, these effects should be eliminated in the premium change analysis.
By contrast, the age and regional distribution of vehicle keepers remains stable over time and therefore do not affect the analysis of the changes in premiums and the interpretation of the results.
3. Index relating to the average premium level for passenger cars
The purpose of creating the MTPL index was to define a measure that would allow the public to be informed about changes in average premiums. In this context, it was also important to condense the information properly. To achieve this, an index showing the average variation in percentage terms was deemed an appropriate choice. It is not overly complex; hence no insurance expertise is needed to interpret it, but it does describe the market and its developments well.
Figure 5
Distribution of MTPL contracts with an anniversary date in the respective quarter by BM rating of the insured motor vehicle
0
2016Q1 2016Q2 2016Q3 2016Q4 2017Q1 2017Q2 2017Q3 2017Q4 2018Q1 2018Q2 2018Q3 2018Q4 2019Q1 2019Q2 2019Q3 2019Q4 2020Q1 2020Q2 2020Q3 2020Q4
10 20 30 40 50 60 70 80 90 100
0 10 20 30 40 50 60 70 80 90
Per cent Per cent 100
M4–M1 A0 B1–B9 B10
Source: MNB
3.1. Average premium level
For the sake of stable results, the base for the MTPL index is the first quarter of 2016, which (1) represents a time series of sufficient length, and (2) is less distant in time from the introduction of the KKTA, increasing the reliability of the data. In the calculation, out of the outstanding and in-force or suspended contracts at the end of the given quarter, essentially those with a positive 12-month regular premium and an anniversary date in the given quarter were taken into account. This also includes those new contracts for which the initial recognition date is in the given quarter. We looked at the 12-month regular premium of these contracts in terms of forint value, summed it up and divided it by the number of contracts to obtain the average 12-month regular premium. This allows us to observe the actual changes in the average 12-month regular premium.
There is significant seasonality in the current values: due to the aforementioned calendar anniversary stock, in the year-end roll-over campaign, the fourth and first quarters all have lower average premiums. In our view, this effect should be eliminated from the data set, as it strongly biases the results. To do this, as a first step, we tried to smooth out the curve by using a simple moving average, i.e. the average of the previous three quarters. What we found, however, is that although this procedure dampens the seasonal effects, it does not remove them, but only prolongs them. In other words, it is not able to follow market changes adequately;
noticeable changes can be seen only after a time lag or with a delay. A good example of the lagged effect is the incorporation of insurance tax into the MTPL premiums,
Figure 6
Current average premium values for passenger cars and their moving average
10,000 20,000
0 30,000 40,000 50,000 60,000
2016Q1 2016Q2 2016Q3 2016Q4 2017Q1 2017Q2 2017Q3 2017Q4 2018Q1 2018Q2 2018Q3 2018Q4 2019Q1 2019Q2 2019Q3 2019Q4 2020Q1 2020Q2 2020Q3 2020Q4
Current Moving average HUF
Source: MNB
which can be identified by a comparison of average premiums in 2018 and 2019 (Figure 6).
3.2. Smoothing the average premiums for passenger cars
Several parameters were considered in the data to determine whether there could be observed marked stock transformation over the five years under review, or significant seasonality in the anniversary ratio (see Section 2). On this basis, the composition of passenger cars by power category and the seasonality caused by the old campaign period need to be smoothed out in order to arrive at a premium level. This smoothing is performed by projection on the stock composition, i.e.
based on our preliminary analysis, at the end of the given quarter, we clarify the stock in relation to two factors for passenger car power ratings and bonus-malus rating. This adjustment also corrects for changes in the average premium level due to the transformation of stock composition by power rating; as described earlier, the composition has been moving from lower towards higher powered vehicles. With this composition, we smooth out the previous quarters, multiplied by the effective average 12-month regular premiums of anniversary contracts in the current quarter concerning the segments (Figure 7). Therefore, this shows us what the average premium would have been for previous periods, if in previous quarters, there had been a stock composition corresponding to the current stock composition at the end of the quarter. The query is based on quarterly updated data, and the stock composition may change; hence the back data may also be subject to modification.
These are always taken into account in the method, because filtering applies to contracts that are outstanding and have an anniversary date (start) at the end of the given quarter. First, we considered the entire passenger car stock, including fleet vehicles and also those not in normal use. Fleet contracts, however, are typically calendar anniversary contracts, which may cause seasonal bias; moreover, their risks may differ from those of individual contracts. The latter is also true for passenger cars not in normal use, as it includes, for example, taxis, which have a different risk from that of normal-use, ordinary cars. Hence, in order to achieve the most robust and reliable results possible, the stock covered by the index was limited to individual and normal-use vehicles. Thus, we confined ourselves to residential contracts for the most part.
For the aforementioned reasons, the index was calculated not only for the total domestic stock, but also for a Budapest and non-Budapest disaggregation (Figure 8).
Several approaches were explored as to what regional groupings might be useful.
We found, however, that further disaggregation of areas outside the capital into county seats and other cities does not provide much additional information compared to the ‘non-Budapest’ disaggregation: both the absolute value of average premiums and their variation show a very similar picture.
Figure 7
MTPL index compared to the current average premium value and its moving average
10,000 20,000
0 30,000 40,000 50,000 60,000
2016Q1 2016Q2 2016Q3 2016Q4 2017Q1 2017Q2 2017Q3 2017Q4 2018Q1 2018Q2 2018Q3 2018Q4 2019Q1 2019Q2 2019Q3 2019Q4 2020Q1 2020Q2 2020Q3 2020Q4
Current Moving average Index
HUF
Source: MNB
Figure 8
MTPL index in Budapest and non-Budapest
10,000 20,000 0 30,000 40,000 50,000 60,000 70,000 80,000
2016Q1 2016Q2 2016Q3 2016Q4 2017Q1 2017Q2 2017Q3 2017Q4 2018Q1 2018Q2 2018Q3 2018Q4 2019Q1 2019Q2 2019Q3 2019Q4 2020Q1 2020Q2 2020Q3 2020Q4
Budapest Non-Budapest Total
HUF
Source: MNB
In the fourth quarter of 2020, the national average premium for normal-use passenger cars was HUF 44,523, while in Budapest it was HUF 63,213, compared to the premium of HUF 38,908 for contracts outside the capital. Budapest premiums are thus much higher, a phenomenon explained by the different risks involved. Our calculations show that the difference in premiums can be almost entirely attributed to the difference in damage probabilities.
3.3. Adjusted MTPL index
In addition to establishing the MTPL index, we also created a so-called adjusted index, which shows a kind of net premium level change. Indeed, the interpretation of nominal changes in MTPL premiums may in itself be misleading, since – because of the equivalence principles mentioned above – the premiums are required to follow the movements in the insurer’s expected expenses, such as claims expenditure and costs, also including tax payments.
For motor third-party liability insurance – under various headings – a tax liability has been incurred since 2013. The rules on the accident tax were contained in Chapter II of Act CIII of 2011 on the Public Health Product Tax (Neta Act). The amount was collected by the insurers from the clients and was forwarded by them to the state; thus, it had to be paid to the insurer together with the insurance premium or instalment, but administratively, the insurance premium and the tax were separated. The basis of the tax was the annual motor third-party liability insurance premium, and the tax rate, in principle, was 30 per cent of the annual MTPL premium. However, there was an upper limit, according to which the annual tax could not exceed HUF 83 per day per motor vehicle, which the insurer had to charge for each day of the period of risk bearing involved: thus, the tax rate was maximised.
From 2019, the legislative background changed: due to the changes to the tax law announced for 2019, the accident tax was abolished from 1 January 2019, and gradually replaced by the insurance tax with the anniversary of the MTPL contracts.
In 2019, this tax type was incorporated into the premiums, meaning that the two items are no longer separate; hence the tax change represents a jump in relation to the average premium level. However, this amount received is paid by the insurers to the budget in the form of a tax after collection. The premium level increase due to the one-off tax effect should be ignored, as this phenomenon can lead to incorrect conclusions.
To exclude the tax effect, we looked at the tax rate to be taken into account for the average 12-month regular premiums instead of the itemised adjustment, since the KKTA only includes the premium plus insurance tax (12-month regular premium), and not the premium without tax. We therefore examined on a group-by-group basis, whether 23 per cent of the 12-month regular premium or the daily limit of
HUF 83 determines the insurance tax. Based on itemised data filtered for different months, we estimated the effective, empirical value of the tax (i.e. taking into account the daily limit of HUF, 83 in addition to the 23 per cent tax rate) at 21 per cent, and, to reflect this simplification, adjusted the index values after 31 March 2019 by 21 per cent.
Another important component of the adjustment is the estimated claims expenditure for the given segment at the time of index calculation. The total claims expenditure is the combined amount of the overall claims payment volume for each claim and the RBNS reserve applicable for the given reference date (and for annuitants, even the annuity reserve and the annuities paid), less the value of recovery and regress reserve, to which the insurer is entitled in the case of statutory conditions. We looked at these amounts in terms of forint value.
In some cases, the increase in the average premium may be due to non-insurance- specific developments. This could include an increase in the euro exchange rate, which has an impact (1) on international claims settlements, but more importantly, (2) on the costs of servicing and repairing motor vehicles. This is often reflected in the price of spare parts mostly purchased from abroad. There is also an increase in the labour costs for damage repair. The bias effect due to a possible increase in claims expenditure per contract can also be adjusted.
However, claims settlement is a time-consuming process, as there can be a considerable time lag between the incurrence and the reporting or actual claims payment. This necessitated an estimate of already incurred, but not yet reported claims. Therefore, for each quarter, we looked at the amount of claims expenditure for the quarter of incurrence in the given quarter: we examined the run-off of claims in a kind of claims-run-off triangle. In this, the amount in a given row was the total claims expenditure for claims incurred in the relevant quarter, with the diagonal showing the claims expenditure recognised and/or paid in the quarter of incurrence. We analysed the dynamics of how the claims expenditure for the quarter of incurrence compares to the total claims expenditure incurred in a given quarter. The dynamics show a substantial divergence in the last four quarters, as the full run-off is not yet visible in these quarters (Figure 9).
The closer this value is to 100 per cent, the higher the percentage of the total claims expenditure is in the quarter of incurrence. This becomes higher and higher as we get closer to the current quarter, since we do not yet have data for those that would appear in, say, quarters 2 to 4 after the incurrence. Thus, we looked at the claims expenditure for the quarter in which the claims were incurred as a percentage of the total claims expenditure in the quarters preceding the last four quarters. An overall ratio was calculated from the average of these values. In order to also take into account late claims reporting or the effects of claims reviews, we multiplied the data for the last four quarters by this value. This is how we obtained the total claims expenditure for each quarter. The value of claims expenditure also includes the reserves built up; thus, when a claim is paid, the actual payment may be higher or lower than this, or, in practice, there are reserve reviews that may result in significant reserve release or build-up. This phenomenon may even lead to large fluctuations in the claims expenditure, with a seasonal effect due to the typically year-end review of reserves. To exclude this bias effect, moving-average smoothing was applied (Figure 10). The decline in the last four quarters is likely to reflect the impact of the coronavirus, i.e. the effect of reduced turnover due to working from home and curfew restrictions can be seen. The impact of this will be felt in the long term, but it shows up here too.
Figure 9
Ratio of claims expenditure for the quarter of incurrence compared to total claims expenditure
20 40
0 60 80 100 120 Per cent
2016Q1 2016Q2 2016Q3 2016Q4 2017Q1 2017Q2 2017Q3 2017Q4 2018Q1 2018Q2 2018Q3 2018Q4 2019Q1 2019Q2 2019Q3 2019Q4 2020Q1 2020Q2 2020Q3 2020Q4
Source: MNB
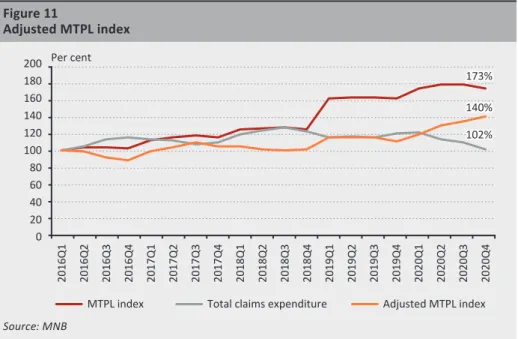
When calculating the MTPL index for the average 12-month regular premiums, we also took into account changes in the composition of annual and infra-annual stocks, the impact of which may also affect claims. As there are today a higher proportion of more powerful vehicles on the roads compared to the first quarter of 2016, we can also assume that larger vehicles cause more damage. Therefore, we adjusted the value of the claims expenditure with the current stock composition, more precisely, with the bonus-malus and the vehicle power, thus obtaining the estimated claims expenditure corresponding to today’s stock composition for the previous quarters. In other words, we also used this to calculate the average claims expenditure for a given contract. The obtained values were compared to the first quarter of 2016, and the MTPL index was divided by the resulting number. This is the adjusted MTPL index (Figure 11).
Figure 10
Changes in claims expenditure per stock
20 40
0 60 80 100 120 140 160 Per cent
2016Q1 2016Q2 2016Q3 2016Q4 2017Q1 2017Q2 2017Q3 2017Q4 2018Q1 2018Q2 2018Q3 2018Q4 2019Q1 2019Q2 2019Q3 2019Q4 2020Q1 2020Q2 2020Q3 2020Q4
Moving average - original Moving average weighted by portfolio, 8 quarters Moving average weighted by portfolio, 4 quarters
Source: MNB
Using the itemised database, the method can show not only the population switching insurers, but also the evolution of the 12-month regular premium of the remaining contracts and new entrants, thus providing a more detailed picture of the market premium level. On the other hand, the adjusted index shows the index without tax and claims expenditure, which essentially reflects how much of the increase in the average 12-month regular premium is not explained by the increase in tax and claims expenditure.
4. Other vehicles
The change in passenger car premiums directly affects the largest part of the population, but the evolution of the average MTPL premium for other types of vehicles may also be of interest. The distribution of fleet and individual contract premiums is different for these other vehicle categories, as most of the trucks and trailers used for transport belong are covered by fleet contracts concluded by transport companies with individual offers. This is also the case for the stock of larger buses. In view of this, other vehicles with the largest stocks are examined separately. For these vehicles, we distinguish between the average 12-month regular premium and number of units for the total stock and for individual contracts, and also highlight the types of vehicles with a larger stock. For these categories, instead of looking at the quarterly change, we look at the annual change, comparing the current quarterly average premiums with the same period of the previous year to exclude seasonality due to the calendar anniversary. Since the basis of comparison is the previous year, and not the first quarter of 2016 used for the MTPL index, the effect of the insurance tax is not present,
Figure 11
Adjusted MTPL index
140%
173%
102%
20 40 0 60 80 100 120 140 160 180 200 Per cent
2016Q1 2016Q2 2016Q3 2016Q4 2017Q1 2017Q2 2017Q3 2017Q4 2018Q1 2018Q2 2018Q3 2018Q4 2019Q1 2019Q2 2019Q3 2019Q4 2020Q1 2020Q2 2020Q3 2020Q4
MTPL index Total claims expenditure Adjusted MTPL index Source: MNB
as the premiums of the earlier years taken as a basis of comparison already include it.
In the case of the first publication, the basis for comparison is the anniversary stock in the fourth quarter of 2019, the 12-month regular premium of which already includes the tax effect; thus, this does not alter the comparison.
For other MTPL vehicles, it was decided to use a narrower data set, and therefore, in the public publication we present figures for the units, average premium and annual change for the vehicle relating to normal-use passenger cars and taxis, motorcycles, mopeds, buses (with a breakdown into smaller and larger buses, as their premiums are quite different), lorries, trucks and heavy trailers. These categories are shown both on an individual and on a fleet basis.
5. Limitations of the model
The MTPL index measures the changes in average premiums and thus condenses information. Premiums for individual contracts can differ markedly from the average premium; in fact, the degree of their change can also vary considerably from the average. We looked at how 12-month regular premiums are distributed by bonus- malus rating. The empirical distribution of premiums shows that market pricing is not concentrated around an average value, but that there are also 12-month regular premiums even quite far from the average. Currently, most of the contracts fall into bonus-malus categories A0 and B10; hence we present the results for these two BM ratings in Figure 12.
Figure 12
Distribution of passenger car premiums for A0 and B10 BM ratings by HUF 5000 interval; 31 December 2020
50,000, 0, 100,000, 150,000, 200,000, 250,000, 300,000, 350,000, 400,000,
<=5,000 5,001–10,000 10,001–15,000 15,001–20,000 20,001–25,000 25,001–30,000 30,001–35,000 35,001–40,000 40,001–45,000 45,001–50,000 50,001–55,000 55,001–60,000 60,001–65,000 65,001–70,000 70,001–75,000 75,001–80,000 80,001–85,000 85,001–90,000 90,001–95,000 95,001–100,000 100,001–105,000 105,001–110,000 >110,000 B10
A0 Pieces
HUF
Source: MNB
It is clear that while the B10 stock with a favourable claims experience is more concentrated at a lower average 12-month regular premium level, this can show much higher values typically for vehicle keepers who are new to the market.
One possible way of excluding the above phenomenon is to use a model-point approach, i.e. to look at the premium variation for type contracts. A similar methodology is used by insurers in the case of the annual cost ratio (ACR) to be calculated for savings life insurance policies, where the calculations need to be made for an insured person aged 35 (MNB 2015). However, for the MTPL, we believe that the index can provide more accurate information. The primary reason for this is that the number of parameters used to calculate premiums for MTPL contracts is several times higher than the number of assumptions used for savings life insurance policies, making it difficult to define the parameters of a typical contract. The other reason is that – unlike life insurance policies – in the case of MTPL, the KKTA provides the opportunity to create a representative index.
For claims expenditures, a 5-year data period may not necessarily cover the time span for total late claims, but the claims history is expanded with each passing quarter. Other limitations of the model include the fact that quarterly data provision does not yet capture contracts where the month turn is the last day of the 3rd month in the quarter and the new 12-month regular premium will only apply from the first day of the following quarter. These are negligible in quantity and do not bias the MTPL index materially. With several insurers, the 12-month regular premium for the March anniversary contracts are still included in the KKTA with the reference date of the previous year. For this reason, the actual quarterly premiums are not obtained on the reference date at the end of the quarter. Also, the premiums for the current quarter containing the month of the anniversary are usually higher than what we see in the following quarters. This may be explained by the higher average premium for cancellations in the period following the anniversary date, particularly cancellations due to non-payment of premiums. If contract holders with a higher average premium ‘do not pay’, they are cancelled; thus, their average premium is omitted from the next quarterly query. Finally, we have not considered the potentially significant exchange rate impact of cross-border claims. Thus, it can be seen that the model has several limitations, but we believe that none of them causes a serious bias in the results.
6. Conclusions
In this study, we described the methodology and statistical and mathematical background of the MTPL index. In our opinion, the main advantage of the index is that it expresses the changes in average premiums in a concise and understandable way. It is also informative in the sense that it employs the current stock composition by bonus-malus rating and vehicle type, and is sufficiently comprehensive in that it uses the itemised data available in the database since the first quarter of 2016.
The adjusted MTPL index shows how the index has changed without the tax effect and in proportionality to claims expenditures.
The results indicate that in the fourth quarter of 2020, average MTPL premiums were 73 per cent higher than the average premiums in the first quarter of 2016.
Around one half of the increase is due to the incorporation of the accident tax into MTPL premiums in 2019. Compared to the same period of the previous year, there was a 9-per cent increase in the premiums for anniversary contracts. However, the increase in average premiums is typically related to passenger vehicles in Budapest.
Based on the adjusted index, between the first quarter of 2016 and that of 2019, the increase in average MTPL premiums was in line with the evolution of claims and the tax change. The rise that started in 2019 accelerated from the second quarter of 2020; thus, the scissors opened: the adjusted index moved from around 110 per cent to 140 per cent. The main reason for this is the more favourable claims trend in the wake of the pandemic situation: although individual claims expenditure and claims utilisation have increased in recent quarters (likely partly due to the rise in the euro exchange rate), the smaller number of damage records led to an overall decrease in claims expenditure. By contrast, a large share of the entrepreneurial premium part appears as a fixed cost for insurers, rising with general inflation and wage inflation; thus, it cannot necessarily keep up with a one-off expected reduction in claims expenditure due to extreme situations. The increase in the adjusted index indicates that insurers view the reduced claims expenditure associated with the curfew restrictions caused by the Covid-19 virus as a one-off effect.
It is hoped that following its first release in 2021 for other vehicle types (MNB 2021), the regular, quarterly publication of the MTPL index and that of the data will increase the transparency of the MTPL market, and thus also can help to increase public confidence. A further additional effect could be the stimulation of competition, to which the aggregated data available to insurers from the KKTA may also contribute through the reduction of information gaps and consequently by more accurate premium calculation.
References
Arató, N. M. (2001): Nem-élet biztosításmatematika (Non-life actuarial mathematics). Eötvös Kiadó, Budapest. https://doi.org/10.13140/2.1.5085.0081
EIOPA (2021): 2020 Consumer Trends Report. European Insurance and Occupational Pensions Authority. https://www.eiopa.europa.eu/sites/default/files/publications/reports/
consumer-trends-report-2020.pdf. Downloaded: 17 March 2021.
Insurance Europe (2019): European Motor Insurance Markets. https://www.insuranceeurope.
eu/mediaitem/ece3820a-feae-421f-aedd-8b6e89cc5fa1/European%20Motor%20 Insurance%20Markets%202019.pdfEuropean%20Motor%20Insurance%20Markets%20 -%20Data.xlsx. Downloaded: 17 March 2021.
MABISZ (2020): Kgfb: díjrészlet-fizetési határidő közeleg! (Mtpl: premium instalment payment deadline is approaching!) Magyar Biztosítók Szövetsége (Association of Hungarian Insurance Companies). https://mabisz.hu/kgfb-dijreszlet-fizetesi-hatarido-kozeleg/.
Downloaded: 1 March 2021.
MNB (2015): A Magyar Nemzeti Bank elnökének 55/2015. (XII. 22.) MNB rendelete a teljes költségmutató számításáról és közzétételéről (MNB Decree No. 55/2015 (XII.22.) of the Governor of the Magyar Nemzeti Bank on the calculation and publishing the Total Cost Indicator (TCI)). Magyar Nemzeti Bank.
MNB (2018): A Magyar Nemzeti Bank elnökének 9/2018. (III. 23.) MNB rendelete adatszolgáltatási tárgyú MNB rendeletek módosításáról és hatályon kívül helyezéséről (MNB Decree No. 9/2018 [III. 23.] of the Governor of the Magyar Nemzeti Bank regarding the amendment and repeal of MNB Decrees on data provision). Magyar Nemzeti Bank.
MNB (2021): Új MNB index: átlagosan kilenc százalékkal, negyvenötezer forintra nőtt a személyautók KGFB-díja tavaly (New MNB index: the MTPL premium for passenger cars increased by an average of nine per cent to forty-five thousand forints last year). Magyar Nemzeti Bank, Budapest, 8 February.
Wieczorek-Kosmala, M. (2016): Non-life Insurance Markets in CEE Countries – Part I:
Products’ Structure. Journal of Economics and Management, 25(25): 109–125. https://
doi.org/10.22367/jem.2016.25.08