susceptibility of pheasants ( Phasianus colchicus ) to ochratoxin A
CSABA FERNYE
1p, ZSOLT ANCSIN
1,
KRISZTI AN BALOGH
1,2, MIKL OS M EZES
1,2and M ARTA ERD ELYI
11Department of Feed Safety, Institute of Physiology and Nutrition, Hungarian University of Agriculture and Life Sciences, Pater K. u. 1, H-2103, G€od€oll}o, Hungary
2MTA-KE-SZIE Mycotoxins in the Food Chain Research Group, Kaposvar University, Kaposvar, Hungary
Received: 17 March 2021 • Accepted: 2 June 2021 Published online: 23 June 2021
ABSTRACT
The purpose of the present study was to investigate the effects of different dietary concentrations of ochratoxin A (OTA) on the growth, feed intake, mortality, blood plasma protein content and some parameters of lipid peroxidation and the glutathione redox system of pheasant chicks in a three-week long trial. A total of 320 seven-day-old female pheasants were randomly assigned to four treatment groups (n540 in each), fed with a diet artificially contaminated with OTA [control (<0.02 mg/kg), 0.88 mg/kg, 1.14 mg/kg and 1.51 mg/kg] for 21 days (up to 28 days of age). The pheasant chicks were sacrificed at early (12, 24 and 72 h) and late (7, 14 and 21 days) stages of mycotoxin exposure to check the effect of OTA. Minimal feed refusal was found in the medium- and high-dose toxin groups (–9.8 and–7.9%, respectively), and body weight gain was nearly the same in all groups. The glutathione redox system was activated mainly in the liver, confirmed by significantly increased reduced glutathione content and glutathione peroxidase activity during the late phase of mycotoxin exposure and at a high- dose treatment. The results suggest that pheasants have low susceptibility to OTA, and activation of the glutathione redox system has importance in this tolerance.
KEYWORDS
lipid peroxidation, antioxidant defence, malondialdehyde, reduced glutathione, glutathione peroxidase
INTRODUCTION
Ochratoxins are worldwide occurring mycotoxins primarily produced by the mould species Aspergillus ochraceusand Penicillium verrucosum(Gupta, 2007). These toxins contaminate different grains, such as barley, corn, wheat, and oat (Rafai et al., 2000). Global occurrence data reported from the last decade show that the incidences and maximum levels in cereal grains were 29% and 1,164
m
g/kg, respectively, for ochratoxin A (OTA) (Lee and Ryu, 2017).Besides its nephrotoxic properties, ochratoxin displays immunotoxicity (Al-Anati and Petzinger, 2006), and it is a potent inhibitor of protein synthesis (Niaz et al., 2020). Due to its long half-life, OTA also can accumulate in the food chain (Gupta, 2007).
The adverse effects of OTA are well recognised in poultry species. The general signs of ochratoxicosis in poultry species are feed refusal, decreased feed intake, weight gain and egg production, and increased water intake (Jand et al., 2005).Hamilton et al. (1982)reported the first ochratoxicosis field outbreak in turkeys, broiler chickens, and laying hens. The myco- toxin levels of the different feeds in that study varied between 0.3 and 16 mg/kg. In the most severely affected Turkey flock, total mortality reached 59% by marketing age, and the
Acta Veterinaria Hungarica
69 (2021) 2, 125–133 DOI:
10.1556/004.2021.00021
© 2021 The Author(s)
RESEARCH ARTICLE
pCorresponding author.
Tel.:þ36 30 594 7919.
E-mail:fernye.csaba@gmail.com
surviving birds expressed feed refusal, poor feed conversion, and growth rate. In laying hens, 0.3–4 mg/kg of OTA decreased egg production by 10–15%, and the changes in eggshell quality were described as‘thin shell and rubbery shell.’
On the other hand, in broiler chickens, 0.4–2 mg/kg of OTA caused impaired feed conversion ratio and decreased growth rate. At higher toxin levels, body weight depression could become extremely severe. Huff et al. (1975) found extremely severe (–75%) body weight depression in broilers after feeding 8 mg/kg dietary ochratoxin for four weeks.
Adverse effects of OTA intake can be observed also at lower toxin levels. Degeneration and atrophy of the lymphoid organs were found when chicks were consuming a feed containing 2–5 mg/kg OTA (Stoev et al., 2002;Kumar et al., 2004), and 1 mg/kg caused severe immunosuppression as well as hae- matological and biochemical disturbances in laying hens (Sawale et al., 2009). Microscopic lesions in the liver and kidney were observed at dietary toxin levels as low as 0.16–0.33 mg/kg, and moderate histological lesions were found when the experimental diet contained OTA at the limit level recom- mended by the EU (0.1 mg/kg) for poultry (Pozzo et al., 2013).
The susceptibility of game birds to OTA is varies widely by species. Feeding 4 mg/kg dietary OTA for three weeks resulted in a 21% decrease of body weight and 10% higher mortality in chukar partridges (Ruff et al., 1992). Japanese and Bobwhite quail possibly have higher OTA tolerance as the same toxin level (4 mg/kg) did not cause body weight depression or increased mortality in either species (Ruff et al., 1990). Pheasants, on the other hand, showed a slight increase (2.5%) in mortality, but growth performance was unaffected by the same contamination level (4 mg/kg) of OTA (Huff et al., 1992). According to these results, the pheasant seems to be slightly less susceptible to OTA than the chukar partridge but somewhat more susceptible than the Bobwhite and Japanese quail.
One of the possible causes of OTA toxicity is the for- mation of oxygen free radicals, which initiate the peroxi- dation of polyunsaturated fatty acids (Schaaf et al., 2002).
The mechanisms of response to oxidative stress are conserved in vertebrates, even in poultry, and this is partly based on the antioxidant defence, including the glutathione redox system (Surai et al., 2019). OTA-induced oxidative stress affects the enzymatic (glutathione peroxidases) and the non-enzymatic (reduced glutathione) part of the gluta- thione redox system (Cavin et al., 2007).
The effect of OTA on the glutathione redox system on lipid peroxidation parameters, reduced glutathione (GSH) concentration, and glutathione-peroxidase (GPx) activity has been investigated previously in the course of a three- week OTA exposure (0.11, 0.65, and 1.13 mg/kg feed) in broiler chickens (K€ovesi et al., 2019). The results of that study revealed that, as an effect of OTA, malondialdehyde (MDA) and reduced glutathione content increased in the liver and kidney, but not in the blood plasma, and this effect was more marked in the liver. Glutathione peroxidase ac- tivity did not change in the blood, a tendency of increase was found in the liver, but a significant increase was demon- strated in the kidney. The purpose of the present study was
to investigate the effect of short- and long-term OTA exposure on some parameters of lipid peroxidation and the glutathione redox system in pheasants.
MATERIALS AND METHODS
Experimental birds and diet
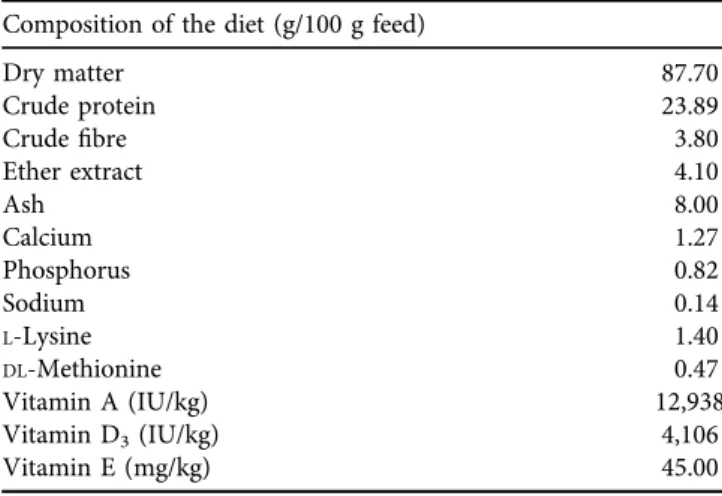
A total of 320 one-day-old female pheasants (21.86±2.15 g) were purchased from a hatchery (Perjesies Tarsa Ltd., Kecel, Hungary) and transported to the experimental facility of the Department of Nutrition, Szent Istvan University (G€od€oll}o, Hungary). Birds were housed in rounded wall pens of 1 m diameter (n 5 40 per pen) with infrared heat lamps throughout the experimental period (the power and the height of the lamps were adjusted to the birds’ re- quirements), and the room temperature was 258C. Feeding was based on a commercial pheasant diet (Table 1). During the experiment, feed and drinking water were provided ad libitum.
The experiments were carried out according to the Na- tional Animal Welfare Act regulations, which are in line with the relevant EU rules. The experimental protocol was authorised by the National Food Chain Safety Office (PE/
EA/1965-7/2017).
Mycotoxin production and experimental contamination of diet
The experimental diet was artificially contaminated with ochratoxin A, produced on ground corn substrate under controlled laboratory conditions with an Aspergillus alber- tensisstrain (SZMC 22107) deposited in the Microbiological Collection of the University of Szeged.
The final concentration of OTA in the milled corn (1 kg) was 1,067±30.12 mg/kg, measured in five sub-samples (20 g each) in triplicates by the HPLC method with fluorescence detection after immunoaffinity clean-up with OchraStar R IAC column (Romer Labs, Tulln, Austria) according to a standard method (ISO 15141, 2018). The analyses were carried out by Wessling Hungary Ltd. (Budapest, Hungary)
Table 1.Chemical composition of the pheasant feed Composition of the diet (g/100 g feed)
Dry matter 87.70
Crude protein 23.89
Crudefibre 3.80
Ether extract 4.10
Ash 8.00
Calcium 1.27
Phosphorus 0.82
Sodium 0.14
L-Lysine 1.40
DL-Methionine 0.47
Vitamin A (IU/kg) 12,938
Vitamin D3(IU/kg) 4,106
Vitamin E (mg/kg) 45.00
using an HPLC series 1,100 from Agilent Technologies (Santa Clara, CA, USA). The OTA standard was obtained from Sigma-Aldrich (St Louis, MI, USA) and was dissolved in methanol at a 1 mg/mL concentration. Ultraviolet spec- trophotometry at 333 nm (Hitachi H-2900, Hitachi, Tokyo, Japan) was used to determine thefinal concentration in this OTA solution. All solutions were stored at–208C until use.
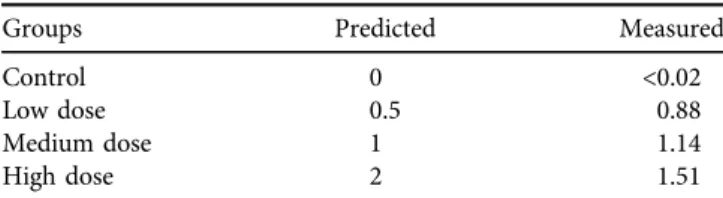
The target OTA concentrations of the experimental diets were 0.5, 1 and 2 mg/kg, as multiple doses of limit values proposed by the EU for broiler chicken diets (0.1 mg/kg).
Based on the final toxin concentration in the growing me- dium, an appropriate amount of milled corn was mixed with the basal diet for each experimental group. The OTA con- tent of the feed was determined in five feed samples (20 g of each) in triplicates by the high-performance liquid chro- matography method with fluorescence detection (HPLC- FLD) as mentioned above. The measured ochratoxin A content of the feeds are shown inTable 2.
Experimental design
A total of 320 one-day-old female pheasants were randomly assigned to four groups with different concentrations of ochratoxin A: control (<0.02 mg OTA/kg), low dose (0.88 mg OTA/kg), medium dose (1.14 mg OTA/kg), and high dose (1.51 mg OTA/kg) with two replicates of each group (8 pens with 40 birds in each pen). In the first week, birds were allowed to adapt to the environment. During this period, all groups received a control feed (Table 1). The treatment was started with one-week-old birds and lasted for 21 days, up to 28 days of age. Feed consumption, which was determined by the daily feed intake per pen, and mortality were recorded daily. The daily portion of pheasant feed in each pen was calculated according to the results of our previous study (Fernye et al., 2018). Live body weight was measured before the birds were sacrificed. The feed conversion ratio (FCR)
was calculated for each group based on the average daily weight gain and the overall feed intake. For the investigation of both short- and long-term effects of OTA, six randomly selected birds from both replicates of each experimental group were sacrificed at the early (12th, 24th and 72nd h) and the late (days 7, 14 and 21) stages from the start of the experiment. The animals were euthanised by cervical dislo- cation and exsanguination. After extermination, postmor- tem blood, liver and kidney samples were taken. Blood samples were taken into heparinised tubes and centrifuged at 2,300 3 g for 10 min to isolate plasma. Red blood cell (RBC) haemolysate was also prepared by adding a 9-fold volume of redistilled water, freezing, and thawing. The whole liver was taken and weighed, and the lower third of the large lobe was dissected and packed for further analyses.
Kidneys from both sides were also taken and used for further analysis. All the samples were stored at –70 8C for further analysis. Liver and kidney samples (0.1 g) were homogenised in a nine-fold volume (0.9 mL) of physiological saline (0.9%
w/v NaCl solution).
Lipid peroxidation
In the liver homogenate, conjugated dienes (CD) and con- jugated trienes (CT) were determined as initial markers of lipid peroxidation (AOAC, 1984). As a marker of the ter- minal phase of lipid peroxidation, malondialdehyde con- centration was measured in the blood plasma and the red blood cell haemolysate according toPlacer et al. (1966)and in the liver and kidney homogenate based on the method of Botsoglou et al. (1994) using 1,1,3,3-tetraethoxypropane (Fluka, Buchs, Switzerland) as standard.
Antioxidant system
Some glutathione redox system parameters were investigated to study the changes in the antioxidant system. Reduced glutathione content (Rahman et al., 2006) and glutathione peroxidase activity (Lawrence and Burk, 1978) were measured in the blood plasma, red blood cell haemolysate, and the GSH content and GPx activity of the 10,000 g su- pernatant fraction of liver and kidney homogenates were calculated to protein content, which was determined by biuret reaction (Weichselbaum, 1948) in the blood plasma and the RBC haemolysate, and in the 10,000 g supernatant Table 2.Predicted and measured ochratoxin A concentrations of
the diets (mg/kg)
Groups Predicted Measured
Control 0 <0.02
Low dose 0.5 0.88
Medium dose 1 1.14
High dose 2 1.51
Table 3.Effect of ochratoxin A exposure on the calculated feed conversion ratio and mortality through the experiment in pheasants
Experimental group
Feed conversion ratio [feed consumed (g)/weight gained (g)]
Week 0 Week 1 Week 2 Week 3 Total mortality (%) Time of mortality
Control –
(n580)
2.12 (n544) 2.41 (n532) 2.36 (n520) 0 (n50) –
0.88 mg/kg –
(n580)
2.94 (n544) 2.41 (n532) 2.78 (n519) 1.25 (n51) Day 15
1.14 mg/kg –
(n580)
1.83 (n543) 2.49 (n530) 2.34 (n518) 2.50 (n52) Day 4, Day 9
1.51 mg/kg –
(n580)
2.61 (n543) 2.28 (n530) 2.39 (n518) 2.50 (n52) Day 3, Day 7
fraction of liver and kidney homogenates by Folin phenol reagent (Lowry et al., 1951).
Statistical analysis
Statistical analysis of the data was carried out using GraphPad InStat 3.05 software (GraphPad Software, San Diego, CA, USA). At first the Kolmogorov–Smirnov normality test was done and, based on the results, either parametric one-way analysis of variance (with Tukey’spost- hoc test) or the non-parametric Kruskal–Wallis test (with Dunn’spost-hoctest) was carried out.
RESULTS
Clinical signs of toxicity and mortality
In the control group, no mortality was observed. The highest mortality rate (2.50%) was found in the 1.14 mg/kg and 1.51 mg/kg OTA dose groups; however, this value was slightly higher than in the 0.88 mg/kg dose group (1.25%) (Table 3).
No clinical signs of toxicity were found in the birds, and not even morbidity signs were observed before death.
Feed intake, body weight and feed conversion ratio
Feed refusal was observed only in the medium- and high- dose toxin groups (–9.8 and–7.9%, respectively). The birds of the low-dose group consumed 9.2% more feed than the control birds. During the trial, body weights were similar in all four experimental groups; however, the final average body weights in the low-, medium- and high-dose groups were lower by 6.3, 8.6 and 7.8%, respectively, than in the control group. The feed conversion ratio (FCR) was the lowest in the medium-dose group (Table 3), while the highest was calculated for the low-dose group (2.94 kg/kg).
In the second and third weeks, the values evened up, and a slightly higher FCR value was found in the low-dose group (2.78 kg/kg) in the third week (Table 3). Absolute and relative (g/100 g body weight) liver weight did not differ among the experimental groups during the entire study period (data not shown).
Protein content of the blood plasma
The protein content of the blood plasma eventually decreased as a result of dietary OTA exposure (Table 4).
There was no significant difference up to 72 h of treatment, Table 4.Effect of ochratoxin A exposure on protein, malondialdehyde (MDA) and reduced glutathione (GSH) concentrations and
glutathione peroxidase (GPx) activity in the blood plasma of pheasants
Time of exposure Control Low dose (0.88 mg/kg) Medium dose (1.14 mg/kg) High dose (1.51 mg/kg) Protein (g/L)
12 hours 30.91a±7.08 29.14a±4.71 31.39a±5.22 26.50a±4.94
24 hours 33.16a±5.34 26.03a±6.70 31.48a±4.55 29.56a±7.33
72 hours 29.55ab±5.72 25.79a±2.51 32.24b±1.76 26.54a±3.83
7 days 30.54a±6.45 27.57ab±4.08 34.16a±4.41 24.03b±3.39
14 daysy 32.42a±2.11 31.19ab±3.07 31.98a±3.93 26.59b±4.27
21 days 34.41a±4.70 28.47b±3.27 33.46a±3.11 25.38b±4.68
MDA (mmol/L)
12 hours 6.26a±1.81 5.89a±1.51 7.23a±1.39 6.48a±0.67
24 hours 5.73a±0.86 4.93a±1.51 5.65a±1.37 5.22a±1.26
72 hoursy 4.80ab±1.09 4.16a±1.02 5.41ab±1.28 6.53b±2.14
7 days 4.32a±0.58 3.69b±0.43 3.94ab±0.41 3.00c±0.36
14 days 4.73a±0.59 4.11b±0.38 4.71a±0.49 3.51c±0.18
21 days 5.06a±0.58 4.38a±0.62 6.01b±0.71 4.57a±1.28
GSH (mmol/g protein content)
12 hours 9.57a±2.65 9.15a±1.24 8.85a±2.18 8.31a±1.14
24 hours 8.32a±1.32 10.65a±3.04 10.14a±3.50 10.35a±3.74
72 hours 8.94a±1.87 8.93a±0.98 8.60a±0.30 9.09a±1.33
7 days 10.91a±1.73 11.17a±1.25 10.59a±1.49 14.31b±2.50
14 days 9.15ab±0.52 8.29a±0.68 9.77ab±1.19 10.46b±1.87
21 days 8.85a±1.19 9.57ab±1.35 9.32a±0.79 11.24b±2.47
GPx (U/g protein content)
12 hours 6.93a±2.29 6.47a±1.01 5.20a±2.37 6.08a±2.03
24 hours 6.21a±0.94 7.91a±2.63 6.61a±3.34 6.65a±1.52
72 hours 8.26a±1.73 9.45a±2.26 9.53a±0.92 12.36b±2.28
7 days 8.89a±0.81 10.03ab±1.95 8.45a±1.30 11.58b±2.30
14 daysy 8.09a±1.47 8.69ab±1.15 8.79ab±0.51 10.48b±2.08
21 days 6.25a±1.51 7.94ab±1.12 6.08a±0.91 8.59b±1.69
The values represent the mean±SD (n512).
a,bMeans designated with different superscripts within rows mean significant (P< 0.05) difference between experimental groups calculated by one-way ANOVA with Tukey'spost-hoctest.
ySignificant differences were calculated by Kruskal–Wallis test using Dunn'spost-hoctest.
but a significantly (P < 0.05) higher blood plasma protein content was found in the medium-dose group as compared to the low- and high-dose groups at 72 h. After one week of OTA exposure, significantly (P < 0.05) lower protein level was found in the high-dose group as compared to the control and the medium-dose groups. This difference remained significant until the end of the experiment. In the third week, significantly (P < 0.05) lower protein level was found in the high- and the low-dose groups as compared to the control.
Lipid peroxidation parameters
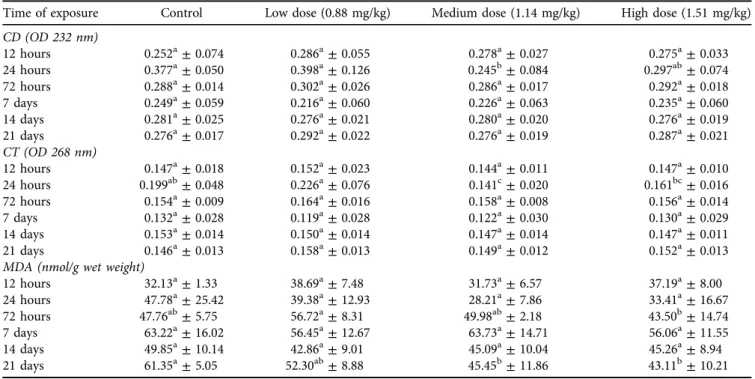
No significant (P > 0.05) change was found in the MDA levels of the blood plasma in thefirst 24 h (Table 4). After 72 h, the MDA values showed a significant (P< 0.05) difference between the low- and high-dose groups. This tendency changed entirely after one week of exposure as the lowest MDA level was found in the high-dose group followed by the low- and medium-dose and in the control groups. After one and two weeks of OTA exposure the MDA levels was significantly higher (P < 0.05) in the high- and low-dose groups compared to the control. In the third week, the difference was significant (P < 0.05) between the medium- dose and control groups. No changes were observed in the MDA content of red blood cell haemolysate (data not shown). The markers of the initial phase of lipid peroxida- tion (CD and CT) changed significantly (P < 0.05) only in the early stages of the experiment, in the liver (Table 6).
After 24 h of exposure, both CD and CT levels decreased significantly (P< 0.05) in the medium-dose group compared to the control and the low-dose groups (Table 6). Besides, the CT level was significantly (P < 0.05) lower in the me- dium-dose group than in the control and the low-dose groups at 24 h. MDA level in the high-dose group differed significantly at the 72-h sampling, when it was significantly
(P< 0.05) lower as compared to the low-dose group. After three weeks of exposure, MDA levels in the medium- and high-dose groups were significantly (P < 0.05) lower as compared to the control (Table 6). Changes in MDA showed a similar pattern in the kidney as in the liver (Table 8). At the 72-h sampling, the MDA levels of both the low- and the high-dose groups were significantly (P < 0.05) lower than those of the control and the medium-dose groups. After one week, the MDA level in the high-dose group was signifi- cantly (P< 0.05) lower than in the control and the low-dose groups. No other statistically significant difference (P> 0.05) was found.
Reduced glutathione content
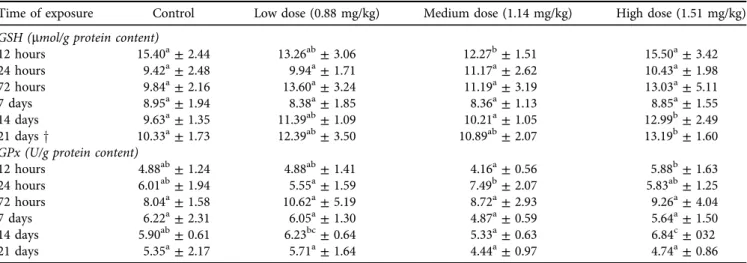
No significant difference (P> 0.05) was found in GSH levels of the blood plasma in thefirst 72 h. From thefirst week of OTA exposure, an increasing tendency in GSH levels to- wards the higher toxin levels could be observed (Table 4). In thefirst and third weeks of the study, significantly (P< 0.05) higher GSH levels were found in the high toxin group than in the control. A significant difference (P < 0.05) was only found between the high- and low-dose groups in the second week. In the red blood cell haemolysate, significant changes (P< 0.05) in GSH concentrations were mostly limited to the later stages of the experiment (Table 5), even though GSH levels dropped in the medium-dose group after 12 h of exposure, which was significant (P < 0.05) as compared to the control and the high-dose groups. After that, there was no significant (P> 0.05) change until the second week. In the second and third weeks, a very similar tendency of GSH levels was seen as in blood plasma. The highest GSH con- centrations were measured in the high-dose group while the lowest levels in the control one; the difference was significant (P< 0.05) at both sampling times. Changes in the GSH levels in liver homogenates were seen throughout the experiment.
Table 5.Effect of ochratoxin A exposure on malondialdehyde (MDA) and reduced glutathione (GSH) concentrations and glutathione peroxidase (GPx) activity of the red blood cell haemolysate of pheasants
Time of exposure Control Low dose (0.88 mg/kg) Medium dose (1.14 mg/kg) High dose (1.51 mg/kg) GSH (mmol/g protein content)
12 hours 15.40a±2.44 13.26ab±3.06 12.27b±1.51 15.50a±3.42
24 hours 9.42a±2.48 9.94a±1.71 11.17a±2.62 10.43a±1.98
72 hours 9.84a±2.16 13.60a±3.24 11.19a±3.19 13.03a±5.11
7 days 8.95a±1.94 8.38a±1.85 8.36a±1.13 8.85a±1.55
14 days 9.63a±1.35 11.39ab±1.09 10.21a±1.05 12.99b±2.49
21 daysy 10.33a±1.73 12.39ab±3.50 10.89ab±2.07 13.19b±1.60
GPx (U/g protein content)
12 hours 4.88ab±1.24 4.88ab±1.41 4.16a±0.56 5.88b±1.63
24 hours 6.01ab±1.94 5.55a±1.59 7.49b±2.07 5.83ab±1.25
72 hours 8.04a±1.58 10.62a±5.19 8.72a±2.93 9.26a±4.04
7 days 6.22a±2.31 6.05a±1.30 4.87a±0.59 5.64a±1.50
14 days 5.90ab±0.61 6.23bc±0.64 5.33a±0.63 6.84c±032
21 days 5.35a±2.17 5.71a±1.64 4.44a±0.97 4.74a±0.86
The values represent the mean±SD (n512).
a,bMeans designated with different superscripts within rows mean significant (P< 0.05) difference between experimental groups calculated by one-way ANOVA with Tukey'spost-hoctest).
ySignificant differences were calculated by the Kruskal–Wallis test using Dunn'spost-hoctest.
In the earliest stage (at 12 h) the GSH level in the high-dose group was significantly (P< 0.05) lower than in the control and the low-dose groups (Table 7). In the next 12 h, this tendency changed completely as the highest GSH concen- tration was measured in the high-dose group, while, the lowest level was found in the control group, and the dif- ference was significant (P < 0.05). The same tendency continued in the late stages of the experiment. After one week of exposure, the GSH level of the high-dose group was
significantly (P < 0.05) higher compared not only to the control but also to the low- and medium-dose groups. The same results were found in the second week, even though the GSH level of the medium-dose group was significantly (P< 0.05) higher compared to the control. In the last week, both the high- and the medium-dose groups had signifi- cantly higher values than the control and the low-dose groups. No significant change was found regarding the GSH levels in the kidney homogenates (data not shown).
Table 6.Effect of ochratoxin A exposure on conjugated diene (CD), conjugated triene (CT), and malondialdehyde (MDA) levels in the liver homogenate of pheasants
Time of exposure Control Low dose (0.88 mg/kg) Medium dose (1.14 mg/kg) High dose (1.51 mg/kg) CD (OD 232 nm)
12 hours 0.252a±0.074 0.286a±0.055 0.278a±0.027 0.275a±0.033
24 hours 0.377a±0.050 0.398a±0.126 0.245b±0.084 0.297ab±0.074
72 hours 0.288a±0.014 0.302a±0.026 0.286a±0.017 0.292a±0.018
7 days 0.249a±0.059 0.216a±0.060 0.226a±0.063 0.235a±0.060
14 days 0.281a±0.025 0.276a±0.021 0.280a±0.020 0.276a±0.019
21 days 0.276a±0.017 0.292a±0.022 0.276a±0.019 0.287a±0.021
CT (OD 268 nm)
12 hours 0.147a±0.018 0.152a±0.023 0.144a±0.011 0.147a±0.010
24 hours 0.199ab±0.048 0.226a±0.076 0.141c±0.020 0.161bc±0.016
72 hours 0.154a±0.009 0.164a±0.016 0.158a±0.008 0.156a±0.014
7 days 0.132a±0.028 0.119a±0.028 0.122a±0.030 0.130a±0.029
14 days 0.153a±0.014 0.150a±0.014 0.147a±0.014 0.147a±0.011
21 days 0.146a±0.013 0.158a±0.013 0.149a±0.012 0.152a±0.013
MDA (nmol/g wet weight)
12 hours 32.13a±1.33 38.69a±7.48 31.73a±6.57 37.19a±8.00
24 hours 47.78a±25.42 39.38a±12.93 28.21a±7.86 33.41a±16.67
72 hours 47.76ab±5.75 56.72a±8.31 49.98ab±2.18 43.50b±14.74
7 days 63.22a±16.02 56.45a±12.67 63.73a±14.71 56.06a±11.55
14 days 49.85a±10.14 42.86a±9.01 45.09a±10.04 45.26a±8.94
21 days 61.35a±5.05 52.30ab±8.88 45.45b±11.86 43.11b±10.21
The values represent the mean±SD (n512).
a,bMeans designated with different superscripts within rows mean significant (P< 0.05) difference between experimental groups calculated by one-way ANOVA with Tukey'spost-hoctest.
Table 7.Effect of ochratoxin A exposure on reduced glutathione (GSH) concentration and glutathione peroxidase (GPx) activity in the 10,000 g supernatant of the liver homogenate of pheasants
Time of exposure Control Low dose (0.88 mg/kg) Medium dose (1.14 mg/kg) High dose (1.51 mg/kg) GSH (mmol/g protein content)
12 hours 3.80ab±0.32 3.83a±0.18 3.55bc±0.23 3.52c±0.25
24 hours 3.37a±0.90 3.39ab±0.97 4.09ab±0.33 4.24b±0.77
72 hours 3.13a±0.50 2.93a±0.59 3.34a±0.49 3.10a±0.45
7 days 2.95a±0.93 2.93a±0.54 3.40a±0.71 4.34b±0.58
14 days 2.70a±0.32 2.99ab±0.45 3.38b±0.43 4.91c±1.00
21 days 3.27a±0.45 2.99a±0.42 3.75b±0.42 4.15b±0.83
GPx (U/g protein content)
12 hours 1.92a±0.34 1.71a±0.41 1.82a±0.36 1.65a±0.26
24 hours 1.69a±0.80 1.75a±0.81 2.20a±0.31 2.21a±0.52
72 hours 2.42a±0.70 2.28a±0.64 2.50a±0.76 2.09a±0.42
7 days 1.99a±0.86 1.70a±0.72 1.89a±0.67 2.77a±1.25
14 days 2.15a±0.38 2.29a±0.63 2.46a±0.44 3.37b±1.20
21 days 2.56a±0.33 2.36a±0.42 3.42b±0.54 3.72b±0.53
The values represent the mean±SD (n512).
a,bMeans designated with different superscripts within rows means significant (P< 0.05) difference between experimental groups calculated by one-way ANOVA with Tukey'spost-hoctest.
Glutathione peroxidase activity
In the blood plasma, GPx activity followed the changes in GSH levels during the experiment; however, significant differences were somewhat more evident (Table 4). As mentioned before, the same tendency was found, but unlike in GSH, this could be observed even after 72 h of OTA exposure. It was significantly (P < 0.05) higher in the high- dose group than in the control group from the 72nd h of exposure until the end of the experiment. In the red blood cell haemolysate, the GPx activity followed the changes in GSH concentration, too, especially in the early stages of the trial (Table 5). At thefirst sampling, GPx activity increased in the high-dose group; however, the difference was signif- icant (P < 0.05) only compared to the medium-dose group.
On the other hand, after 24 h of exposure, a significant difference was found in GPx activity between the medium- and the low-dose groups. In the same way as for GSH, the next significant change in GPx activity occurred after two weeks of OTA exposure. The activity of this enzyme was found to be increased in the high-dose group, and it was significantly different only compared to the control and the medium-dose groups. GPx activity in the liver homogenates followed the changes of GSH levels through the experiment (Table 7). In the second week, significantly (P< 0.05) higher GPx activity was found in the high-dose group than in the other three groups. In the third week, GPx activity increased significantly (P< 0.05) in both the medium- and the high- dose groups as compared to the control and the low-dose groups. No significant change was found regarding the GPx activity in kidney homogenates. It changed parallel with the GSH levels, in the same way as in the liver (data not shown).
DISCUSSION
Feed refusal and body weight depression of poultry resulting from the consumption of an OTA-contaminated diet have been described previously (Hoehler and Marquardt, 1996;
Hoehler et al., 1997). These adverse effects were not signif- icant (P > 0.05) but still observable in the present study.
Moderate feed refusal and weight depression were probably due to the lower toxin doses used in the present study, although even the relatively low (0.5–1.0 mg/kg) mycotoxin
levels could negatively influence these parameters (Prior et al., 1980). Interestingly, Huff et al. (1992) did not find lower body weights in young pheasants even at higher toxin levels. Despite the mortality, the results were practically identical in the medium- and the high-dose groups as in the 1 and 2 mg/kg groups.
The decreased concentration of plasma or serum pro- teins is considered a valuable indicator of ochratoxicosis (Huff et al., 1988;Hoehler and Marquardt, 1996;Sakthivelan and Rao, 2010). The results of the present study support this effect of OTA in pheasants because blood plasma protein content decreased significantly. The mechanism of action is considered to be the inhibition of hepatic protein synthesis through competitive inhibition of phenylalanyl-t-RNA- synthetase with phenylalanine (Konrad and R€oschenthaler, 1977;Creppy et al., 1979); however, renal leakage of albumin caused by kidney lesions is thought to be a possible contributor (Huff et al., 1988). The inhibitory effect of OTA on protein synthesis (Niaz et al., 2020) would be the cause of its immunosuppressive effect due to the depression of antibody responses and the impaired replacement of im- mune cells.
Despite the proven pro-oxidant properties of OTA (Hoehler et al., 1997), MDA concentrations were slightly lower in tissue samples of the treated groups as compared to the control. The mechanism behind this could be the acti- vation of the antioxidant system, such as increased GSH level and GPx activity. MDA level decreased, which occurred in the blood plasma and the liver, especially in the latter stages of the trial, which means that the activation of the antioxidant response occurred after a longer period of time in the presence of OTA doses used in this experiment.
The ochratoxin load triggered the antioxidant system of the pheasants. GSH, the main cellular antioxidant (Dixon et al., 2014), reacted to the treatment by a significant elevation in its concentration in almost all tissues, primarily in the late stages of the trial. Throughout the experiment, GPx activity changed simultaneously with GSH content in each tissue, according to the earlierfindings (Balogh et al., 2007). This late response can be explained by the dose- and time-dependent effects of OTA on the activation of the redox-sensitive transcription factors. Molecular mechanisms responding to redox changes, such as oxidative stress, are conserved in vertebrates, including poultry. The master Table 8.Effect of ochratoxin A exposure on malondialdehyde (MDA) content of the kidney homogenate of pheasants
Time of exposure Control Low dose (0.88 mg/kg) Medium dose (1.14 mg/kg) High dose (1.51 mg/kg) MDA (nmol/g wet weight)
12 hours 38.01a±11.15 34.90a±13.58 49.94a±19.03 41.66a±9.97
24 hours 54.78a±20.39 53.56a±16.97 52.54a±17.08 42.60a±10.26
72 hours 67.20a±21.35 42.37b±10.00 65.81a±13.01 37.78b±9.47
7 days 56.42a±28.46 51.11a±13.71 41.12ab±7.82 35.61b±7.62
14 days 49.69a±6.10 47.99a±12.04 56.24a±14.26 47.54a±15.12
21 days 50.40a±16.85 43.22a±11.95 48.51a±8.05 39.47a±11.79
The values represent the mean±SD (n512).
a,bMeans designated with different superscripts within rows means significant (P< 0.05) difference between experimental groups determined by one-way ANOVA with Tukey'spost-hoctest.
regulator of this response is the transcription factor nuclear factor-erythroid 2 p45-related factor 2 (Nrf2) in connection with the Kelch-like ECH-associated protein 1 (Keap1) (Kensler et al., 2007; Suzuki and Yamamoto, 2015). OTA- induced oxidative stress has an effect on both enzymatic and non-enzymatic antioxidant defences (Cavin et al., 2007), and also modulates Nrf2 gene and protein expression, which regulates the expression of the Antioxidant Response Element (ARE) gene cluster (Boesch-Saadatmandi et al., 2009). Nrf2 induces the expression of genes encoding the antioxidant system, such as the enzymes of the glutathione redox pathway, but most of them are inhibited by OTA in chicken (Zeferino et al., 2016). However, no data are avail- able on that in pheasant.
Considering the biochemical parameters, the kidney was the least informative tissue; however, tendencies were similar as in the liver or blood samples.K€ovesi et al. (2019) used similar OTA doses in a three-week broiler chicken experi- ment and could only find significant changes in MDA content in the one-week sampling period. Of course, these results do not mean that the kidney was not affected by ochratoxin A, but possibly the doses used in the present study did not activate the Keap1-Nrf2-ARE pathway in the kidney during the early period of exposure but only at later stages.
It can be concluded that pheasants could tolerate both short- and long-term OTA exposure as only minor negative changes were found in the performance traits. Also, pheas- ants maintained the glutathione redox system on a high level, which contributed to OTA tolerance.
ACKNOWLEDGEMENTS
The research was supported by the EFOP-3.6.3-VEKOP-16- 2017-00008 project and co-financed by the European Union and the European Social Fund to CF, KB, MM, and ME.
REFERENCES
Al-Anati, L. and Petzinger, E. (2006): Immunotoxic activity of ochratoxin A. J. Vet. Pharmacol. Ther.29,79–90.
AOAC (1984): Official Methods of Analysis 28054 B. 14th edition.
Arlington, USA.
Balogh, K., Weber, M., Erdelyi, M. and Mezes, M. (2007): Inves- tigation of lipid peroxide and glutathione redox status of chicken concerning high dietary selenium intake. Acta Biol.
Hung.58,269–279.
Boesch-Saadatmandi, C., Wagner, A. E., Graeser, A. C., Hund- hausen, C., Wolfram, S. and Rimbach, G. (2009): Ochratoxin A impairs Nrf2-dependent gene expression in porcine kidney tubulus cells. J. Anim. Physiol. Anim. Nutr.93,547–554.
Botsoglou, N. A., Fletouris, D. J., Papageorgiou, G. E., Vassilo- poulos, V. N., Mantis, A. J. and Trakatellis, A. G. (1994): Rapid, sensitive and specific thiobarbituric acid method for measuring
lipid peroxidation in animal tissue, food and feed samples. J.
Agr. Food Chem.42,1931–1937.
Cavin, C., Delatour, T., Marin-Kuan, M., Holzhauser, D., Higgins, L., Bezencon, C., Guignard, G., Junod, S., Richoz-Payot, J. and Gremaud, E. (2007): Reduction in antioxidant defenses may contribute to ochratoxin A toxicity and carcinogenicity. Tox- icol. Sci.96,30–39.
Creppy, E. E., Lugnier, A. A. J., Fasiolo, F., Heller, K., R€oschenthaler, R. and Dirheimer, G. (1979): In vitroinhibition of yeast phe- nylalanyl-tRNA synthetase by ochratoxin A. Chem. Biol.
Interact.24,257–261.
Dixon, S. J., Patel, D. N., Welsch, M., Skouta, R., Lee, E. D., Hayano, M., Thomas, A. G., Gleason, C. E., Tatonetti, N. P., Slusher, B.
S. and Stockwell, B. R. (2014): Pharmacological inhibition of cystine-glutamate exchange induces endoplasmic reticulum stress and ferroptosis. Elife3,e02523.
Fernye, Cs., Ancsin, Zs., Bocsai, A., Balogh, K., Mezes, M. and Erdelyi, M. (2018): Role of glutathione redox system on the T-2 toxin tolerance of pheasant (Phasianus colchicus). Toxicol. Res.
34,249–257.
Gupta, R. C. (2007): Ochratoxin and citrinin. Veterinary Toxi- cology. First edition. Academic Press, New York. pp. 997–1003.
Hamilton, P. B., Huff, W. E., Harris, J. R. and Wyatt, R. D. (1982):
Natural occurrences of ochratoxicosis in poultry. Poulty Sci.51, 1832–1841.
Hoehler, D. and Marquardt, R. R. (1996): Influence of vitamins E and C on the toxic effects of ochratoxin A and T-2 toxin in chicks. Poult. Sci.77,1508–1515.
Hoehler, D., Marquardt, R. R. and Frohlich, A. A. (1997): Lipid peroxidation as one mode of action in ochratoxin A toxicity in rats and chicks. Can. J. Anim. Sci.77,287–292.
Huff, W. E., Kubena, L. F. and Harvey, R. B. (1988): Progression of ochratoxicosis in broiler chicken. Poult. Sci.67,1139–1146.
Huff, W. E., Ruff, M. D. and Chute, M. B. (1992): Characterization of the toxicity of the mycotoxins, aflatoxin, ochratoxin, and T-2 toxin in game birds. II: Ringneck pheasant. Avian Dis.36,30–
33.
Huff, W. E., Wyatt, R. D. and Hamilton, P. B. (1975): Nephro- toxicity of dietary ochratoxin A in broiler chickens. Appl.
Microbiol.30,48–51.
ISO 15141 (2018): Cereals and cereal products–Determination of ochratoxin A – High-performance liquid chromatographic method with immunoaffinity column cleanup andfluorescence detection. European Commission for Standardization, Brussels.
Jand, S. K., Kaur, P. and Sharma, N. S. (2005): Mycoses and mycotoxicosis in poultry: a review. Indian J. Anim. Sci.75,465–
476.
Kensler, T. W., Wakabayashi, N. and Biswal, S. (2007): Cell survival responses to environmental stresses via the Keap1-Nrf2-ARE pathway. Annu. Rev. Pharmacol. Toxicol.47,89–116.
Konrad, I. and R€oschenthaler, R. (1977): Inhibition of phenylala- nine tRNA synthetase from Bacillus subtilis by ochratoxin A.
FEBS Lett.83,341–347.
K€ovesi, B., Cserhati, M., Erdelyi, M., Zandoki, E., Mezes, M., and Balogh, K. (2019): Long-term effects of ochratoxin A on the glutathione redox system and its regulation in chicken. Anti- oxidants8,178.
Kumar, A., Jindal, N., Shukla, C. L., Asrani, R. K., Ledoux, D. R.
and Rottinghaus, G. E. (2004): Pathological changes in broiler chickens fed ochratoxin A and inoculated withEscherichia coli.
Avian Pathol.33,413–417.
Lawrence, R. and Burk, R. (1978): Species, tissue and subcellular distribution of non-Se-dependent glutathione peroxidase ac- tivity. J. Nutr.108,211–215.
Lee, H. J. and Ryu, D. (2017): Worldwide occurrence of mycotoxins in cereals and cereal-derived food products: public health perspec- tives of their co-occurrence. J. Agr. Food Chem.65,7034–7051.
Lowry, O. H., Rosenbrough, N. J., Farr, A. L. and Randall, R. J.
(1951): Protein measurement with the Folin phenol reagent. J.
Biol. Chem.193,265–275.
Niaz, K., Shah, S. Z. A., Khan, F. and Bule, M. (2020): Ochratoxin A-induced genotoxic and epigenetic mechanisms lead to Alz- heimer disease: its modulation with strategies. Environ. Sci.
Pollut. Res.27,44673–44700.
Placer, Z. A., Cushman, L. L. and Johnson, B. C. (1966): Estimation of product of lipid peroxidation (malonyldialdehyde) in biochemical systems. Analyt. Biochem.16,359–364.
Pozzo, L., Cavallarin, L., Antoniazzi, S., Guerre, P., Biasibetti, E., Capucchio, M. and Schiavone, A. (2013): Feeding a diet contaminated with ochratoxin A for broiler chickens at the maximum level recommended by the EU for poultry feeds (0.1 mg/kg). 2. Effects on meat quality, oxidative stress, residues, and histological traits. J. Anim. Physiol. Anim. Nutr.97,23–31.
Prior, M. G., O’Neil, J. B. and Sisodia, C. S. (1980): Effects of ochratoxin A on growth response and residues in broilers.
Poult. Sci.59,1254–1257.
Rahman, I., Biswas, S. K. and Kode, A. (2006): Oxidant and anti- oxidant balance in the airways and airway diseases. Eur. J.
Pharmacol.533,222–239.
Rafai, P., Bata, A., Jakab, L. and V anyi, A. (2000): Evaluation of mycotoxin contaminated cereals for their use in animal feeds in Hungary. Food Addit. Contam.17,799–808.
Ruff, M. D., Huff, W. E. and Wilkins, G. C. (1990): Characteriza- tion of the toxicity of the mycotoxins, aflatoxin, ochratoxin, and T-2 toxin in game birds. I: Chukar partridge. Avian Dis. 34, 717–720.
Ruff, M. D., Huff, W. E. and Wilkins, G. C. (1992): Characteriza- tion of the toxicity of the mycotoxins, aflatoxin, ochratoxin, and T-2 toxin in game birds. III: Bobwhite and Japanese quail.
Avian Dis.36,34–39.
Sakthivelan, S. M. and Rao, G. V. S. (2010): Effect of ochratoxin A on body weight, feed intake and feed conversion in broiler chicken. Vet. Med. Int.2010, 590432.
Sawale, G. K., Gosh, R. C., Ravikanth, K., Maini, S. and Rekhe, D. S.
(2009): Experimental mycotoxicosis in layer induced by ochratoxin A and its amelioration with herbomineral toxin binder‘Toxiroak’. Int. J. Poult. Sci.8,798–803.
Schaaf, G. J., Nijmeijer, S. M., Maas, R. F., Roestenberg, P., de Groene, E. M. and Fink-Gremmels, J. (2002): The role of oxidative stress in the ochratoxin A-mediated toxicity in proximal tubular cells. Bioch. Biophys. Acta1588,149–158.
Stoev, S. D., Djuvinov, D., Mirtcheva, T., Pavlov, D. and Mantle, P.
(2002): Studies on some feed additives giving partial protection against ochratoxin A toxicity in chicks. Toxicol. Lett.135,33–
50.
Surai, P. F., Kochish, I. I., Fisinin, V. I., Michael, T. and Kidd, M. T.
(2019): Antioxidant defence systems and oxidative stress in poultry biology: an update. Antioxidants (Basel)8,235.
Suzuki, T. and Yamamoto, M. (2015): Molecular basis of the Keap1–Nrf2 system. Free Radic. Biol. Med.88(Pt. B), 93–100.
Weichselbaum, T. E. (1948): An accurate and rapid method for the determination of protein in small amounts of serum and plasma. Am. J. Clin. Pathol.16,40–43.
Zeferino, C. P., Wells, K. D., Moura, A. S. A. M. T., Murarolli, R. A., Rottinghaus, G. E. and Ledoux, D. R. (2016): Gene expression in the kidneys of broilers fed ochratoxin A for different time periods. World Mycotoxin J.9,257–268.
Open Access. This is an open-access article distributed under the terms of the Creative Commons Attribution 4.0 International License (https://creativecommons.org/
licenses/by/4.0/), which permits unrestricted use, distribution, and reproduction in any medium, provided the original author and source are credited, a link to the CC License is provided, and changes–if any–are indicated. (SID_1)