Social media and unhealthy food nexus: Evidence from Saudi Arabia
N. Aldossari and M. Al-Mahish
pDepartment of Agribusiness and Consumer Science, College of Agriculture and Food Science, King Faisal University, Al-Ahsa, 31982, Saudi Arabia
ORIGINAL RESEARCH PAPER
Received: June 29, 2020 • Accepted: September 18, 2020 Published online: February 12, 2021
© 2020 The Author(s)
ABSTRACT
This study assesses consumers’preference for food from social media on a sample of 510 respondents from the Eastern region of Saudi Arabia using the Best-Worst Scaling method. Thefindings of the study conclude that unhealthy and nutrient-poor food items are more preferred than healthy and nutrient-rich food items.
The study recommends that the food and drug authority should intervene to increase consumers’awareness about the effect of unhealthy food items by creating social media accounts to warn consumers about the health outcomes of consuming certain unhealthy foods marketed through social media platforms.
KEYWORDS
consumer preferences, social media, unhealthy food, Best-Worst Scaling
1. INTRODUCTION
Today, many food companies invest in social media marketing to promote their products and services through various social media channels such as Snapchat, Instagram, Facebook, and Twitter. These social media platforms allow users to communicate with each other, learn about brands, and follow their preferred celebrities and influencers. The main reasons these social media platforms become popular is because they attract consumers through different marketing
pCorresponding author. E-mail: malmahish@kfu.edu.sa
techniques such as text, images, audio, and video. Currently, social media has become the fastest way to spread information. Also, social media has proved itself to be an effective tool to in- fluence people’s eating behaviours. Indeed, some social media users imitate their friends, rela- tives, celebrities, and influencers’eating habits. The consumption of fast food has risen sharply among people who have seen their friends often eat specific meals on social media (24.ae, 2020).
Therefore, this paper aims to reveal consumers’preferences for foods that are marketed through social media channels. The main question that the paper tries to answer is“are unhealthy and nutrient-poor food items on social media more preferred by consumers than healthy and nutrient-rich food items”.
A study ofLin (1995)indicated that lifestyle affects consumers’perception of food safety, but the study did not explore meal planner choices of food products. Most social media influencers in Saudi Arabia offer discount codes and coupons to encourage their followers to purchase the marketed products, since discount codes are more effective in the case of unhealthy food (Talukdar and Lindsey, 2013). Also, curiosity to try food that is advertised on social media can lead consumers to choose unhealthy food items. For example, Wang (2019) showed that curiosity increases consumers’preferences for unhealthy food. Another study byLusk (2019)used the Best- Worst Scaling method to uncover American consumers’ perception of healthy food, and the findings show that some consumers consider food healthy based on nutritional labels, while others on consumers’own diet patterns. Another US study on food marketing techniques (Bragg et al., 2020) stated that social media has become a tool that promotes unhealthy food, which affects adolescents and young adults’diet. A study on adolescents’food behaviour based on social media (Murphy et al., 2020) confirmed that unhealthy food advertisements received significantly different attention compared to healthy food items, and the UK’s unhealthy food advertisement restriction policy on TV should be extended to include social media. One study that reviewed unhealthy food and beverage brands on social media (Fleming-Milici and Harris, 2020) indicated their concerns regarding adolescents’health, since their results showed that the adolescents are connected to unhealthy food through social media. A review of youth-targeted food marketing expenditures (Rummo et al., 2020) concluded that unhealthy food and beverages are highly fol- lowed by adolescents on social media platforms. In a study conducted on a sample of UK sec- ondary school students (Calvert et al., 2020), the authors aimed to identify the factors that affect students’unhealthy eating habits. Although the surveyed students in the study were savvy of the consequences of eating unhealthy food, the authors indicated that environmental and social factors are the main deterrents for spreading healthy food consumption patterns among students.
Many families in Saudi Arabia suffer from the impact of social media, including their family members, to imitate social media celebrities, influencers, relatives, and friends’ consumption behaviour by purchasing unhealthy food products. The prolonged consumption of unhealthy food marketed on social media has caused many consumers in Saudi Arabia to suffer from many diseases such as diabetes, blood pressure, and high cholesterol. We believe that not being influenced by social media will reduce the consumption of unhealthy and poor nutrient foods and, consequently, help consumers save money. This paper aims explicitly to reveal Saudi consumers’ preferences for food products from social media through the Best-Worst Scaling method. Moreover, the paper aims implicitly to examine Saudi consumers’ awareness and consciousness of healthy and nutrient-rich food choices.
2. MATERIALS AND METHODS
Best-Worst Scaling (BWS) is an empirical method that has been widely applied to elicit the importance that consumers place on an item (Louviere et al., 2015). The method has been applied in variousfields in general and in food and consumerfields in specific (Lusk et al., 2015;
Umberger et al., 2015; Massaglia et al., 2019a, 2019b; Yeh et al., 2020). Many researchers have indicated that BWS helps to reveal the heterogeneity of consumers’ preferences and hence is better than other competing methods (Jaeger et al., 2008; Lagerkvist, 2013). Therefore, this study uses the BWS method to reveal Saudi consumers’ preferences for healthy vs unhealthy and nutrient-poor food products that are frequently bought through social media. The workflow of the study is divided into three phases: questionnaire design, data collection, and empirical analysis. The questionnaire includes questions on the socioeconomic and demographic char- acteristics of the respondents and BWS questions. The data related to respondents’ character- istics include age, gender, educational level, social status, number of household members, occupation, monthly income, illness history, and social media app usage. The choice sets of BWS questions were designed by using the two-level orthogonal main-effect design (OMED) in R software (Aizaki et al., 2014). The food items in the BWS choice sets include healthy/nutrient- rich food items and unhealthy/nutrient-poor food items that are frequently purchased via social media apps. The healthy and nutrient-rich items include sugar-free juice, Greek yogurt, oat and granola, and honey. However, consumers can purchase Greek yogurt via social media as plain Greek yogurt, Greek yogurt blended with fruits, or Greek yogurt blended with chocolate and other sweets. Thus, Greek yogurt can be considered as a healthy food item or maybe converted to unhealthy food item when blending it with sweets. Also, the same rule applies to oat and granola. Consequently, profile case BWS can be used for analysing yogurt or oat and granola with different attributes. However, in this paper, our interest is to use object case BWS to reveal consumers’preference for Greek yogurt and oat and granola as food items regardless of sellers’
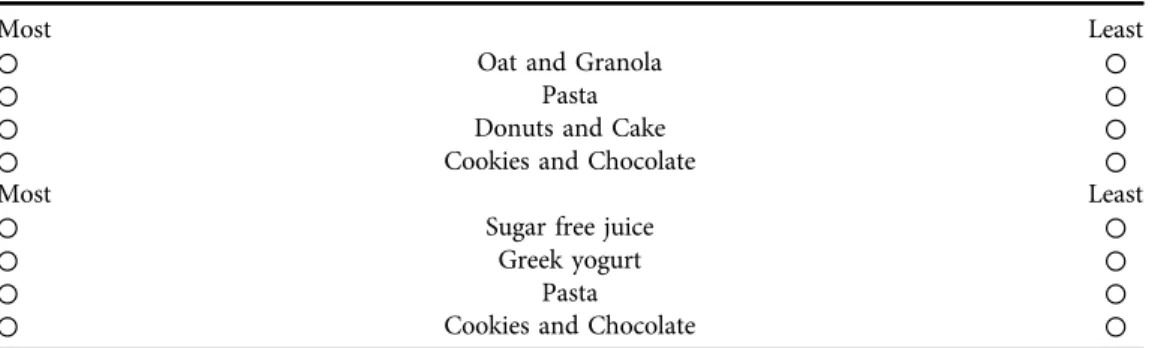
alterations and modifications. The nutrient-poor/unhealthy food items include burgers, white pasta with sauce, pizza, donuts, and cake. The general form of the BWS questions that were asked of the respondents are as follows:“Which of the following food items would you most likely buy through social media and which one the least”.Table 1shows a sample of the BWS questions that were asked of the respondents.
Table 1.Examples of best-worst questions
Most Least
○ Oat and Granola ○
○ Pasta ○
○ Donuts and Cake ○
○ Cookies and Chocolate ○
Most Least
○ Sugar free juice ○
○ Greek yogurt ○
○ Pasta ○
○ Cookies and Chocolate ○
This method allows respondents to choose only two options for each question as the most preferred and least preferred food items. Consumers’responses to the BWS questions were later analysed using a counting method and a parametric method. The counting method (Mueller and Rungie, 2009; Louviere and Flynn,2010; Aizaki et al., 2014), as the name implies, focuses on counting the frequency of each food item, i, when selected as the most preferred and j, when selected as the least preferred food item. The main equations to analyse aggregate consumers’
responses based on the counting method are below:
BWin¼BinWin (1)
std:BWin¼BWin
Nr (2)
sqrt:BWin¼ ffiffiffiffiffiffiffiffi
Bin
Win
r
(3)
std:sqrt:BWin¼ sqrt:BWin
max:sqrt:BWin
(4)
whereBWinis the difference between the number of times item i is selected as the best and as the worst,ris the total number of times food item i appears in the BWS question,Nis total number of observations, and std.BWis the standardisedBWscore. To calculate Eq. (2) for disaggregated (individual) case, the termNis removed from the equation.
The second approach to analyse BWS responses is to use the parametric approach. In our paper, we use conditional logit (CL) model, which considers the utility difference between food item i and food item j as highest utility difference. As a result, the probability (Pr) that a consumer selects food item i as most preferred and food item j as least preferred is expressed below:
Prði;jÞ ¼ exp uiuj
Pm
k¼1
Pm
l¼1;l≠kexpðukulÞ
(5)
The coefficients of the CL model are then used to calculated consumers’share of preference (SP) for each food item i as follows (Lusk and Briggeman, 2009; Aizaki et al., 2014; Caputo and Lusk, 2020):
SPi¼ expðuiÞ Pm
j¼1
exp uj
(6)
The paper uses primary data that was randomly distributed to consumers living in the Eastern region of Saudi Arabia through an online survey that was designed using qualtrics website, which allows researchers to design BWS questions through Maxdiff feature. Also, the survey was distributed using social media apps, and all questions were made mandatory to avoid drop-out.
Since in BWS method we are generally interested in counting the frequency, differences in frequency, or ratio (proportion) of frequencies, the required sample size follows the rules of
multinomial distributions (Louviere et al., 2013). Thus, the total number of observations in this study equals 510, and the sample size was selected based on the required sample size for multinomial proportions data (Thompson, 1987; Louviere et al., 2013).
3. RESULTS AND DISCUSSION
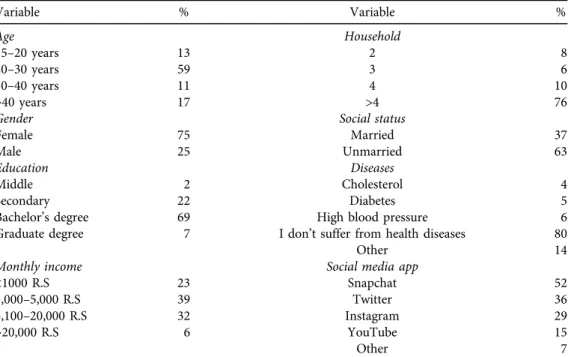
Table 2gives a brief overview of respondents’demographic and socioeconomic characteristics.
The majority of respondents are young and unmarried. Also, most respondents reported having a bachelor’s degree and not suffering from any illnesses. The preferred social media platforms for respondents were Snapchat, Twitter, Instagram, and YouTube.
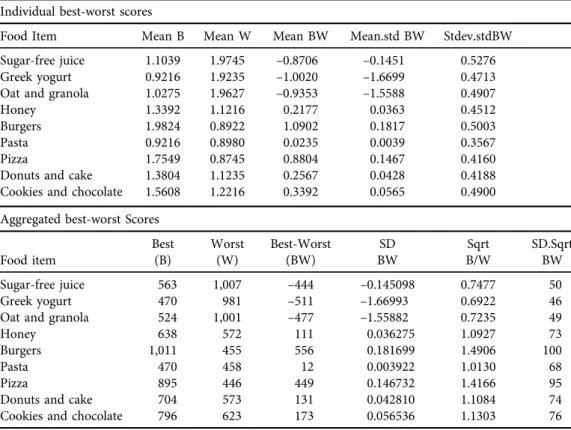
The results of the counting method are reported inTable 3and contain two subsections; one is for individual consumers as disaggregated scores and the other is for the aggregated scores.
Thefirst and the second columns in the disaggregated table show the number of times food item i is selected as best and worst, respectively, divided by the sample size. The third column shows the difference between the number of times food item i selected as the best and as the worst. The values of the fourth column are used in computing the value of stdev.stdBW in last column as mentioned in Eqs. (3) and (4). On the other hand, the standardised BW score in the aggregated table (fourth column) shows that the most preferred food items for Saudi consumers on social media are burgers, pizza, cookies and chocolate, donuts and cake, honey, and pasta. Conversely, the negative sign of the standardised score denotes that the food item j has been frequently selected as least preferred. Thus, the least preferred food items for Saudi consumers to purchase
Table 2.Summary of respondents’demographic and socioeconomic characteristics
Variable % Variable %
Age Household
15–20 years 13 2 8
20–30 years 59 3 6
30–40 years 11 4 10
>40 years 17 >4 76
Gender Social status
Female 75 Married 37
Male 25 Unmarried 63
Education Diseases
Middle 2 Cholesterol 4
Secondary 22 Diabetes 5
Bachelor’s degree 69 High blood pressure 6
Graduate degree 7 I don’t suffer from health diseases 80
Other 14
Monthly income Social media app
<1000 R.S 23 Snapchat 52
1,000–5,000 R.S 39 Twitter 36
5,100–20,000 R.S 32 Instagram 29
>20,000 R.S 6 YouTube 15
Other 7
from social media are Greek yogurt, oat and granola, and sugar-free juice. Thus, we can see that the unhealthy and nutrient-poor food items are preferred on social media by Saudi consumers more than the healthy and nutrient-rich food items. The last column in the aggregated table helps us to judge the relative importance of a food item, and the item that has a score of 100 is considered the most important food item (Mueller and Rungie, 2009). Therefore, burgers are considered by Saudi consumers to be the most important food item on social media, while Greek yogurt is considered to be the least important food item.
The CL model was estimated using R software. The results are shown in Table 4. In esti- mating the model, one of the food items has to be omitted, which is then compared with other food items (Aizaki et al., 2014). Thus, we omitted pasta when estimating the CL model.
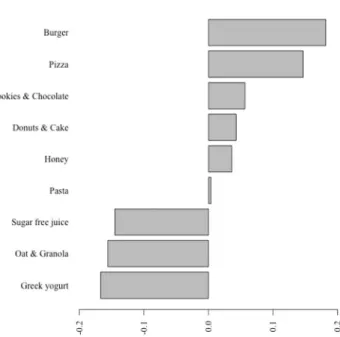
The results show that honey, burgers, pizza, donuts and cake, and cookies and chocolate are more preferred on social media than pasta. Conversely, pasta is more preferred than sugar-free juice, Greek yogurt, and oat and granola. The preference shares also show that the most favourable food item to Saudi consumers on social media is burgers followed by pizza and cookies and chocolate. Conversely, the least preferred food item is Greek yogurt. The results of Saudi consumers’preferences for food items on social media are visualised inFig. 1. It can be seen in the graph that burgers are the most preferred, while Greek yogurt is the least preferred food product. Moreover,Fig. 2shows that despite burgers are the most preferred item, it has the
Table 3.Counting method results Individual best-worst scores
Food Item Mean B Mean W Mean BW Mean.std BW Stdev.stdBW
Sugar-free juice 1.1039 1.9745 –0.8706 –0.1451 0.5276
Greek yogurt 0.9216 1.9235 –1.0020 –1.6699 0.4713
Oat and granola 1.0275 1.9627 –0.9353 –1.5588 0.4907
Honey 1.3392 1.1216 0.2177 0.0363 0.4512
Burgers 1.9824 0.8922 1.0902 0.1817 0.5003
Pasta 0.9216 0.8980 0.0235 0.0039 0.3567
Pizza 1.7549 0.8745 0.8804 0.1467 0.4160
Donuts and cake 1.3804 1.1235 0.2567 0.0428 0.4188
Cookies and chocolate 1.5608 1.2216 0.3392 0.0565 0.4900
Aggregated best-worst Scores
Food item
Best (B)
Worst (W)
Best-Worst (BW)
SD BW
Sqrt B/W
SD.Sqrt BW
Sugar-free juice 563 1,007 –444 –0.145098 0.7477 50
Greek yogurt 470 981 –511 –1.66993 0.6922 46
Oat and granola 524 1,001 –477 –1.55882 0.7235 49
Honey 638 572 111 0.036275 1.0927 73
Burgers 1,011 455 556 0.181699 1.4906 100
Pasta 470 458 12 0.003922 1.0130 68
Pizza 895 446 449 0.146732 1.4166 95
Donuts and cake 704 573 131 0.042810 1.1084 74
Cookies and chocolate 796 623 173 0.056536 1.1303 76
Table 4.Coefficient estimates for conditional logit model
Food item Coef. exp (coef) Preference share z
Sugar-free juice –0.290ppp 0.748 0.080 –7.769
(0.0373)
Greek yogurt –0.367ppp 0.692 0.074 –9.922
(0.0370)
Oat and granola –0.332ppp 0.717 0.077 –8.999
(0.0369)
Honey 0.097ppp 1.102 0.118 2.611
(0.0372)
Burgers 0.363ppp 1.437 0.155 9.775
(0.0371)
Pasta – – 0.107 –
Pizza 0.305ppp 1.356 0.146 8.172
(0.0373)
Donuts and cake 0.076pp 1.079 0.116 2.049
(0.0372)
Cookies and chocolate 0.129ppp 1.137 0.122 3.524
(0.0366) Note: Standard errors are in parentheses,
pP< 0.1,pp:P< 0.05, andppp:P< 0.01.
Fig. 1.Most preferred and least preferred food products on social media by consumers in Saudi Arabia
highest heterogeneity among consumers. That is, some consumers think burgers are important, while others think it is not important. Meanwhile, most Saudi consumers agree (low hetero- geneity) that Greek yogurt, oat and granola, and sugar-free juice are relatively not important food products on social media.
To sum it up, our results agree with findings in the literature (Fleming-Milici and Harris, 2020; Murphy et al., 2020; Rummo et al., 2020) that consumers prefer unhealthy food products from social media. Conversely, Binith Muthukrishnan (2020) and Subramaniam and Sade (2020)believe that social media can play significant role in increasing consumers’ awareness about healthy food choices.
4. CONCLUSIONS
Social media has become a popular platform for food marketing in Saudi Arabia. Many Saudi consumers either purchase food directly through social media or indirectly through social media recommendation. As social media offers many food items, ranging from healthy and nutrient- rich food to unhealthy and nutrient-poor food, this paper tries to unhide Saudi consumers’
preferences for food on social media apps using the Best-Worst Scaling approach. The results show that the most preferred food items on social media for Saudi consumers are those items that are unhealthy and nutrient-poor, such as burgers, cookies and chocolate, and donuts and Fig. 2.Heterogeneity and homogeneity among consumers in selecting food products from social media
cake. On the other hand, healthy and nutrient-rich food items were unfavourable to Saudi consumers, and the results show that consumers agree that Greek yogurt and oat and granola are not preferred. Thus, the results of this paper give an alarming message to food authorities worldwide in general and the Saudi food and drug authority, specifically, about the potential health outcomes of food marketed via social media on consumers’health, especially since most of social media users are young people and adolescents. Thus, we recommend an action to be taken by the relevant authority in Saudi Arabia to increase consumers’ awareness about consuming unhealthy and nutrient-poor food by creating social media accounts that warn consumers about unhealthy and nutrient-poor food advertisements on social media. Further- more, we recommend asking follow-up questions after each BWS question to further identify the reasons behind each consumer’s selection of most preferred and least preferred food product.
REFERENCES
24.ae (2020).Social media affects our food choices, Available at:https://20four.com/550206(Accessed: 17 September 2020), (in Arabic).
Aizaki, H., Nakatani, T., and Sato, K. (2014).Stated preference methods using R.Chapman and Hall/CRC Press, 254 pages.
Binith Muthukrishnan, K. (2020). Do the consumer behavior patterns turn natural? Drivers of organic food spending among consumers of Tiruchirapalli city.Test Engineering and Management, 82: 9262–9268, Available at: http://testmagzine.biz/index.php/testmagzine/article/view/2303 (Accessed: 17 September 2020).
Bragg, M.A., Pageot, Y.K., Amico, A., Miller, A.N., Gasbarre, A., and Elbel, B. (2020). Fast food, beverage, and snack brands on social media in the United States: an examination of marketing techniques utilized in 2000 brand posts.Pediatric Obesity, 15(5): e12546.
Calvert, S., Dempsey, R.C., and Povey, R. (2020). A qualitative study investigating food choices and perceived psychosocial influences on eating behaviours in secondary school students. British Food Journal, 122(4): 1027–1039.
Caputo, V. and Lusk, J.L. (2020). What agricultural and food policies do US consumer prefer? A best–worst scaling approach.Agricultural Economics, 51(1): 75–93.
Fleming-Milici, F. and Harris, J.L. (2020). Adolescents’ engagement with unhealthy food and beverage brands on social media.Appetite, 146: 104501.
Jaeger, S.R., Jørgensen, A.S., Aaslyng, M.D., and Bredie, W.L.P. (2008). Best-worst scaling: an introduction and initial comparison with monadic rating for preference elicitation with food products.Food Quality and Preference, 19(6): 579–588.
Lagerkvist, C.J. (2013). Consumer preferences for food labelling attributes: comparing direct ranking and best-worst scaling for measurement of attribute importance, preference intensity and attribute domi- nance.Food Quality and Preference, 29(2): 77–88.
Lin, C.-T.J. (1995). Demographic and socioeconomic influences on the importance of food safety in food shopping.Agricultural and Resource Economics Review, 24(2): 190–198.
Louviere, J.J. and Flynn, T.N. (2010). Using best-worst scaling choice experiments to measure public perceptions and preferences for healthcare reform in Australia.The Patient, 3(4): 275–283.
Louviere, J.J., Flynn, T.N., and Marley, A.A.J. (2015).Best-worst scaling: theory, methods and applications.
Cambrige University Press, p. 360.
Louviere, J., Lings, I., Islam, T., Gudergan, S., and Flynn, T. (2013). An introduction to the application of (case 1) best-worst scaling in marketing research.International Journal of Research in Marketing, 30(3):
292–303.
Lusk, J.L. (2019). Consumer beliefs about healthy foods and diets.Plos One, 14(10): e0223098.
Lusk, J.L. and Briggeman, B.C. (2009). Food values.American Journal of Agricultural Economics, 91(1):
184–196.
Lusk, K.A., Hamid, N., Delahunty, C.M., and Jaeger, S.R. (2015). Effects of an evoked refreshing con- sumption context on hedonic responses to apple juice measured using best-worst scaling and the 9-pt hedonic category scale.Food Quality and Preference, 43: 21–25.
Massaglia, S., Borra, D., Peano, C., Sottile, F., and Merlino, V.M. (2019a). Consumer preference hetero- geneity evaluation in fruit and vegetable purchasing decisions using the best–worst approach. Foods, 8(7): 266.
Massaglia, S., Merlino, V.M., Borra, D., Bargetto, A., Sottile, F., and Peano, C. (2019b). Consumer attitudes and preference exploration towards fresh-cut salads using best–worst scaling and latent class analysis.
Foods, 8(11): 568.
Mueller, S. and Rungie, C. (2009). Is there more information in best-worst choice data?: Using the attitude heterogeneity structure to identify consumer segments. International Journal of Wine Business Research, 21(1): 24–40.
Murphy, G., Corcoran, C., Tatlow-Golden, M., Boyland, E., and Rooney, B. (2020). See, like, share, remember: adolescents’responses to unhealthy-, healthy- and non-food advertising in social media.
International Journal of Environmental Research and Public Health, 17(7): 2181.
Rummo, P.E., Cassidy, O., Wells, I., Coffino, J.A., and Bragg, M.A. (2020). Examining the relationship between youth-targeted food marketing expenditures and the demographics of social media followers.
International Journal of Environmental Research and Public Health, 17(5): 1631.
Subramaniam, L.S. and Sade, A.B. (2020). Willingness to pay for functional foods to stayfit and prevent obesity amongst Malaysian youth.Test Engineering and Management, 83: 11462–11469, Available at:
http://testmagzine.biz/index.php/testmagzine/article/view/5695(Accessed: 17 September 2020).
Talukdar, D. and Lindsey, C. (2013). To buy or not to buy: consumers’ demand response patterns for healthy versus unhealthy food.Journal of Marketing, 77(2): 124–138.
Thompson, S.K. (1987). Sample size for estimating multinomial proportions.The American Statistician, 41(1): 42–46.
Umberger, W.J., Reardon, T., Stringer, R., and Mueller Loose, S. (2015). Market-channel choices of Indonesian potato farmers: a Best–Worst scaling experiment.Bulletin of Indonesian Economic Studies, 51(3): 461–477.
Wang, C. (2019). How does incidental curiosity affect consumers’unhealthy eating?Journal of Consumer Marketing, 36(6): 784–793.
Yeh, C.H., Hartmann, M., and Langen, N. (2020). The role of trust in explaining food choice: combining choice experiment and attribute best-worst scaling.Foods, 9(1): 45.
Open Access. This is an open-access article distributed under the terms of the Creative Commons Attribution-NonCommercial 4.0 International Licensehttps://creativecommons.org/licenses/by-nc/4.0/), which permits unrestricted use, distribution, and reproduction in any medium for non-commercial purposes, provided the original author and source are credited, a link to the CC License is provided, and changes–if any–are indicated.