SPECIAL FEATURES AND PROBLEMS OF RURAL SOCIETY IN HUNGARY 1 Krisztián Ritter
associate professor
Faculty for Economics and Social Sciences, Szent István University E-mail: ritter.krisztian@gtk.szie.hu
Abstract
One of the basic pillar but also the indicator of rural security is the state of the social processes at a specified region. These are significantly related to the economic, environmental and developmental status of a given country, region, micro-region. Basically, the population of more developed areas shows more favorable demographic trends, while social problems are less or in some other form than in less developed, disadvantaged areas. In Europe and Hungary, the underprivileged, peripheral rural areas have to face aging, migration and economic, social and environmental problems as results. What is more, the occasionally favourable demographic trends can often be related to the slumificating of the disadvantaged population. Based on the general situation of rural areas, this article attempts to summarize the typical social situation and main problems of domestic rural areas, relying on the relevant literature, the strategic documents of the EU and Hungary, and secondary data.
Keywords: ageing, outmigration, social problems, Roma minority, rural development JEL classification: JA14, J11
LCC code: HM831-901
Introduction
While globalization has changed the basic factors and processes of the economy over the last few decades, the agriculture, the rural areas and settlements as well as residents significantly affected by changes have found themselves in a new situation. The challenge of adaptation to this new situation has made additional special problems, tensions and new opportunities as well.
One of the most important elements of the fundamental changes is the strengthening or transformation and the new role of the category „rural”. It does not simply „degrade” this category as just the area of food supplies, but it gives it attributes and dimensions (e.g.
recreation, biodiversity, residence function, environmental protection, etc.), which can provide clear competitive advantages over urban areas. On the other hand, as the main loser of the effects of territorial processes and the declining role of agriculture, rural areas have faced many challenges (Szilágyi-Boldizsár, 2016). In this context, the recovery from disadvantaged situation, the reduction of territorial inequalities, and assistance of people living in rural areas have become the most important goals. When discussing this topic, it seems important to define the category of rural more accurately as the term is highly debated among researchers and the literature. Due to the complexity of the subject, this article provides only a brief overview of the professional opinions surrounding the term, identifying the categories officially used as rural in the EU and Hungary.
1 This work was created in commission of the National University of Public Service under the priority project KÖFOP-2.1.2-VEKOP-15-2016-00001 titled “Public Service Development Establishing Good Governance” and the Cooperative Partner/Institution
Determination of rural
It is difficult to make an exact definition for rurality or rural areas at international level, because they have complex social, economic and cultural aspects. This is true even in a smaller geographical focus, since there is no a generally accepted definition even within the EU. In many cases, rurality is associated with negative values and it is defined as a contrary to the more developed or urban areas (urban-rural relations) or solely as the field of agricultural production. Bengs and Schmidt-Thome (2005) provide a very good summary, which states that the definitions for rural are usually based on the identification of rurality as non-urban area or the emphasising of establishing characteristics of rural identity such as the extensive land use, presence of villages, social habits, etc. In a broad sense, rurality has three dimensions:
occupational, socio-cultural and ecological. Considering occupational terms, rurality is synonymous with agriculture (or other raw material-producing sector). In a socio-cultural sense it is a lifestyle based on values, behaviours and social attitudes differ from urban lifestyle.
Ecological rurality is the recognition of the importance of the natural environment for the quality of human social life (Starosta 1994).
Going beyond the general approach of the concept some countries define the rural areas in different development policies by various indicators. While the distinction is predominantly based on population or population density, there is a spreading approach that in global competition, inside certain regions, primarily big cities and their gravitation zones are successful, while the externality dependent areas located between them are not. In this approach, urban areas and the main accelerators of development are the center regions that made of big cities and their gravitation zones, and the rural areas means the less developed spaces between urban areas (Bengs and Schmidt-Thomé 2005). Regarding the concrete determination, the most accepted categorisation is made by OECD, based on population density and urbanisation level. In its strategic documents and analyses, the European Union also follows this categorisation. According to the original definition of the OECD, a rural settlement has a population density of less than 150 people per km2. Based on this: Predominantly Urban Region is where the proportion of people living in rural areas is less than 15%. Significantly Rural or Intermediate is where the proportion of people living in rural areas is between 15% and 50%.
Predominantly rural area is where the proportion of people living in rural areas is more than 50% (see OECD 1994). This original OECD methodology has created two types of distortions that undermine its comparability within the EU. The first distortion is due to the large variation in the area of local administrative units level 2 (LAU2 as part of the EU’s NUTS system2). The second distortion is due to the large variation in the surface area of NUTS 3 regions and the practice in some countries to separate a (small) city centre from the surrounding region.
The new typology seeks to remediate these two issues with the existing OECD approach. The new typology based on a grid cell system builds on a simple two-step approach to identify population in urban areas:
(1) a population density threshold (300 inhabitants/km²) applied to grid cells of 1 km²;
(2) a minimum size threshold (5 000 inhabitants) applied to grouped grid cells above the density threshold.
The population living in rural areas is the population living outside the urban areas identified through the method described above (see Eurostat, 2012). The approach based on the 1 km2
2 For more details of the NUTS system and classification see Eurostat, 2015
population grid classifies 68 % of the EU population as living in urban areas and 32 % as living in rural areas (see Figure 1.).
Figure 1. NUTS 3 regions according to the OECD classification Source: Eurostat, 2012
Due to the difficulties of unified usage, the Union, the OECD and the Council of Europe has relied the definition of rural areas to national competence to develop their own rural development policy and its implementation taking the national specificities into consideration.
While the domestic professional opinions surrounding the categorization are divided, it is generally true for Hungary that rural areas can be distinguished as the contrary to urban areas, the main field of agricultural activity and, occasionally, by negative values. The official definition of rural is supported by the relevant rural development policy and the rural development program elaborated in connection with it (Rural Development Program - RDP, 2014). During the 2014-2020 programming period, the program delimits areas eligible for rural development funds at settlement level. With the application of the 6. priority of the EU’s Rural Development Policy, rural means the following settlements, regardless of administrative status (city/village):
where the population is less than 10,000, even if the population density exceeds 120 inhabitants/km2;
where the population density is below 120 inhabitants/km2;
the extraterritorial area of the not eligible cities according to the previous two points which has higher than 2% population in extraterritorial residential areas - such as outskirts of cities;
Basically, despite of the previous points not eligible: Budapest and the settlements belonging to the Budapest agglomeration (Figure 2).
Figure 2. Settlements eligible for rural development funds in Hungary
■: Eligible ■: Eligible with its extraterritorial area □: Not eligible Source: RDP (2014)
General processes and problems of rural areas
As a general tendency, the situation of rural areas is also shaped by the effects of globalization.
Analysing the relationship between globalization and the rural areas should be just as complex and thoughtful considered as the globalization itself. Regarding the assessment of the impacts, their scale and consequences, a commonly accepted opinion is also hard to find. Without looking into the discussions and opinions, the article only addresses the most important and generally accepted findings. It can be surely stated that the globalising economy and its accompanying processes, changes in the basic factors and processes of the economy have not left rural areas untouched. Various rural areas have reacted in many ways to the globalizing capital, international migration and trade, and the deregulation of national legislation and privatization (Bengs and Schmidt-Thomé 2005). For rural areas, globalization presents opportunities but also threats at the same time. On the one hand, it offers new opportunities and on the other, it raises competition with international competition breaking into local markets (Swinburn et al., 2004). Thus, it overwhelms the geographical, legal and identity-based community boundaries that have so far protected the products of the rural areas, their local industry and cultural traditions. According to Kulcsár and Brown (2005) modernization following globalization also brings change into the social structure. In this context, it is important to point out that in the literature the social effects - which are often interpreted in negative context - of globalization particularly affects rural areas. Cultural homogenization (Fiss and Hirsch 2005), the vulnerability of local societies (Kirby 2006), the worsening poverty and inequalities (Wade 2003) could be especially emphasised.
Localization associated with globalization, which has led to the appreciation of rural areas and the widening of opportunities by focusing on local values and the role of internal resources is an important factor as well. As a result of the world economy’s processes, the changes in the role and functions of the rurality are clearly outlined. According to Clout, these changes (e.g.
depopulation of the rurality and re-population of certain areas, commuting and social movements, growing recreational and landscape maintenance, environmental demands, and the novel spatial organization of the economy) have already occurred in Europe in the 1970s (cited
by Kovács 2003), while in Eastern Europe it has started/increased by the market economy transition. Ilbery and Bowler (1998) wrote about post-productivist countryside - emerging as a result of economic and social changes - where new forms of space use can be discovered (e.g.
tourism, recreation, environmental preservation, etc.), where the spread of service, industry and technology are increasing, while rural areas are becoming increasingly differentiated (where repopulation - or even outmigration – can be found as an accompanying phenomenon).
According to Clout (1993) the whole rural economy has integrated to the regional, national and international economies and now it is much more complex and more diverse than half a century ago. Meanwhile, the role of agricultural production is constantly decreasing and agriculture is merely a production sector of the economy. Csite (2005) wrote directly of the post-agricultural rural areas.
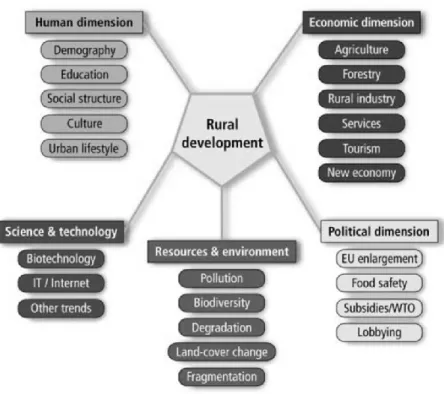
There is a significant role in all these tendencies that the effects of globalization and the technological advances lead strongly intensifying agrarian sector, employing significantly fewer people and lose the functions that was earlier predominant for the rural society. Among Heilig's list of functions and roles of the rural areas (influencing the quality and reliability of food supply through agriculture, providing natural resources, serving as place for recreational activities and biodiversity reserves), the identification of rural areas close to urban areas as an attractive residential area, the mass moving of urban populations into surrounding agglomerations, the new wave of sub-urbanization has already appeared. “This is largely promoted by the development of transportation systems and information infrastructure, the reduction of traffic and communication costs” (Heilig 2002: p. 2.). The changes can be linked to the process of urbanization, which, according to Enyedi (1998), means not only the continuous growth of the urban population (quantitative urbanization), but also the social unification process of the village and the city as well as the spread of the urban lifestyle in the whole settlements system (qualitative urbanization). The structure of local society has also changed, as the original communities are gradually supplemented or replaced by the people leaving urban areas. Valér (1987) speaks directly about the urbanization of rural society. New social actors have appeared in the European rural areas who have come from different social subsystems and economic areas, and their rural operation is also significantly different. Thus, social heterogeneity quasi has been re-produced, which characterized the rurality before the start of agricultural modernization (Tovey 2001). While in the more developed countries of Europe the above-mentioned transformation has been more or less done, countries in Central and Eastern Europe this process is still in progress. According to Csite and Kovács (2002) this transformation process has gained new elements and intensified by the political change and it still can not be regarded as completed. In parallel with the changes, the reterritorialisation of rural policy takes place in developed countries. In rural development approaches sectoral policies are replaced by spatial principles and policies affecting all rural areas (see Ray 1998), while the dimensions of rural development (Figure 3) are widening.
Figure 3.: Dimensions of rural development Source: Heilig, 2002: 6. p.
The basis of all rural development are people. If a rural area has massive outmigration of young people or if a large percentage of the population is above the age of 65, it will be very difficult to initiate endogenous economic growth. The human dimension also includes the educational level of the population, their cultural identity and their social structure. Human factors are not only relevant in the rural areas: the impact of urban life-style change on rural areas, such as changes in leisure activities or food consumption of the urban majority also have to be considered (Heilig, 2002).
The OECD definition of rural, as with definitions used by individual countries, is based on the assessment that rural regions have low population densities and are located in a region that does not contain a major urban center. In combination, low population density and relative remoteness give rise to a range of problems that have an impact on economic activity and individual well-being. This, in general terms, generates some level of disparity between the situation of rural regions and that of other regions. Rural regions must confront a number of challenges that contribute to weaker economic performance. They include: a) out-migration and ageing; b) lower educational attainment; c) lower average labour productivity; and d) overall low levels of public services (OECD, 2006).
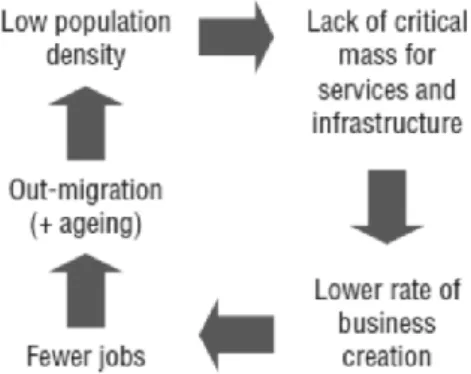
It is a concern that the increasing outmigration in the absence of jobs and the lower population density causes considerably higher unit costs and lower profitability in the construction and operation of infrastructural investments and services, and per se the needed critical mass is lacking. The result is that, in the absence of services and infrastructure - capped by the unfavorable demographic characteristics and qualifications of the population remaining in the area - the capital and economic operators, companies, businesses are leaving and avoiding the area. This further strengthens employment problems (this cycle is illustrated in Figure 4).
Patrick (1997) names this cyclic decline process of rural areas the vicious circle of declining rural regions. This process can only be triggered by only the low population density, but is often due to the decline in the agricultural sector which cause decreasing employment rates.
Figure 4. Circle of declining rural regions Source: OECD, 2006: 32. p.
The social characteristics of rural areas in the Union
Rural regions cover 44% of the EU territory, intermediate regions another 44%, while urban regions only represent 12% of the total territory. The proportions of rural and intermediate areas are roughly in balance with each other in all EU groups. Together they account for 88% of the total territory in Europe. In the EU-N13 (member states joined in or after 2004), rural regions have a higher proportion (48.4%) while urban areas only cover 4.6% of the territory. Significant differences appear when comparing Member States. Predominantly rural regions represent around 80% and more of the territory in Ireland, Finland, Estonia, Portugal, and Austria. At the other extreme, the most urbanised countries are Malta, the Netherlands, the United Kingdom and Belgium (EC, 2016). Just over one quarter (28.0%) of the EU28 population lived in a rural area in 2015, with a somewhat higher share living in towns and suburbs (31.6 %), while the biggest share of the EU28 population lived in cities (40.4%). During the five-year period from 2010 to 2015, there was a gradual increase in the number of people living in rural areas across the EU28, their relative share of the total number of inhabitants rising by 1.7 percentage points;
the increase in the share of the population living in towns and suburbs was even greater (rising by 4.7 points), while the share of people living in cities declined at a relatively rapid pace; these patterns possibly reflect Europeans leaving inner city areas in search of more (affordable) space, in suburbia, towns, or the countryside (Eurostat, 2017).
According to an analysis (see EC, 2012 or SEGIRA, 2010) population growth in rural regions continues to be extremely limited compared to urban population growth. Only 15.6% of the new population could be seen in rural regions, amounting to just 3.3 million people settling in rural regions over the period 2000-2008. The negative net migration in Eastern European Member States rural regions is a particular concern as about 1.2 million people have left in just 8 years (a decline of 2.8% compared to 2000). On the contrary, in EU15 (member states joined before 2004) rural regions newcomers reached 4.5 million in 2008 accounting for a population increase of 6.4% compared to 2000. In Western countries, two large scale processes of demographic change are taking place: a long established urbanization trend drawing population out of more remote rural areas into urban and accessible rural areas, and a more recent counter- urbanization flow out of urban areas into accessible rural areas (made possible by new transport and ICT infrastructure) increasingly under pressure from an urbanized lifestyle. The latter phenomenon is particularly evident in the case of France and the UK. Moreover, there is an increasing weight of the so-called returning migrations, i.e, people who return to their home villages after a previous migration to urban areas or abroad. In Eastern countries the exodus from rural to urban areas (especially the capital city) is at present a relevant phenomenon;
moreover, migration abroad - notably of young people and women - risks to lead to a general
impoverishment of rural areas. The latter phenomenon is particularly acute in Bulgaria, Lithuania, Poland and Romania (EC, 2008).
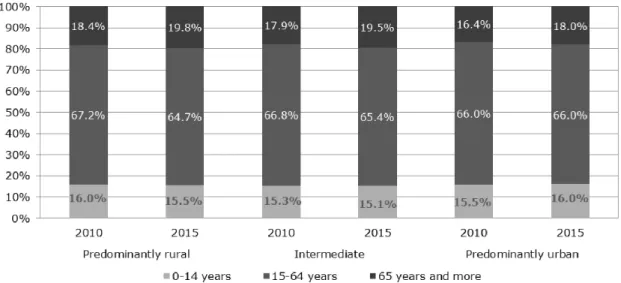
In 2015, 15.6% of the EU-28 population was younger than 15 years, the working-age population (between 15 and 64 years) represented 65.5% of the total and elderly people (65 years and above) accounted for 18.9%. Over the period 2010-2015, the proportion of elderly people increased in all types of regions. The working-age population decreased in all areas apart from urban regions, where it remained stable. The share of young people decreased in all regions except for the urban ones where it increased slightly (+0.4%) (Figure 5). The old-age dependency ratio3 for the EU-28 was 28.8% in 2015, meaning that there were broadly four persons of working age for every person aged 65 or over. This ratio is higher in EU-N13 countries (29.9%) than in EU-15 countries (24.7%), thus there are more elderly people in relation to the working population in the EU-N13. In rural regions the ratio touched 35.5% in EU-15 countries (indicating a high share of elderly people), while it was the lowest in the urban regions of all EU groups (EC, 2016).
Figure 5. Changes in the age structure of the EU-28 population by type of region, 2010- 2015 (%)
Source: EC, 2016: 6. p.
The number of people at risk of poverty or social exclusion is one of five headline targets for monitoring the Europe 2020 strategy, which set the goal for the EU to become a smart, sustainable and inclusive economy, among others by reducing the number of people at risk of poverty or social exclusion by at least 20 million4. Those people who are at risk of poverty or social exclusion are in at least one of the following three situations: at risk of (monetary) poverty; severely materially deprived; living in a household with very low work intensity. In 2015, there were 118.8 million Europeans classified as being exposed to at least one of the three types of risk, with 9.2 million facing all three of these risks. A higher proportion of the EU‑28 population living in rural areas (compared with urban areas) faced the risk of poverty or social exclusion. In 2015, just over one quarter (25.5%) of the rural population was at risk of poverty or social exclusion, while lower shares were recorded for people living in cities (24.0%) and
3 The old-age dependency ratio is defined as the number of people older than 65 years in relation to those aged between 15 to 64 years
4 According to the related Hungarian commitment, Hungary intends to reduce the number of people living in poverty by half a million by 2020 (NSIS, 2014).
especially those living in towns and suburbs (22.1%), perhaps explaining, at least in part, the movement towards towns and suburbs. In 2015, almost one in five (19.8%) inhabitants living in EU‑28 rural areas was at risk of (monetary) poverty, compared with 9.1% of the rural population that was aged less than 60 and living in a household with very low work intensity, and 8.3% of the rural population that was living in severe material deprivation (Eurostat, 2017).
Remoteness is an important element of difficulty in rural areas, involving relevant aspects of life. Concentration of the main services in urban areas can impact on the quality of life of groups already at risk of social exclusion: health services for elderly or disabled, child care facilities for female workers, etc. The accessibility of schools is another important question for children and parents living in remote rural areas. Moreover, in some remote rural areas, also a reduction in existing public and private services (e.g. retail, postal offices, banks, childcare, libraries, kindergartens) is ongoing (EC, 2008). In 2015, some 4.2% of the EU‑28 population5 living in rural areas reported unmet needs for health care during 12 months prior to a survey. This share was somewhat higher than the corresponding figures recorded for towns and suburbs (3.8%) or for cities (3.5%) (Eurostat, 2017).
Education (like health) can play an important role in determining life chances and raising the quality of life of an individual. Education also has social returns, insofar as raising overall educational standards will likely result in a more productive workforce which, in turn, may drive economic growth. A lack of educational skills and qualifications is likely to restrict access to a variety of jobs/careers. In 2015, the EU‑28 early leavers’ rate from education and training (defined for people aged 18 to 24 years) peaked at 12.2% in rural areas, compared with 11.5%
in towns and suburbs, and 9.8% in cities. There were however considerable differences between the EU Member States. Particularly high early leavers’ rates were recorded in the rural areas of a number of principally eastern and southern Member States, for example, Slovakia, Spain, Greece, Hungary, Estonia, Romania and Bulgaria (where the gap between rates in rural areas and in cities ranged from 7.3 to 25.8 percentage points). Turning to the other end of the educational attainment ladder, in 2015 just over one quarter (27.9%) of the EU‑28’s rural population (aged 30 to 34 years) had a tertiary level of educational attainment; this figure could be compared with a share of one third (33.4%) for people living in towns and suburbs and almost a half (48.1%) among city-dwellers. An analysis over time reveals that the rural areas consistently recorded the lowest level of tertiary educational attainment, while the gap between rural areas and cities grew (Eurostat, 2017).
There are some specific groups at risk of poverty and exclusion in rural areas identified by the EU. These groups are the women, the youth, the children, the elderly, the immigrants, the farmers and the ethnic minorities. The case of vulnerable ethnic minorities, social exclusion and marginalisation in rural areas can not only be seen as a reflection of poverty through lack of access to monetary resources. Within the New Member States there are many different ethnic and linguistic minorities, but one group - the Roma - stands out in cross-national profiles of ethnic minorities. The Roma population is facing a high risk of poverty and social exclusion:
predominance of large households with many children; bad housing and health conditions; low educational attainment; low employment rate and high unemployment rate. The Roma
5 The share of people (aged 16 and over) who reported unmet needs for health care due to expense, distance to travel, or the length of waiting lists. The ability to pay for/expense of medical services is clearly linked to the distribution of income, while people living in rural areas are more likely to be deterred from seeking health care services as a result of travelling long distances (medical services tend to be concentrated in towns and cities), and the length of waiting lists reflects the supply of and the demand for services (which may vary according to the treatment, therapy or intervention required)(Eurostat, 2017)
population in rural areas often lives in segregated settlements or in remote areas of villages, under very poor housing conditions (EC, 2008).
The social characteristics of rural areas in Hungary
Using the OECD/EU typology in 2010 slightly less than half of Hungary's population of nearly 10 million (46.6%) lived in predominantly rural, 17.5% in predominantly urban areas and 36%
in intermediate regions. The proportion of Hungarian rural population is among the highest comparing to the Member States. The population density of rural areas is lower than the national average, with about two-thirds of it. 66.6% of the country's territory is predominantly rural and 0.6% is predominantly urban areas. The economic development of the rural areas is significantly below the EU average, less then its half (47%), while the whole of the country's economic development reaches two thirds of the EU average. The employment rate in 2011 was 55.8%, which was lower among women, 50.6%. Both indicators lag behind the EU average (64.3% and 58.5% in case of women). Employment rates in rural areas were 52.4%, well below the EU average (62.3%). The proportion of low-income people in rural areas is higher than in the urban settlements (RDP, 2014). Domestic territorial processes are characterized by the increasing geographical concentration of the economy in addition to the continuous decline in population. The main dividing lines of the increasing regional differences lies between developed and underdeveloped regions, big cities and small settlements (NDTDP, 2014). The outmigration from the most underdeveloped areas continues that is followed by the rearrangement of ethnic proportions. The biggest loss in recent years was suffered by Northern Hungary and Southern Transdanubia, the main target areas of cohesion policy, while the population of the most developed Central-Hungarian regions grew. However, in most parts of the country natural demographic decline has been also increased by outmigration (NSIS, 2014).
Large territorial differences could also be detected inside the settlement system. The vast majority of settlements that have lost the economic significance and population retention capability were among the villages and especially small villages. Primarily Western and Southern Transdanubia, to a lesser extent the Upper Tisza Area and the Northern Mountains, can be identified with small village settlement structure (RDP, 2014). Due to the population decline in larger villages, the numbers of small villages is constantly expanding with new members. In 1990 there were 918 settlements with less than 500 inhabitants, with 260 thousand people, while in 2015 it has increased to 1055 with a total population of nearly 281 thousand (Table 1).
Table 1. The distribution of the permanent population and the settlements by settlement-size categories in Hungary, 1990-2015 (per capita and %)
category by number
of inhab.
1990 2000 2010 2015
Population Settlement Population Settlement Population Settlement Population Settlement capita % pcs % capita % pcs % capita % pcs % capita % pcs % 0-199 35108 0,3 266 8,7 37115 0,4 300 9,6 42179 0,4 344 10,9 42625 0,4 346 11,0 200-499 224985 2,1 652 21,3 239195 2,3 697 22,2 238058 2,4 700 22,2 238279 2,4 709 22,5 500-999 516019 4,9 705 23,0 504130 4,9 691 22,0 488429 4,8 678 21,5 482581 4,8 673 21,4 1000-4999 2473303 23,5 1166 38,1 2456088 24,0 1163 37,1 2435617 24,1 1147 36,4 2389485 23,8 1134 36,0 5000-9999 922843 8,8 132 4,3 975897 9,5 141 4,5 939340 9,3 136 4,3 953103 9,5 139 4,4 10000- 4395729 41,8 141 4,6 4294857 41,9 142 4,5 4279595 42,3 146 4,6 4211315 42,0 144 4,6 Budapest 1956819 18,6 1 0,0 1747305 17,0 1 0,0 1694900 16,8 1 0,0 1705272 17,0 1 0,0 Total 10524806 1 3063 1 10254587 1 3135 1 10118118 1 3152 1 10022660 1 3146 1
Source: Own edition based on TeIR, 2017
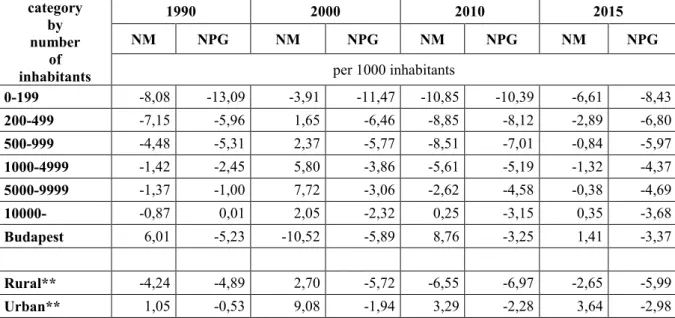
Most villages are characterized by aging and outmigration, which, in addition to social problems, endangers the survival of settlements. As far as demographic trends are concerned (see Table 2), the indicators of small and very small villages are worst in all cases and, with the exception of the year 2000, the values of the villages with a population of less than 10000 are always negative. If we use the categorization of the rural development program for comparing the averages of rural areas to the average of urban areas - without Budapest - then the demographic problems of the rurality are also outlined.
Table 2. Net Migration (NM) and Natural Population Growth (NPG) in Hungary by settlement-size categories *, 1990-2015 (per 1000 inhabitants)
category by number
of inhabitants
1990 2000 2010 2015
NM NPG NM NPG NM NPG NM NPG
per 1000 inhabitants
0-199 -8,08 -13,09 -3,91 -11,47 -10,85 -10,39 -6,61 -8,43 200-499 -7,15 -5,96 1,65 -6,46 -8,85 -8,12 -2,89 -6,80 500-999 -4,48 -5,31 2,37 -5,77 -8,51 -7,01 -0,84 -5,97 1000-4999 -1,42 -2,45 5,80 -3,86 -5,61 -5,19 -1,32 -4,37 5000-9999 -1,37 -1,00 7,72 -3,06 -2,62 -4,58 -0,38 -4,69
10000- -0,87 0,01 2,05 -2,32 0,25 -3,15 0,35 -3,68
Budapest 6,01 -5,23 -10,52 -5,89 8,76 -3,25 1,41 -3,37 Rural** -4,24 -4,89 2,70 -5,72 -6,55 -6,97 -2,65 -5,99
Urban** 1,05 -0,53 9,08 -1,94 3,29 -2,28 3,64 -2,98
Note: *regarding permanent population **by the categorisation of the Rural Development Programme - the urban category does not contain the data of Budapest.
Source: Own edition based on TeIR, 2017
The social problems of the small village areas are indicated by the twice as high rate of unemployment and the number of social assistance recipients than the average of rest of the country. In these areas no targeted interventions have been made to improve the availability of public services and the conditions of access to work, and there has been no significant progress in the field of transport development since the state of the roads and the quality and quantity of public transport services do not meet the needs of the population. It is difficult to develop the infrastructure in these areas due to the very low number of inhabitants which often makes per capita costs irrationally high (e.g. in the fields of sewerage, waste management, public transport and road reconstruction) (NDTDP, 2014).
The data of the census 2001 shows 190000 people declared themselves Gypsies (Roma) regarding their ethnicity, while the researchers estimated the number of gypsies to 320000 in 1971, to 468000 in 1993, and to about 570000 in 2003 based on representative Gypsiy-studies.
This represented nearly 5.5 percent of the country's total population in 2003. Researcher estimations indicates the number of Roma among 650-750 thousand for the years 2010, adding that “the Roma population certainly does not exceed one million and certainly more than 700,000 people”. The employment rate of the Roma population is barely 20%. The 10%
employment rate of Roma women is particularly worrying. This is linked to the extremely bad
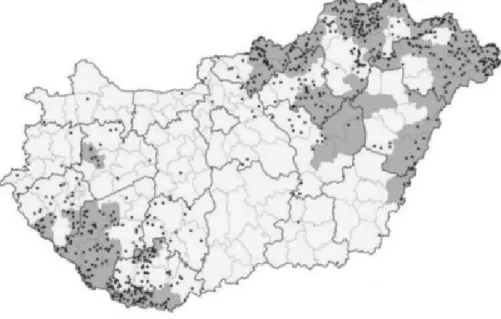
state of health (Roma people die on average 10 years earlier than non-Roma people), low educational attainment (just 20% reach maturity), and the lotlike, substandard living environment. In these areas, criminality and ethnic conflicts are strongly present. In the Roma population, the poverty rate approaches to the level of the year 2000 (70%) in 2009 (NSIS, 2011). It is also important to note that Roma population is regionally situated unevenly in the country (Figure 6).
Figure 6. Areas and settlements with a high proportion of Roma population, 2011 Note: • Settlements with a Roma population of more than three times the national average (3.16%). ■ Micro-regions with a Roma population of more than two times the national average (3, 18%)
Source: NDTDP, 2014
In many counties, the share of Roma minority from the total population is below 3%, while it is approaching 15% in Borsod-Abaúj-Zemplén and Heves counties. In addition, territorial differences are extreme in smaller territorial units: in many settlements or micro-regions the majority of the population is Roma. More than 60% of total Roma population live in rural areas, mostly in segregated areas, in poor housing conditions. There are about a hundred settlements in the country that have become permanently a poor/gypsy ghetto, and other two hundred settlements will have to face the same situation in the near future due to apparently unstoppable processes. The majority of this kind of ghettos are located in the depressed areas (north-east and south-west areas of the country) with typically small-size settlement structure. As a consequence, regional segregation can be observed (NSIS, 2011).
Based on statistical data (Table 3), it can be concluded that settlements with a population of less than 5000 show a higher proportion of Roma population. In this respect, compared to the 1990 census, instead of the municipalities that has less than 200 inhabitants (especially in 2011), the settlements with a population of 200-500 took the lead.
A significant proportion of areas with lack of employment and a high proportion of inhabitants receiving social aid belongs to the areas that has high rate of Roma populations. These areas are continously experiencing serious employment problems, the unemployment rate exceeds the average of the rest of the country more than twice and the per capita income is less than two-thirds of the country's rest. For inhabitants living in these areas typically in small villages
or in the outskirts of larger settlements have a significantly limited access to public services, while the quality of available services is typically below the national average. Reducing public transport options makes it difficult for people living here even to leave their settlements, and most of the families living in small villages and segregated settlements are characterized by the complete lack of the tools of geographical or social mobility and isolation (RDP, 2014).
Table 3. The rate of Roma population in total permanent population, by settlement-size categories, 1990-2011 (%)
category by number
of inhabitants 1990 2001 2011
0-199 3,22 3,36 5,53
200-499 2,90 4,04 7,09
500-999 2,90 3,86 5,95
1000-4999 2,42 3,37 5,49 5000-9999 1,59 2,41 3,69
10000- 1,18 1,77 2,66
Budapest 0,42 0,82 1,27
National average 2,61 3,51 5,74
Source: own edition based on KSH Census data, 2017
Summary
One of the key elements of global processes is the strengthening, transformation, and the new role of the category rural, since it means a completely new social and economic dimension in developed countries. Its manifestation is the increasing mass of people moving into the rural parts of agglomerations, the decline of the population of large cities, the economic development of rural areas. In parallel increasing attention and significance is given to product quality, public safety, health, personal development, equal opportunities, rest, etc. In addition, as the main space of agricultural and food ingredient production, rural territories play a prominent role in the EU's Common Agricultural Policy (CAP). Overall, the OECD and EU documents emphasize the increasing multifunctionality of agriculture and rural areas.
At the same time, despite the emphasis on the new values of rurality, the problems caused by the decreasing role of agriculture can not be ignored. The OECD also acknowledges that although rural can not be regarded as the synonym of underdevelopment, rural areas show a significant (socioeconomic) lag behind the rest of the regions, indicated by large-scale unemployment, outmigration, aging, unfavorable qualifications, the lack of infrastructure, the low level of services. Rural areas in Hungary show similar processes as outlined in the OECD and EU analyzes. Areas closer to the more developed areas, larger centers, cities and the global economy are typically characterized by more favourable economic and social trends, while peripheral rural areas shows unfavourable situation generating increasing territorial differences.
Despite the positive examples and tendencies, rural areas are lagging behind in general in Hungary. One of the most important pillars of rural security are the social aspects. In this approach, the development of these factors and the mitigation of the social problems of the rural areas can be an important basis for the development of rural security. Of course, this is not conceivable by a development policy without a complex approach which regards economic, cultural and environmental considerations as well.
Acknowledgement
This work was created in commission of the National University of Public Service under the priority project KÖFOP-2.1.2-VEKOP-15-2016-00001 titled “Public Service Development Establishing Good Governance” and the Cooperative Partner/Institution
Literature
1. Bengs, C. - Schmidt-Thome, K. (eds.) (2005): Urban-rural relations in Europe, ESPON Project 1.1.2 Part 1: Final Report. Helsinki: Centre for Urban and Regional Studies, University of Technology
2. Clout, H. (1993): European Experience of Rural Development. Report for the Rural Development Commission. Strategy Review: Topic Paper no. 5. London: Department of Geography, University College London
3. Csite, A. - Kovách, I. (2002): Vidéki történet. (Rural story). In: Kovách, I. (ed.):
Hatalom és társadalmi változás. A posztszocializmus vége. Budapest: Napvilág. pp.
217-308.
4. Csite, A. (2005): Reménykeltők. Politikai vállalkozók, hálózatok és intézményesülés a magyar vidékfejlesztésben 1990-2002 között. Budapest: Századvég
5. EC (2008): Poverty and social exclusion in rural areas. Final study report.
Luxembourg: European Commission, Directorate General for Employment, Social affairs and Equal opportunities
6. EC (2012): A view on employment, growth and innovation in rural areas. SWD(2012) 44 final. Commission staff working document. European Commission: Brussels 7. EC (2016): CAP Context Indicators 2014-2020 - 2016 update.
8. Enyedi, Gy. (1998): A városnövekedés szakaszai. (Phases of urban sprawling).
Budapest: Akadémia Kiadó, 115 p
9. Eurostat (2012): Focus on territorial typologies. In: Eurostat Regional Yearbook, 2012.
Luxembourg: Publications Office of the European Union. pp. 193-201.
10. Eurostat (2015): Regions in the European Union. Nomenclature of territorial units for statistics. NUTS 2013/EU-28.
11. Eurostat (2017): Eurostat Regional Yearbook, 2017. Luxembourg: Publications Office of the European Union.
12. Fiss, P. C. - Hirsch, P. M. (2005): The discourse of globalization: Framing and sensemaking of an emerging concept. American Sociological Review (2) pp. 29-52.
13. Heilig, G. K. (2002): European Rural Development (ERD). Project Description.
Laxenburg, Austria: International Institute for Applied Systems Analysis 14. https://ec.europa.eu/agriculture/sites/agriculture/files/cap-
indicators/context/2016/full-text_en.pdf
15. Kirby, P. (2006): Theorising globalisation’s social impact: proposing the concept of vulnerability. International Political Economy (4) pp. 632-655.
16. Kovács, T. (2003): Vidékfejlesztési politika. (Rural Development Policy). Budapest- Pécs: Dialóg Campus
17. Kulcsár, L. - Brown, D. L. (2005): Modernizáció és Vidékfejlesztés (Modernisation and Rural Development). Korunk (4) pp. 10-15.
18. lbery, B. - Bowler, I. (1998): From agricultural productivism to post-productivism. In Ilbery, B. (ed.): The geography of rural change. London: Longman. pp. 57–84.
19. NDTDP (2014): National Development and Territorial Development Program.
(NEMZETI FEJLESZTÉS 2030 - Országos Fejlesztési és Területfejlesztési Koncepció). Magyar Közlöny (1) pp. 10-299.
20. NSIS (2014): National Social Inclusion Strategy II. (Magyar Nemzeti Társadalmi Felzárkózási Stratégia II. Tartósan rászorulók - szegény családban élő gyermekek - romák (2011–2020). Frissített változat). Budapest: Emberi Erőforrások Minisztériuma, Szociális És Társadalmi Felzárkózásért Felelős Államtitkárság
21. OECD (1994): Creating rural indicators for shaping territorial policy. Paris: OECD 22. OECD (2006): The New Rural Paradigm. Policies and Governance, Paris: OECD 23. Patrick, J. D. (1997): A rurális térségek fejlesztésének problémái és prioritásai
Írországban. (Problems and priorities of rural development in Ireland). In: Horváth, Gy. (ed.): Régiók felemelkedése és hanyatlása. Regionális átalakulás a Brit- szigeteken. Pécs: MTA RKK. pp. 139-150.
24. Ray, C. (1998): Culture, Intellectual Property and Territorial Rural Development.
Sociologia Ruralis (1) pp. 3-20.
25. RDP (2014): Rural Development Program of Hungary. Budapest: Prime Ministry 26. SEGIRA (2010): Study on employment, growth and innovation in rural areas.
European Commission: Brussels
27. Starosta, P. (1994): Ruralization and Rurality: Three Perspectives. In: Symes, D. - Jansen, A. J. (eds.): Agricultural Restructuring and Rural Change in Europe.
Wageningen: Agricultural University. pp. 65-74.
28. Swinburn G. - Goga S. - Murphy F. (2004): Handbook of Local Economic Development. Gütersloh: Bertelsmann Stiftung; London: UK DFID; Washington D.C.: The World Bank
29. Szilágyi T., Boldizsár G.: (2016) A biztonságos vidék, mint az állam létfeltétele PRO SCIENTIA RURALIS 1:(4) pp. 24-34.
30. Tovey, H. (2001): Creating and re-creating modernity: peasantisation and depeasantisation in Ireland. In: Granberg, L.- Kovách, I. (eds.): Europe’s Green Ring.
Ashgate: Aldershot. pp. 306-329.
31. Valér, É. (1987): Az urbanizálódás falvakat érintő fő sajátosságai. (Main rural characteristics of urbanisation) A Falu (2) pp. 31-37.
32. Wade, R. H. (2003): The Disturbing Rise in Poverty and Inequality: Is It All a “Big Lie”? In: Held, D. - Koenig, A. M. (eds.): Taming Globalization: Frontiers of Governance. Cambridge: Polity Press. pp. 18-46.