Cite this article as: Fülöp, V., Jakab, G., Tóth, B., Balogh, E., Antal, I. "Study on Optimization of Wet Milling Process for the Development of Albendazole Containing Nanosuspension with Improved Dissolution", Periodica Polytechnica Chemical Engineering, 64(4), pp. 401–420, 2020.
https://doi.org/10.3311/PPch.15569
Study on Optimization of Wet Milling Process for the
Development of Albendazole Containing Nanosuspension with Improved Dissolution
Viktor Fülöp1, Géza Jakab1, Bence Tóth1, Emese Balogh1,István Antal1*
1 Department of Pharmaceutics, Faculty of Pharmacy, Semmelweis University, H-1092 Budapest, Hőgyes Endre Street 7., Hungary
* Corresponding author, e-mail: antal.istvan@pharma.semmelweis-univ.hu
Received: 13 January 2020, Accepted: 08 March 2020, Published online: 24 July 2020
Abstract
The main objective of this work was to show the potential of the optimization of top-down wet planetary bead milling process parameters (milling speed, process time and size of the milling medium) by Design Of Experiments (DOE) approach for the development of albendazole (ABZ) containing nanosuspension with improved dissolution. In addition, the influence of process parameters (capacity of milling container, applied volume of milling beads, size of the milling medium, milling speed, milling time) on ABZ polymorphic transition has also been investigated. The optimized, milled formula yielded ~ 145.39 times reduction in mean particle size (182.200 ± 1.3130 nm) compared to unmilled dispersion, which demonstrated 13.50 times gain in mean dissolution rate value compared to the unmilled dispersion in medium at pH = 1.2. No lag time values were observed in the dissolution kinetics of the nanosuspension in comparison with the unmilled samples. Moreover, maximal mean solubility value was also improved by 1.45 times compared to the unmilled suspension, in medium at pH = 6.8, supporting the significance of the Ostwald-Freundlich equation. Diffraction pattern comparisons have indicated a polymorphic transition of albendazole to Form II, which was more pronounced in smaller container at high milling speed values and prolonged operations.
Keywords
albendazole nanosuspension, wet media milling, dissolution improvement, Powder X-Ray Diffractometry (PXRD), Design Of Experiments (DOE)
1 Introduction
One of the major obstacles of the development of highly potent new drug candidates is the poor water solubility of these compounds, which hinders their therapeutic appli- cation [1]. Albendazole (ABZ) is a benzimidazoles-type, broad-spectrum anthelmintic for the treatment of intestinal helminth infections [2, 3], also showed promising results in chronic systemic therapies of cyst and echinococcus infes- tations [4]. This compound has a pH dependent, poor water solubility, a minimal of 0.016 mg/ml in pH = 6.0 buffers and a maximal of 0.376 mg/ml in medium at pH = 1.2 [5].
It has an octanol-water partition coefficient (log P) value of 3.83 [6], which is high, according to the Biopharmaceutical Classification System (BCS) drug permeability classifi- cations [7]. As a result, ABZ is classified as a BCS Class II drug [8]. The melting point of ABZ is high, it was 197.7 °C according to our investigations [9], in agreement with other experiment in the literature 200–230 °C [10].
The effective dose of this compound is relatively high (200 mg human) [11] 7.5–10 mg/kg cattle and 5 mg/kg sheep in animal healthcare [2, 3]. Pragmatic approaches for chemo-therapy of hydatid patients necessitate focusing on improved transport, targeting, modulation of the phys- icochemical parameters and metabolic decomposition of benzimidazoles [12]. An excellent review on recrystalli- zations, identification, stability and solubility evaluations of enantiotropically related albendazole polymorphs were performed by Pranzo et al. [13]. According to the authors there are two polymorphs available for ABZ, Form I (com- mercially available form) and Form II (recrystallized from N,N-dimethylformamide). Both forms proved to be physi- cally quite stable, likely due to a high-energy barrier for the activation of the interconversion. Temperature dependent solubility studies revealed, that on 25 °C solubility of Form I is better, than Form II. They also reported, that 80 °C is the
interception of the solubility vs. temperature curves, where the solid–solid transition is beginning. This observation confirms, that Form I represent the metastable polymorphs at ambient temperature. Application of a metastable Form I may be advantageous (e. g., for exploiting higher solubility in the gastrointestinal tract) only when the kinetics of con- version would be slow, namely when the energetic barrier Form I → Form II cannot be overcome during specific storage conditions. In this respect, the metastable phase should be kept cool and dry and should not be too finely subdivided [13].
Pharmaceutical nanosuspension is defined as colloi- dal, biphasic systems, in which solid drug particles are very finely dispersed in an aqueous vehicle, without any matrix material, stabilized by surfactants and/or poly- mers [14, 15]. The particle size of the solid particles in nanosuspensions is usually less than 1 μm with a mean par- ticle size ranging between 200 and 600 nm [16]. The poten- tial benefits of the nanosuspension technology for poorly soluble drug delivery are increased drug dissolution rate, increased rate and extent of absorption, hence the bioavail- ability of a drug (area under plasma concentration versus time curve, onset time, peak drug level), reduced variabil- ity, reduced fed/fasted effects. They have low incidence of side effects caused by the excipients, increased resistance to hydrolysis, to oxidation and physical stability to settling.
Compared to microparticles nanoparticles have another outstanding feature, which is the increased adhesiveness to tissues, usually due to an increased contact area of small particles versus large particles (at identical total particle mass), which lead to improved oral absorption and pene- tration capability in case of topical routes of administra- tions [17]. Reduced administration volumes are essential for intramuscular, subcutaneous, and ophthalmic delivery.
By surface modifications they can also provide the passive targeting [18–20]. The ease of scale-up and low bath-to- batch variability could be mentioned as the main advan- tages of the utilizations of nanosuspensions, while the most common disadvantages are high energy investment during manufacturing, immunotoxicity and non-specific uptake in reticuloendothelial system (RES) organs [18–21]. There are two converse methods available for the manufacturing of nanosuspensions. The assembling ‘bottom-up’ approaches, starting from molecules and building up to nano-sized particles, including microprecipitation, microemulsion and melt emulsification. The other group of techniques is referred to as ‘top-down’ variants, which are disintegration approaches from large particles, usually microparticles to
nanoparticles, including high-pressure homogenization, media milling and there are combination methods as well, merging the advantages of both methods [22, 23].
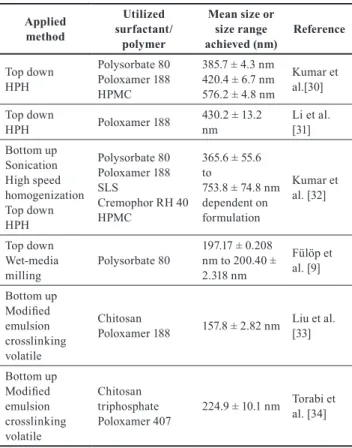
Post processing nanosuspensions into solid dosage forms in order to improve physical stability has shown great interest e. g. spray-drying [24, 25], freeze-dry- ing [26], fluid bed coating [27], electro-spraying [28] and hot melt extrusion [29] techniques have been successfully applied developing various formulations containing redis- persable nanocrystals. An overview of albendazole con- taining nanosuspension formulations available in the liter- ature have been summarized in Table 1.
Central Composite Design (CCD) is a response surface design which provides information on direct effects, pair wise interaction effects and curvilinear variable effects and is widely used for formulation and process optimi- zation in the field of pharmaceutical product develop- ment [35]. Desirability is an objective function that ranges from zero outside of the limits to one at the goal. The opti- mization module searches for a combination of factor lev- els that simultaneously satisfy the criteria placed on each of the responses and factors. To include a response in the opti- mization criteria it must have a model fit through analy- sis or supplied via an equation only simulation. Factors are
Table 1 Albendazole nanosuspension formulation approaches available in the literature
Applied method
Utilized surfactant/
polymer
Mean size or size range
achieved (nm) Reference Top down
HPH
Polysorbate 80 Poloxamer 188 HPMC
385.7 ± 4.3 nm 420.4 ± 6.7 nm 576.2 ± 4.8 nm
Kumar et al.[30]
Top down
HPH Poloxamer 188 430.2 ± 13.2
nm Li et al.
[31]
Bottom up Sonication High speed homogenization Top down HPH
Polysorbate 80 Poloxamer 188 SLSCremophor RH 40 HPMC
365.6 ± 55.6 to753.8 ± 74.8 nm dependent on formulation
Kumar et al. [32]
Top down Wet-media
milling Polysorbate 80 197.17 ± 0.208 nm to 200.40 ± 2.318 nm
Fülöp et al. [9]
Bottom up Modified emulsion crosslinking volatile
Chitosan
Poloxamer 188 157.8 ± 2.82 nm Liu et al. [33]
Bottom up Modified emulsion crosslinking volatile
Chitosan triphosphate
Poloxamer 407 224.9 ± 10.1 nm Torabi et al. [34]
automatically included "in range". Numerical optimization uses the models to search the factor space for the best trade- offs to achieve multiple goals. The numerical optimization finds a point, that maximizes the desirability function.
The characteristics of a goal may be altered by adjusting the weight or importance. For several responses and fac- tors, all goals get combined into one desirability function.
People become distracted by trying to always get a very high desirability value. The value is completely dependent on how closely the lower and upper limits are set relative to the actual optimum. The goal of optimization is to find a good set of conditions that will meet all the goals, not to get to a desirability value of 1.0. Desirability is simply a math- ematical method to find the optimum. Contour, 3D surface, and perturbation plots of the desirability function at each optimum can be used to explore the function in the fac- tor space [36]. The desirability function can be applied for the optimization of multiple response processes finding the levels of the controllable independent factors, that provide the most desirable Yi response values. The di (Yi) uses num- bers to the possible response Yi, where di (Yi) = 1 represents a completely desirable value and di (Yi) = 0 demonstrates a completely undesirable value.
After fitting response model equations for all Y variables and defining the goals, the individual desirabilities of multi- ple responses are combined for the overall desirability of D calculating using the geometric mean function. For exam- ple, in our case for five responses (Eq. (1)) as follows:
D d Y d Y
d Y d Y d Y
=
(
×)
×(
×)
×
(
×)
×(
×)
×(
×)
1 1 2 2
3 3 4 4 5 5
1 5
. (1)
This article is divided into three different sections.
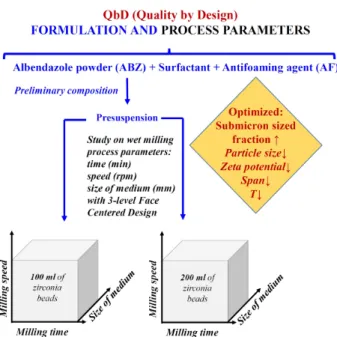
The first section emphasizes the potential of the optimi- zation of loading composition and formulation factors of the top down wet planetary bead milling method (Fig. 1).
Our goal was to prepare ABZ nanocrystals with size dis- tribution parameters similar to those, produced by novel modified variant of the so-called emulsion crosslinking volatile method [33, 34].
Process parameter optimization was performed by design of experiments (DOE) approach, which is a useful tool for the Quality by Design (QbD) concept [37]. There are numerous DOE approaches available for nanosuspen- sion development e. g. evaluation of one variable at a time (OVAT) – type [38], 22 – type factorial [39], 32 – type fac- torial [40, 41], Box-Behnken – types [38,42].
Utilization of the microhydrodynamic models for milling parameter optimization, ideal milling beads selection and
describing their fluctuating motion during high energy Wet Stirred Media Milling (WSSM) process [43] has also gained attention in recent years [44]. Particle size distributions have been defined by dynamic light scattering and laser diffrac- tion methods. Long term physical stability determination of the optimized nanosuspension formula as a liquid dosage form was not investigated in this study, only a short 56 days long demonstration was included. The potential stabiliza- tion principal as a reconstitutable solidified dosage form has already been reported in a previous article [9].
Section 2 focuses on in vitro solubility and dissolution studies, which describes the impact of the particle size reduction and the solubilization on the water solubility of albendazole along with the dissolution rate values in vari- ous aqueous-based pH buffer solutions.
Finally, Section 4 describes the influence of process parameters (capacity of the milling container, size of the milling medium, applied volume of the milling beads, milling speed, milling time) on ABZ polymorphism.
It has already been reported, that mechanical stress and other sources of excess energy such as heat are inherent to milling and often lead to significant changes on the physi- cal and chemical properties of pharmaceutical crystalline solids. Partial or complete transformation to the amor- phous form, polymorphic transformations, and changes in chemical reactivity are among the frequently encountered changes produced by milling [45]. The presence of solvent can have drastic influence on the outcome of the mechan- ical treatment and can greatly affect the nature of the resulting material [46–50]. Crystal defects are practically unavoidable in pharmaceutical processing. Fundamental
Fig. 1 Optimization of quality attributes based on design of experiments
understanding of milling induced disorder will lead to a better process control and more consistent product per- formance [45]. Solid state characterization of raw mate- rial albendazole and albendazole processed in milled suspensions after drying were performed by x-ray pow- der diffraction analysis. The novelty of this is work is the identification of extreme milling conditions, where disad- vantageous ABZ Form I → Form II conversion is realized, giving a hint to formulation scientists to avoid these con- ditions during ABZ nanosuspension development by wet planetary bead milling techniques.
1.1 Theoretical
The Ostwald-Freundlich equation (Eq. (2)) directly describes the relation between the saturation solubility of the drug and the particle size [17, 51]:
log . C , C
V R T r
s α
σ
= × × ρ
× × × × 2
2 303 (2)
where Cs is the saturation solubility, Cα is the solubility of the solid consisting of large particles, σ is the interfacial tension of substance, V is the molar volume of the particle material, R is the gas constant, T is the absolute temperature, ρ is the true density of the solid and r is the radius of the particle.
It describes, that the saturation solubility (Cs) of a drug increases with a decrease in the particle size (r). However, this effect is not substantial for larger particles, but will be pro- nounced for materials that have a mean particle size of less than 1-2 µm, especially well under 200 nm [17].
For volume weighted particle size distributions, such as those measured by laser diffraction, it is often convenient to report parameters based upon the maximum particle size for a given percentage volume of the sample [52]. In this article the volume weighted mean particle size (D[4,3]) has been chosen as one of the dependent variables in 3-factor 3-level central composite design (face centered of alpha 1) over the median particle size d50 and 90 % cumu- lative undersize particle size d90. The volume weighted mean particle size or volume moment mean (De Brouckere Mean Diameter) is relevant for many samples as it reflects the size of those particles which constitute the bulk of the sample volume. It is most sensitive to the presence of large particulates in the size distribution [52, 53]. The equation for defining the volume mean is shown below (Eq. (3)):
D D v
D v
n
i i
n
i i
4 3 1
4
1 3
, .
[ ]
= ××
∑ ∑
(3)The Di value for each screened channel is the geometric mean, the square root of upper multiplied by the lower diam- eters. For the numerator the geometric Di should be taken to the fourth power and multiplied by the percentage in that channel, summed over all channels. For the denominator the geometric Di should be taken to the third power times the percent in that channel, summed over all channels [54, 55].
2 Materials and methods 2.1 Materials
Albendazole EP (micronized), (Sequent Scientific Ltd., India) was utilized as model drug for wet planetary bead milling operations. The influence of various surface-active agents on wet milling have been compared such as Polysorbate 80 (Tween 80) (Molar Chemicals Kft., Hungary), polysorbate 20 (Tween 20) (Molar Chemicals Kft., Hungary), sodium laurylsulphate (Molar Chemicals Kft., Hungary), hypromel- lose (Benecel™ E3 pharm) (Ashland Inc., USA), poloxamer 407 (Lutrol® F127), poloxamer 188 (Lutrol® F68) (BASF, Germany), polyoxyl 35 hydrogenated castor oil (Kolliphor® EL), polyoxyl 40 hydrogenated castor oil (Kolliphor® RH40) (Sigma-Aldrich, USA). Dimethylpolysiloxane (Foamsol) (Kokoferm Kft., Hungary) was applied as antifoaming agent (AF).
2.2 Surfactant assisted planetary bead milling process Determination of the preliminary composition of presus- pension regarding to drug loading (albendazole concentra- tion) and surfactants is one of the utmost importance during nanosuspension formulation development [56]. Then critical process parameter optimization of the wet planetary bead milling process was applied. All equipment and accessories (planetary ball mill, containers, beads and sieves) were pro- vided by (Retsch Technology GmbH., Germany). PM 100 planetary ball mill, with stainless steel containers of 12 ml, 50 ml and 500 ml capacity and zirconium-dioxide beads with sizes of d = 0.1 mm, d = 0.3 mm, d = 1.0 mm were utilized for milling. Stainless steel sieves, with mesh sizes of d = 800 µm, d = 180 µm and d = 63 μm, were applied to separate the beads from the milled suspensions by simply pouring the content of containers onto these sieves, avoiding aggregation by vibration. Milling temperature control was part of every milling experiment and was registered with an analog thermometer (Alla® France Sarl, France), which precision and traceability was certified. At-line control was performed immediately after milling programs have ended, top of the milling container was removed, the analog ther- mometer was inserted directly into the container and maxi- mal milling temperature values were registered.
2.3 Ideal loading composition determination for wet media milling of albendazole
Loading composition optimization evaluations were carried out in the smallest laboratory sized container (12 ml), with batch sizes of 8.00 g, at high milling speed (500 rpm), also with high volume of applied milling beads (4.8 ml), while various milling programs, continu- ous operations were compared to cyclic ones, comprised of equally long milling and cooldown cycles, (5–5 min- utes and 10–10 minutes, on–off) total process time was 60 minutes. For determination of albendazole loadings 1.00 % (w/w), 3.00 % (w/w) and 4.00 % (w/w) were inves- tigated. The influence of the surface-active agents and polymers on wet milling of albendazole were compared in concentrations of 0.40 % (w/w). Best performed emul- sifier concentration was screened between the ranges of 0.30 % (w/w) to 1.00 % (w/w), application of antifoam- ing agent dimethylpolysiloxane at higher concentrations (> 0.50 % (w/w)) was also involved. Results were eval- uated by the following criteria: maximizing submicron sized fraction (%), while minimizing volume-weighted mean particle size D[4,3]) (µm), and Span values (polydis- persity or width of particle size distributions).
2.4 Particle size distribution and zeta-potential analysis Particle size distributions of milled albendazole suspensions have been determined by both Laser Diffractometry (LD) and Dynamic Light Scattering (DLS). Sample preparations involved dispersing 100 µl of milled suspensions dropwise in 100 ml of demineralized water at a mixing speed of 1500 rpm poured into Mastersizer Hydro SM small volume dis- persion unit, which yielded 10 % laser obscurations. Sample absorbances have been measured prior to every particle siz- ing by an 8453-type, single beam UV-Vis spectrophotome- ter, (Agilent Technologies, USA) on wavelength λmax = 633 nm, which is the wavelength of both red He-Ne laser beams, found in instruments Mastersizer 2000 laser diffractometer and Zetasizer nano ZS™, (Malvern Instruments Ltd., UK) two angle particle and molecular size analyzer. Laser dif- fraction measurement were performed based on Mie scat- tering theory. Preset measurement parameters included the refractive index of albendazole 1.634, refractive index of dispersant water 1.333 and true density of albendazole 1.3 g ml. True density of materials is required for specific surface area calculations from size distribution parameters.
General purpose measurement with enhanced sensitivity mode was utilized, which is suitable for sample characteri- zations containing irregular shaped particles. Every sample
was measured five times individually and the mean ± stan- dard deviation values were reported in the results section.
Recorded parameters were submicron sized fractions (%), volume-weighted mean particle sizes (D[4,3] (μm)) and span values. Submicron sized fractions (%) were calculated from the cumulative undersize distribution curves. Each measure- ment took 20 seconds to perform suggested by the Malvern diffraction application v.5.60.10.0 (Malvern Instrument Ltd., UK), to allow slow moving larger aggregates to pass through the detector array.
Final, optimized nanosuspension formula has also been characterized by DLS method as well. For that, 1 ml of dis- persed, diluted nanosuspension (described above) has been withdrawn from the small volume dispersion unit and were poured into a PCS 1115 glass sizing cuvette with square aper- ture (Malvern Instruments Ltd., UK). DLS measurement settings: Automatic, NIBS (Non-Invasive-Backscattering) mode with laser angle 173°, 28–32 sub runs/measurement, run durations: 10 s. Sample chamber was heated to 25.0 °C, and equilibration time was 300 seconds. Automatic laser positioning and attenuation have been predescribed for DTS Application v.7.11.07073 (Malvern Instruments Ltd., UK), also five individual measurements were performed, for every sample and the mean ± standard deviation values were reported for all the DLS parameters, including: inten- sity-weighted mean hydrodynamic diameter (Z AVG d) and Polydispersity Index (PDI) values in this article. In drug delivery applications a PDI value of less, than 0.3 is preferred for homogenous, narrow particle size distributions [57].
Zeta-potential gives certain information about the sur- face charge properties and further the long-term phys- ical stability of the nanosuspensions. In order to obtain an electrostatically stabilized nanosuspension, a min- imum zeta potential of ± 30 mV is required. In case of a combination of electrostatic and steric stabilization, a minimum zeta potential of ± 20 mV is desirable [58–60].
Zeta-potential values were also recorded with Zetasizer nano ZS™ Electrostatic Light Scattering (ELS) method.
Sample preparations involved carefully pouring 750 µl of diluted milled samples into DTS 1070 capillary folded, disposable Zeta cells (Malvern Instruments Ltd., UK) to avoid the formation of bubbles in capillaries, which can mislead measurement results.
Zeta-potential distributions were registered in auto- matic mode from 5 parallels after 300 seconds equilibra- tion time at 25 °C and the mean ± standard deviation val- ues were reported. Dispersant viscosity correction was not necessary, because surfactant concentration and milled
active content of diluted samples was 0.0005 % (w/w) and 0.00365 % (w/w) respectively, which had negligible impact on dispersant viscosity.
2.5 Process parameter optimization of wet-milling by factorial design and desirability approach
Out of all the experimental designs, Central Composite Designs (CCD) have been extensively used to optimiza- tion of manufacturing processes.
In order to characterize the relationship between for- mulation factors and their impact on the output variables response surface methodology based on face centered cen- tral composite design was utilized.
The sizes of zirconia beads, the milling speed and the milling time values can significantly influence the quality performance of nanosuspensions. In this study these were the analyzed formulation variables. Milling experiments were carried out in 500 ml containers, with two different volumes of milling beads (100 ml and 200 ml) as category factors, where batch sizes were 425.5649 g and 476.1498 g respectively. A three-level (+1, 0, -1) factorial design for the optimization of the independent variables with 32–32 runs (5–5 center points) was applied to each cate- gory. Submicron sized fraction (%) (Y1), volume-weighted mean particle size (D[4,3]) (µm) (Y2), span of particle size distributions (Y3), zeta-potential (mV) (Y4) and milling temperature (°C) (Y5) values were selected as responses (dependent variables) (Table 2). Experiments were run in random order to increase the predictability of the qua- dratic models. The following 3-level factorial polynomial equation was fitted to the measurement data (Eq. (4)):
Y b b X b X b X b X X b X X b X X b X b X
n = + + + +
+ + + +
0 1 1 2 2 3 3 12 1 2
13 1 3 23 2 3 11 1
2 22 2
2++b X33 3
2, (4)
where Yn were the dependent variables; b0 was the inter- cept, the arithmetic mean of all quantified outcomes of 32 runs; b1, b2, b3 were the individual polynomial coeffi- cients describing the influence of each parameter on the outcome; b12, b13, b23 were the coefficients of the interac- tion functions; b11, b22, b33 were the coefficients of the qua- dratic functions; X1, X2, X3 values were the independent variables, where X1 represented the milling time (20, 40 and 60 minutes long programs were screened), X2 repre- sented the milling speed (effect of 200, 400 and 600 rpm on wet milling were investigated) and X3 represented the sizes of milling beads (effect of d = 0.1, d = 0.3 and d = 1.0 mm sized zirconia beads on wet milling were compared).
The optimization and statistical experiments were designed and evaluated using the Design-Expert® software
version 7.0.0 (Stat-Ease® Inc., USA). A quadratic polyno- mial 3-level factorial response surface design type has been predescribed, with no blocks.
Numerical optimization preset evaluation conditions included: maximizing submicron sized fraction, with tar- get set to 100 % , with importance set to the maximal 5 (+), minimizing volume-weighted mean particle size, where upper target was D[4,3]) (µm) < 0.600 µm, importance 5 (+) maximal, minimizing span (width of particle size distributions), importance 3 (+), minimizing zeta-poten- tial (mV), where upper target was < -30 mV, importance 5 (+) maximal and also minimizing milling temperature (°C) values, with upper target of < 40 °C, importance 5 (+) maximal. For end-product process parameter selection economical purposes were also taken into consideration, such as maximizing loading and yield, while minimizing energy consumption (milling speed and process time) with importance set to 3 (+) (Table 3).
2.6 Thermodynamic solubility studies
Thermodynamic solubility studies were determined using a slightly modified version of the classical saturation shake- flask method in dissolution media at pH = 1.2 (0.1 N hydro- chloric acid), pH = 4.5 (phosphate-buffer) and pH = 6.8 (phosphate-buffer). Albendazole powder (10 mg), milled and unmilled surfactant dispersions containing 10 mg of alben- dazole were poured into 10 ml volumetric vials, an addi- tional 5 ml of dissolution media were added to the samples.
Vials were sealed and the contents of the vials were mixed at speed 800 rpm and heated to 37 °C with heat- able magnetic stirrer MS-H-S10 (DLAB Instruments Ltd., China) and magnetic stirrer bars for 24 hours, then sed- imentation was utilized for another 24 hours on 37 °C as well. It has already been reported by Baka et al. [61], that the safest way for phase separation is sedimentation, although diluted milled samples formed stable colloidal systems, where sedimentation was not enough for phase separation [61]. Thus, aliquots were taken and centri- fuged at 14000 rpm for 15 min using a MicroGen 16-type (Herolab GmbH, Germany) centrifuge. To avoid dissolved ABZ absorption of syringe mounted membrane filters and to increase precision and reproducibility, membrane filter- ing has been ignored, only centrifugation had been utilized for phase separation [62]. Complete phase separation has been confirmed by transmittance analysis and Dynamic Light Scattering particle sizing methods. Three clean supernatants were taken and measured. The mean thermo- dynamic solubility values (µg/ml) ± SDs were calculated from the linear calibrations in each dissolution medium
and were determined by spectrophotometry on the absorp- tion maximum of albendazole at wavelength λmax = 291 nm, measured by an 8453-type UV-Vis spectrophotometer (Agilent Technologies, USA).
2.7 Iv-vitro dissolution study of nanosuspensions and surfactant dispersions
Dissolution tests were performed using Hanson SR - 8 Plus™ Dissolution Test Station (Teledyne Hanson Research Inc., USA) by USP apparatus 2 (paddles) meth- ods at 75 rpm rotation speeds and 37 ± 0.2 °C bath tem- peratures. For sampling Autoplus Maximizer and Autoplus MultiFill, (Teledyne Hanson Research Inc., USA) were uti- lized. Dissolution kinetics of optimized nanosuspensions, unmilled surfactant dispersions and raw albendazole pow- ders were investigated in 900 ml aqueous-based buffer solu- tions at pH = 1.2 (Ph. Eur. 9) (in doses of 200 mg), pH = 4.5 phosphate buffer solution (Ph. Eur. 9) (in doses of 100 mg) and pH = 6.8 phosphate buffer solution (Ph. Eur. 9) (in doses of 100 mg). At predetermined time-points 5 ml samples were withdrawn from the vessels and filtered through P/N FIL10S-HR 10 µm pore sized full flow membrane fil- ters (Quality Lab Accessories L.L.C., USA) placed on the e-probes. Samples were collected in offline mode to 16 x 100–type test tube holder rack. After every sampling, media replacement was accomplished by 5 ml of fresh buffer solu- tions. Collected samples were filtered through 0.1 µm pore sized polyether sulfonate (PES) syringe membrane filters (Nantong FilterBio Membrane Co. Ltd., China) prior to mea- surements, in order to remove undissolved particles.
Dissolution studies were performed in triplicates and the cumulative drug release (%) mean values ± SDs were
calculated from the linear calibrations in the defined dis- solution media, determined by UV-Vis spectrophotometry on the absorption maximum of albendazole at wavelength λ max = 291 nm, measured by an 8453-type UV-Vis spec- trophotometer (Agilent Technologies, USA). Kinetic eval- uations were performed by smoothening fitting with Excel 2016, (Microsoft Corp., USA) solver plug-in (minimizing differences between measured and calculated values), fol- lowed by Weibull-model fitting.
2.8 Maximizing albendazole yield after optimized milling process
Economic considerations necessitate the maximization of yield for cost effective manufacturing. In order to do so, several washing experiments have been performed and compared by an additional 16.66 % (w/w) of suspension loading of surfactant solution added to separated beads in milling container with 500 ml capacity, surfactant solu- tion consisted of 0.5 % (w/w) Tween 80 and 0.01 % (v/v) of antifoaming agent dimethylpolysiloxane. The operation was repeated by the addition of twice 16.66 % (w/w) con- tainer mass loading, followed by 33.33 % (w/w), then twice of 33.33 % (w/w). An additional milling cycle was applied after every surfactant solution addition to separated beads on 300 rpm milling speed for 5 minutes followed by another separation on stainless steel sieve with mesh size of d = 63 μm. Collected and diluted nanosuspensions were mixed with milled ones on heatable magnetic stirrer MS-H-S10 (DLAB Instruments Ltd., China) at a stirring speed of 600 rpm, with a homogenization time of 5 minutes. Drug load- ing, particle sizing and zeta-potential determinations were performed after each washing experiment in order to study
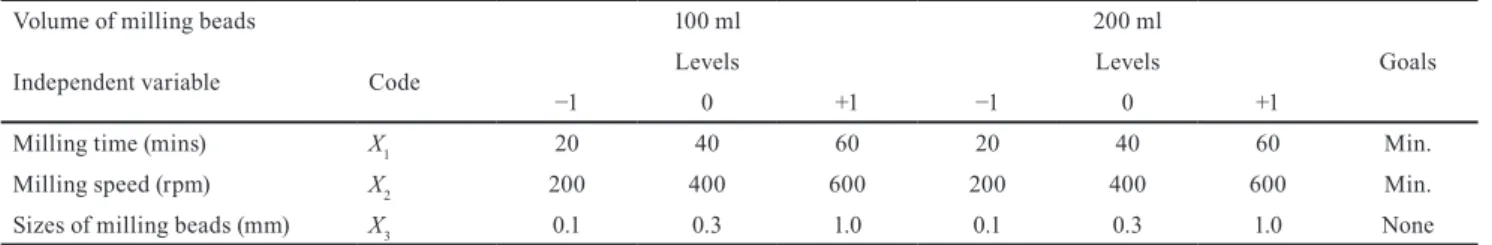
Table 2 Independent variables with levels and goals for the construction of DOE
Volume of milling beads 100 ml 200 ml
Goals
Independent variable Code Levels Levels
−1 0 +1 −1 0 +1
Milling time (mins) X1 20 40 60 20 40 60 Min.
Milling speed (rpm) X2 200 400 600 200 400 600 Min.
Sizes of milling beads (mm) X3 0.1 0.3 1.0 0.1 0.3 1.0 None
Table 3 Preset nanosuspension criteria for the evaluation of dependent variables with numerical optimization of desirability function
Volume of milling beads 100 ml 200 ml
Dependent variable Code Target Goals Target Goals
Submicron sized fraction (%) Y1 Y1 = 100 Max. Y1 = 100 Max.
D [4,3] (µm) Y2 Y2 < 0.600 Min. Y2 < 0.600 Min.
Span Y3 None Min. None Min.
Zeta-potential (mV) Y4 Y4 < -30 Min. Y4 < -30 Min.
Milling temperature (°C) Y5 Y5 < 40 Min. Y5 < 40 Min.
the effect of dilution on dosage, particle size distribution parameters and physical stability.
2.9 Drug content determination of milled ABZ suspensions
Albendazole has pH dependent poor water solubility, with a maximum at pH = 1.2 (see Subsection 3.4) as a weak alkaline compound, it was evident to determine the amount of active content in highly diluted stock solutions at pH = 1.2 (Ph. Eur. 9). Three stock solutions have been prepared by adding 0.25 ml of milled ABZ suspensions to 0.1 N hydrochloric acid in 250 ml volumetric flasks.
Final volumes were completed to 250 ml (1000 times dilu- tion) mixed on heatable magnetic stirrer MS - H-S10 (DLAB Instruments Ltd., China) at stirring speed 1000 rpm, with a homogenization time of 60 minutes. Stock solutions were transparent, and no floating, undissolved particles were reg- istered. Mean administration volume values (ml) ± SDs of nanosuspensions containing 200.0 mg were calculated from the linear calibration of ABZ by UV-Vis spectrophotometry on the absorption maximum of albendazole at wavelength λmax = 291 nm, measured by an 8453-type UV-Vis spectro- photometer (Agilent Technologies, USA).
2.10 Short-term physical stability evaluations of optimized, milled ABZ nanosuspension
Short-term physical stability evaluation of the optimized formula was tracked by registering particle size distri- bution parameters and zeta-potential values at predeter- mined storage intervals: 1, 2, 3, 24, 48, 72, 168, 336, 672, 1344 hours at 25 °C 60 % (RH) and at 4 °C 60 % (RH) storage conditions. Samples were stored in 25 ml volumet- ric brown vials, protected from direct sunlight. Each sam- ple was shaken manually for ten seconds prior to inves- tigations. For particle size distribution and zeta-potential measurement settings, see Subsection 2.4.
2.11 Powder X-ray Diffractometry (PXRD), diffraction pattern comparison of solids
Diffraction patterns were measured on PANalytical X’Pert3 Powder diffractometer (Malvern Panalytical B.V., The Netherlands) using Cu Kα radiation with 45 kV accel- erating voltage and 40 mA anode current over the range of 5–40 (2 θ) with 0.0084 step size and 99.695 s times per step in reflection mode, spinning the sample holder by 1 s−1 rota- tion speed. Incident beam optics consisted of a programma- ble divergence slit with 15 mm constant irradiated length and an anti - scatter slit at fixed 2. Diffracted beam optics
consisted of X'Celerator Scientific ultra-fast line detector with 0.02 soller slit and programmable anti-scatter slit with 15 mm constant observed length. Single crystalline silicon zero-background diffraction plates were utilized in case of diffraction pattern comparisons of raw material ABZ powder, albendazole processed in milled and in unmilled suspension forms after drying. Sample preparations involved pouring the milled and unmilled ABZ suspen- sions into Petri dishes and dried slowly in AccuDry® dry- ing chamber (Dynatech Scientific Labs, USA) on 40.0 °C, for 2 days under air atmosphere and pressure. Dried pow- ders were gently removed from dishes and sieved through a 30 µm mesh size stainless steel sieve (Retsch Technology GmbH., Germany) before analysis. Data were collected by PANalytical Data Collector Application, version 5.5.0.505 (Malvern Panalytical B.V., The Netherlands).
3 Results and discussion
3.1 Ideal loading composition determination for wet planetary bead milling of albendazole
Milling trial comparisons with d = 1.0 mm sized beads, sur- factant concentrations of 0.40 % (w/w) Tween 80 and drug loadings of 3.00 % (w/w) albendazole revealed, that zirco- nium-dioxide beads seemed to be the ideal choice, accord- ing to predetermined criteria (see end of Subsection 2.3).
There was no difference in milling temperature values;
it was 29 °C after each milling experiment.
To increase performance by increasing total contact points between surfaces, we switched to d = 0.3 mm sized zirconia beads for further investigations. As expected, milling temperature values have massively increased on 500 rpm milling speed, with continuous operations.
To offset this phenomenon, various cyclic operations have been introduced and compared, in order to keep the mill- ing temperature as low as possible. We have registered the heating and cooldown rates of loadings and found out, that based on the utilized milling speed, milling time and con- tainer size, it took 30-80 minutes to cooldown to room tem- perature at 200 ml of applied beads. The slow cooldown rates were compensated by limited milling time, rotation speed to obtain ABZ nanosuspensions. We have compared shorter and longer programs, with equally long cooldown cycles (5:5 (mins), 10:10 (mins) on: off) and continuous operations. After 60 minutes of milling sessions, the mill- ing temperature values were 31.0 °C, 38.0 °C and 60.0 °C respectively. Both milling temperature values and particle size distribution evaluation results favored the selection of 5:5 (mins) (on: off) milling program. Fig. 2 shows the
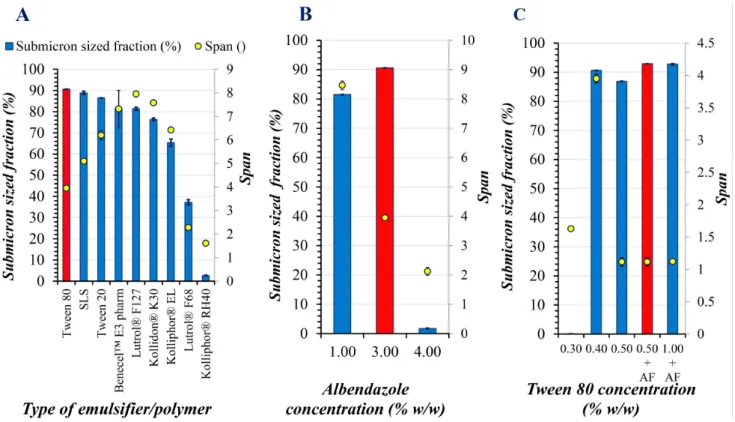
results of loading composition optimization for wet plane- tary bead milling of ABZ.
During a milling process, selection of stabilizer(s) is the crucial step for successful accelerated breakdown of raw materials (Rehbinder effect) [63, 64] and stabilization of newly formed nanocrystals, reported as the first step in the Quality by Design concept of nanosuspension devel- opment [56]. In order to compare surface-active agents, that were the most ideal for wet planetary bead milling of ABZ, two non-ionic (Tween 20 and 80), one anionic (SLS) emulsifiers, four triblock copolymers (poloxamer 407 and 188, macrogolglicerol-hidroxystearate, macro- golglicerol-ricinoleate) and two water soluble polymers (PVP K30, HPMC) with low molecular weight values in concentrations of 0.40 % (w/w) have been tested. All types of surfactants, along with water soluble polymers polox- amer 407, PVP K30 and HPMC showed promising results.
Best performed emulsifier however was Tween 80 con- sidering all registered parameters. It seemed emulsifier/
polymer type had no impact on milling temperature val- ues, 31.0 °C was measured in all cases. Ideal surface-active agent (Tween 80) concentration was also screened between the concentration rage of 0.30 % (w/w) to 1.00 % (w/w) with and without antifoaming agent dimethylpolysiloxane
in 0.01 % (v/v) at above 0.50 % (w/w) emulsifier, suggested by the user's manual of Foamsol.
Above 0.40 % (w/w) Tween 80 submicron sized frac- tions were about 90 %, highest value (92.89 %) regis- tered at 0.50 % (w/w) Tween 80 + 0.01 % (v/v) dimeth- ylpolysiloxane solutions, increasing amount of Tween 80 had a positive impact on polydispersity (span) values.
Application of antifoaming agent in this concentration slightly increased submicron sized fraction from 86.84 % to 92.89 % and had no impact on polydispersity, although significantly improved milled suspension average yield from 50.12 % (w/w) to 60.53 % (w/w) after the separation from beads. Ideal drug loading investigations involved the screening of 1.00 %, 3.00 % and 4.00 % (w/w) ABZ at predetermined best performed conditions. Best-case sce- nario was the application of 3.00 % (w/w), which yielded maximal submicron sized fraction, with minimal polydis- persity values. Milling temperature values were slightly different this time, 28.0 °C, 31.0 °C and 40 °C respectively.
3.2 Effects of milling process parameters
There are numerous interfering critical process parame- ters responsible for optimal end- product quality e.g. the type of the milling instrument, composition of the milling
Fig. 2 Loading composition optimization for wet planetary bead milling of ABZ, A: Influence of the quality of surface-active agents and polymers, B: Influence of ABZ loading C: Influence of the quantity of Tween 80 on particle size distribution parameters measured by laser diffraction n = 5, mean values ± SDs, where columns represent submicron sized fractions, o symbols: Span values; red color the selected composition and AF means
antifoaming agent added to composition
medium and the inner wall of the milling container, mill- ing speed, milling time, balls/beads to powder mass ratio, volume of the loading, milling atmosphere, milling tem- perature etc. [65]. The process parameters during labora- tory scale planetary bead milling process were optimized for the development of albendazole containing nanosus- pension using 3–factor 3–level central composite design (face centered of alpha 1) as the response surface method- ology. A stepwise regression was used to build quadratic equations for each response variables. For a design space containing 3 factors with 3 levels (33=27 trials), this soft- ware suggested alpha to be set to 1 and the utilization of 5 center points in the face centered design. For depen- dent data analysis transformations were not utilized, the software suggested the highest ordered polynomial fitting selections, where additional terms were significant and the models were not aliased, results of lack-of-fit tests were insignificant, as well as adjusted R–squared and predicted R–squared values were maximized [66].
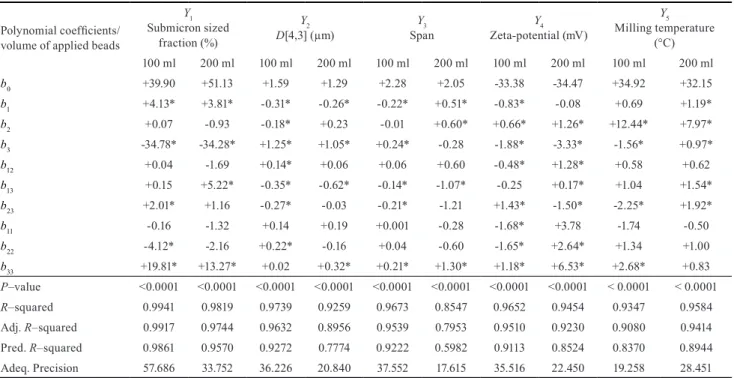
The response (dependent) variables listed in Table 4 are fitted to a third-order polynomial model and, the regres- sion coefficients for each term in the regression model are summarized also in Table 4 along with R–squared and precision values of regressions.
Every design point was well fitted to the polynoms, demon- strated by the significance of fitted models (p-value < 0.05), high (> 0.85) coefficient of determination values and high (> 10) signal to noise ratios indicated that, the milling
experiment have been performed precisely and results were reproducible. Statistical significance (p-value < 0.05) of the observed parameter was indicated by * symbol.
Subsections 3.2.1–3.2.5 summarize the results of the in depth analysis of process parameters on dependent variables.
3.2.1 Submicron sized fraction (Y1)
Maximizing this parameter is desirable for formulation development of nanosuspensions, therefore any factor increasing its value considered as positive impact. At 100 ml applied beads, the main positive effect was the qua- dratic function of the increasing sizes of milling beads (b33), which was offset by the negative effect of the increa- sing sizes of beads (b3). At 200 ml applied beads, this phen- omenon was more dominant.
3.2.2 Volume-weighted mean particle size (Y2)
Minimizing this parameter is desirable for formulation development of nanosuspensions, therefore any factor decreasing its value considered as positive impact. At 100 ml applied beads, the main driving effects of particle diminu- tion were the interaction functions of the milling time and sizes of milling beads (b13) and also the milling speed and sizes of beads (b23), along with the increasing milling time (b1), which was offset by the most dominant negative effect of the increasing sizes of milling beads and the minor neg- ative effect of the quadratic function of milling speed (b22).
At 200 ml applied beads, the positive effects were the
Table 4 Polynomial model coefficients and statistical results of analysis based on the 3-factor 3-level face centered composite design (alpha 1) (statistical significance of the observed parameter indicated by * symbol, where p-value < 0.05))
Polynomial coefficients/
volume of applied beads
Y1 Submicron sized
fraction (%)
Y2
D[4,3] (µm) Y3
Span Y4
Zeta-potential (mV)
Y5 Milling temperature
(°C)
100 ml 200 ml 100 ml 200 ml 100 ml 200 ml 100 ml 200 ml 100 ml 200 ml
b0 +39.90 +51.13 +1.59 +1.29 +2.28 +2.05 -33.38 -34.47 +34.92 +32.15
b1 +4.13* +3.81* -0.31* -0.26* -0.22* +0.51* -0.83* -0.08 +0.69 +1.19*
b2 +0.07 -0.93 -0.18* +0.23 -0.01 +0.60* +0.66* +1.26* +12.44* +7.97*
b3 -34.78* -34.28* +1.25* +1.05* +0.24* -0.28 -1.88* -3.33* -1.56* +0.97*
b12 +0.04 -1.69 +0.14* +0.06 +0.06 +0.60 -0.48* +1.28* +0.58 +0.62
b13 +0.15 +5.22* -0.35* -0.62* -0.14* -1.07* -0.25 +0.17* +1.04 +1.54*
b23 +2.01* +1.16 -0.27* -0.03 -0.21* -1.21 +1.43* -1.50* -2.25* +1.92*
b11 -0.16 -1.32 +0.14 +0.19 +0.001 -0.28 -1.68* +3.78 -1.74 -0.50
b22 -4.12* -2.16 +0.22* -0.16 +0.04 -0.60 -1.65* +2.64* +1.34 +1.00
b33 +19.81* +13.27* +0.02 +0.32* +0.21* +1.30* +1.18* +6.53* +2.68* +0.83
P–value <0.0001 <0.0001 <0.0001 <0.0001 <0.0001 <0.0001 <0.0001 <0.0001 < 0.0001 < 0.0001 R–squared 0.9941 0.9819 0.9739 0.9259 0.9673 0.8547 0.9652 0.9454 0.9347 0.9584
Adj. R–squared 0.9917 0.9744 0.9632 0.8956 0.9539 0.7953 0.9510 0.9230 0.9080 0.9414
Pred. R–squared 0.9861 0.9570 0.9272 0.7774 0.9222 0.5982 0.9113 0.8524 0.8370 0.8944
Adeq. Precision 57.686 33.752 36.226 20.840 37.552 17.615 35.516 22.450 19.258 28.451
increasing milling time (b1) and the interaction function of milling time and sizes of milling beads (b13), which was offset by the negative effects of increasing sizes of mill- ing beads (b3) and the quadratic function of the size of milling beads (b33).
3.2.3 Span (polydispersity) values of particle size distributions (PSDs) (Y3)
Minimizing this parameter is desirable for formula- tion development of nanosuspensions, therefore any fac- tor decreasing its value considered as positive impact.
At 100 ml applied beads, the main driving effects of reach- ing homogeneous PSDs were the increasing milling time (b1) and the interaction functions of milling time and sizes of beads (b13) along with the milling speed and sizes of beads (b23), which was nearly compensated by the total negative effect of the increasing sizes of milling beads (b3) and the quadratic function of the increasing sizes of mill- ing beads (b33). At 200 ml applied beads, the positive effect was the interaction function of the milling time and sizes of milling beads (b13), which was outweighed by the total negative effects of milling time (b1) milling speed (b2) and the quadratic function of the sizes of milling beads (b33).
3.2.4 Zeta-potential values (Y4) of milled ABZ suspensions
Minimizing this parameter is desirable for formula- tion development of nanosuspensions, therefore any fac- tor decreasing its value considered as positive impact.
At 100 ml applied beads, the main positive effects were the increasing milling time (b1), increasing size of mill- ing beads (b3), the interaction function of milling time and milling speed (b12) and the quadratic functions of the milling time (b11) along with the milling speed (b22).
These effects were not compensated by the negative effects of the increasing milling time (b2), the interaction func- tion of the milling speed and sizes of milling beads (b23) and the quadratic effect of the sizes of milling beads (b33).
At 200 ml applied beads, positive effects of the increasing sizes of milling beads (b3) and the interaction function of the milling speed and sizes of milling beads (b23), were off- set by the total negative effects of the increasing milling speed (b2), the interaction functions of the milling time and milling speed (b12) along with the milling time and sizes of milling beads (b13) and also the quadratic functions of the milling speed (b22) and sizes of milling beads (b33).
3.2.5 Milling temperature values (Y5)
Minimizing this parameter is desirable for formula- tion development of nanosuspensions, therefore any fac- tor decreasing its value considered as positive impact.
At 100 ml applied beads, the main positive effects were the increasing sizes of milling beads (b3) and the interaction function of the milling speed and size of milling beads (b23), which was overcompensated by the total negative effects of the increasing milling speed (b2) and the quadratic func- tion of the sizes of milling beads (b33). At 200 ml applied beads, only negative effects were observed, the major one was the increasing milling speed (b2).
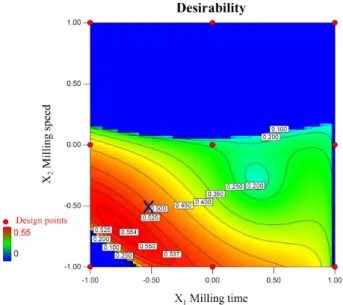
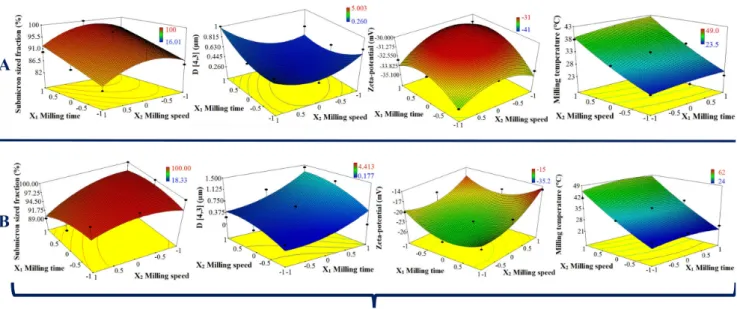
When influence of zirconia beads with different sizes were compared on milled ABZ particle size distribution parameters and suspension zeta-potential values at 100 ml of applied zirconia beads, result showed improving per- formance on size reduction with the utilization of smaller beads, consequently showed inverse proportionality with the size of milling medium. Nanosuspension criteria (see end of Subsection 2.5) were easily fulfilled with the application of d = 0.1 mm sized beads at low to medio- cre milling speed intervals (200–434 rpm), with a wide range in process time (20–59.4 mins), however coarse pro- grams at higher rotation speeds (500 - 600 rpm) seemed to deteriorate results (Fig. 3). For explanation we should look at the 3-Dimensional response surface plots (Fig. 4).
Low energy bead milling with 100 ml of applied amount of d = 0.1 mm sized zirconia beads was effective below
Fig. 3 Contour plot of the nanosuspension criteria by numerical optimization of desirability function, where x marks the chosen process
parameters: 300 rpm rotation speed, 30 minutes long operation, with 100 ml of X3: d = 0.1 mm sized zirconia milling beads applied
400 rpm, at this rotation speed value submicron sized fraction was maximal (100 %) and volume weighted mean particle size (D[4,3]) was minimal (0.192 µm), due to max- imal specific surface area of ABZ nanocrystals, this is also the point, where mean zeta-potential value was maximal (−30.5 mV). Above 400 rpm rotation speed, aggregation due to increased thermal motion at higher milling tem- perature values (36.0–39.0 °C), can be observed, probably due to growing bead-bead collisions.
Milling trials with d = 0.3 mm and d = 1.0 mm sized beads showed less promising results compared to d = 0.1 mm beads, even tendencies were different, unlike d = 0.1 mm sized beads, prolonged, coarse operations yielded the best results considering volume-weighted mean particle sizes 1.600 µm for d = 0.3 mm and 2.200 µm for d = 1.0 mm sized beads. Thus, prolonged operations are advisable for the development of ABZ nanosuspension by low energy wet bead milling method with the utilization of larger zirconia beads (d = 0.3 mm, d = 1.0 mm) at higher milling speed values. In contrast application of smaller zirconia beads (d = 0.1 mm) are favored at lower to mediocre milling speeds, which yielded ABZ nanosuspension in a shorter process.
Utilization of 200 ml applied volume of milling beads the same aggregation tendency can be registered at higher mechanical energy input for d = 0.1 mm (Fig. 4) and even for d = 0.3 beads, resulted in a significant milling tem- perature escalation from previously measured 39.0 °C to 49.9 °C for d = 0.1 mm and 44.5 °C for d = 0.3 mm
sized beads with higher zeta-potential values > −26 mV for d = 0.1 mm and > −33 mV for d = 0.3 mm observed compared to the mean zeta-potential value (< −30.5 mV) at lower amount of beads applied previously. Preset nanosus- pension criteria (see Subsection 2.5) excluded the appli- cation of higher amount of zirconia beads, due to higher zeta-potential values of milled ABZ suspensions.
Summarizing optimization results, we can report, that ideal loading consisted of 0.64 % (w/w) ABZ, 20.60 % (w/w) surfactant solution, containing 0.50 % (w/w) Tween 80 mixed with 0.01 % (v/v) dimethylpolysiloxane as antifoaming agent, 78.76 % (w/w) d = 0.1 mm sized zir- conia beads of the total mass loading at a batch size of 476.1498 g, loaded in stainless steel container capacity of 500 ml. As for ideal chosen settings, milling speed was 300 rpm with 30 minutes long 5:5 cyclic, milling oper- ation. Milling temperature at the end of the process was 26.0 °C, showed a minimal + 8.0 °C elevation compared to the temperature of starting surfactant solution.
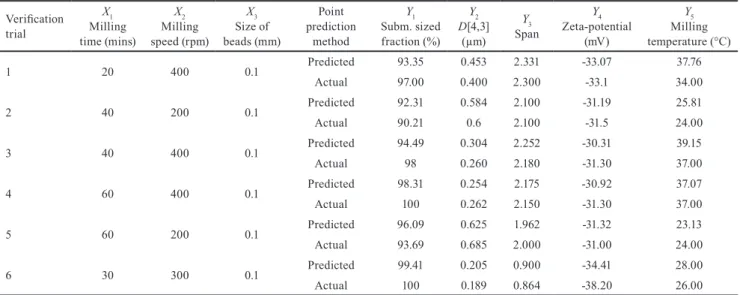
The validation of responses predicted by the design model shall be performed in the final step. This is done by conducting confirmatory trials using RSM (response sur- face methodology) and the results are critically evaluated.
Based on the trial results the optimal process parameters are set for manufacturing of the product [35, 67]. Validation trials were performed selecting the borderline points of the highlighted region of the contour plot (Fig. 3) including the point, which contributed to the optimized formulation
Fig. 4 Demonstration of the effect of milling time, milling speed on particle size distribution parameters and zeta-potential values of milled ABZ suspensions by 3-Dimensional response surface plots at A: 100 ml and B: 200 ml of milling beads applied, n = 5, mean values ± SDs,
where X3: d = 0.1 mm sized zirconia beads
parameters. Maximal relative standard deviation was cal- culated at verification trial No. 3., between actual and pre- dicted mean span values (11.03 %), other noticeable differ- ences were registered at verification trial No. 1., between actual and predicted mean milling temperature values (7.41 %), at verification trial No. 5., between actual and predicted mean size values (6.48 %) and at verification trial No. 6., between actual and predicted mean zeta-po- tential values (7.38 %) (Table 5). The fitted model demon- strated good predictions in overall and could be used for critical process parameter optimization.
3.3 Comparison of the particle size distribution parameters of raw material ABZ powder and optimized ABZ nanosuspension
Laser diffraction measurements have been performed to val- idate the mean particle size provided by the supplier (> 90
% less, than 30 µm) of raw material albendazole powder after dispersing 3.00 % (w/w) ABZ to 0.5 % (w/w) Tween 80 and 0.01 % (v/v) dimethylpolysiloxane aqueous-based surfactant solution at a mixing speed of 600 rpm, homog- enization time 5 minutes on heatable magnetic stirrer MS-H-S10 (DLAB Instruments Ltd., China) at room tem- perature. Results demonstrated, that the < 30 µm sized frac- tion was 88.82 ± 0.561 % and volume-weighted mean size D [4,3] of 28.787 ± 3.0520 µm. Optimized, milled ABZ nano- suspension formulation yielded ~ 145.39 times reduction in mean size, ~ 14.93 times in mean polydispersity (span value) (Fig. 5), ~ 18.47 times improvement in specific surface area,
~ 9.55 times boost in submicron sized fraction compared to unmilled ABZ surfactant dispersion. Freshly prepared end-product was also characterized by DLS and ELS met- hods as well, confirming the completion of predetermined
nanosuspension criteria, with intensity-weighted mean size (Z AVG d) of 173.5 ± 0.97 nm, polydispersity index (PDI) of 0.175± 0.0120 and zeta-potential of −38.2 ± 0.83 mV.
3.4 Comparison of the thermodynamic solubility values of starting material ABZ powder, Tween 80 dispersion and optimized, milled nanosuspension
We have confirmed previous observations of Torrado et al. [5], that ABZ has pH dependent, poor water solubility, low- est value registered in medium at pH = 6.80, which was 7.3675 ± 0.62803 µg/ ml, solubilization with 0.50 % (w/w) Tween 80 solution enhanced ABZ initial solubility to 25.5165 ± 0.26791 µg/ ml and gained a 2.46 - folds boost.
Optimized, milled nanosuspension formula further improved performance and showed 62.5144 ± 0.04845 µg/ml solubility, raised it 1.45-folds compared to unmilled surfac- tant dispersion. In medium at pH = 4.50 the impact of mean solubility gains were slowly diminishing, initial solubility of raw ABZ powder 11.4917 ± 0.15958 µg/ ml was increased to 57.9846 ± 2.71380 µg/ml, which was a 4.05-folds boost due to solubilization and optimized milling operation demon- strated 65.9163 ± 0.05412 µg/ ml value, showed a 13.68 % boost compared to unmilled dispersion. Least gains in solu- bility were noticeable in medium at pH = 1.20, where initial solubility of ABZ was maximal 863.3964 ± 3.72777 µg/ ml, which was elevated to 1010.5110 ± 2.66921 µg/ ml, boosted by 17.04 % due to solubilization and particle size reduction raised it further to 1269.7990 ± 2.42509 µg/ ml, and gained a 25.66 % boost compared to unmilled dispersion (Fig. 5).
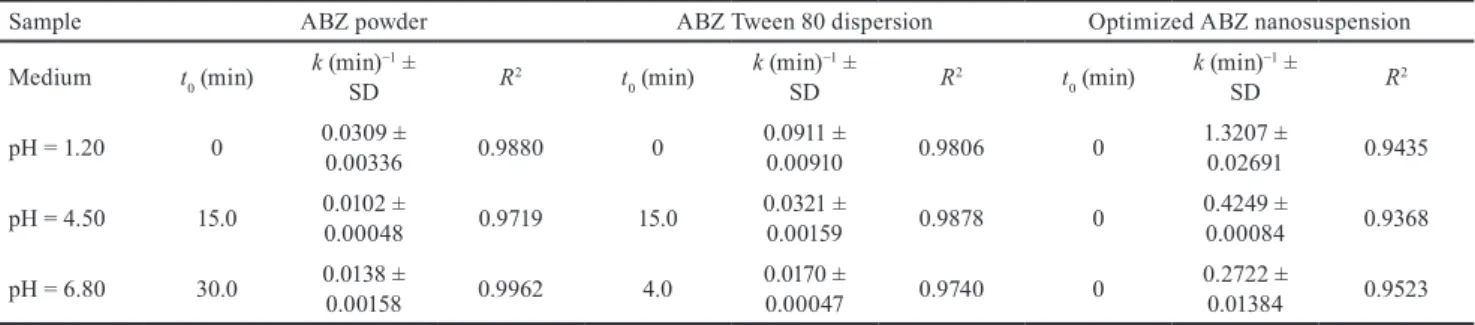
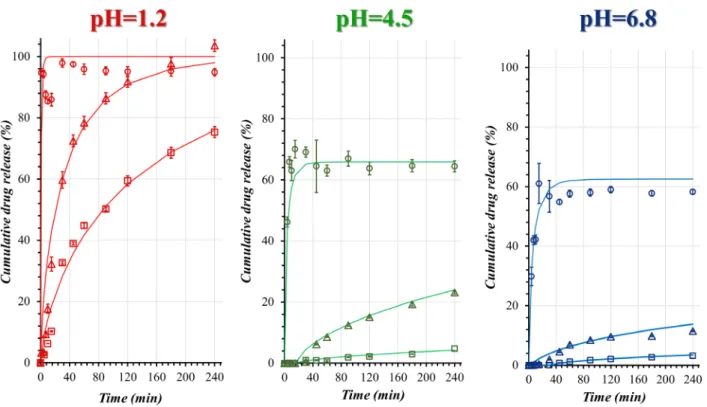
3.5 Comparison of the in-vitro dissolution profiles Dissolution rate constants have been calculated con- sidering thermodynamic solubility values measured in
Table 5 Verification of the desirability optimization with milling process parameters and responses (mean values) Verification
trial
X1 Milling time (mins)
X2 Milling speed (rpm)
X3 Size of beads (mm)
Point prediction
method
Y1 Subm. sized fraction (%)
Y2 D[4,3]
(µm) Y3 Span
Y4 Zeta-potential
(mV)
Y5 Milling temperature (°C)
1 20 400 0.1 Predicted 93.35 0.453 2.331 -33.07 37.76
Actual 97.00 0.400 2.300 -33.1 34.00
2 40 200 0.1 Predicted 92.31 0.584 2.100 -31.19 25.81
Actual 90.21 0.6 2.100 -31.5 24.00
3 40 400 0.1 Predicted 94.49 0.304 2.252 -30.31 39.15
Actual 98 0.260 2.180 -31.30 37.00
4 60 400 0.1 Predicted 98.31 0.254 2.175 -30.92 37.07
Actual 100 0.262 2.150 -31.30 37.00
5 60 200 0.1 Predicted 96.09 0.625 1.962 -31.32 23.13
Actual 93.69 0.685 2.000 -31.00 24.00
6 30 300 0.1 Predicted 99.41 0.205 0.900 -34.41 28.00
Actual 100 0.189 0.864 -38.20 26.00