Accepted: 2015.12.07 Published: 2016.08.04
2715 5 — 46
Human Fetuin-A Rs4918 Polymorphism and its Association with Obesity in Healthy Persons and in Patients with Myocardial Infarction in Two Hungarian Cohorts
BE 1 György Temesszentandrási
EF 2 Krisztián Vörös
EF 2 Bernadett Márkus
B 1 Zoltán Böröcz
B 3 Edit Kaszás
CD 1,4 Zoltán Prohászka
CD 5 András Falus
ADE 3,6 Károly Cseh
ACDEFG 2 László Kalabay
Corresponding Author: László Kalabay, e-mail: kalabay.laszlo@med.semmelweis-univ.hu
Source of support: This work was supported by a grant from the Hungarian Ministry of Health ETT 368/2009
Background: Human fetuin A (AHSG) has been associated with the development of obesity, insulin resistance, type 2 dia- betes mellitus, and atherosclerosis. Observations on the role of AHSG rs4918 single-nucleotide polymorphism are contradictory. We investigated the association between variants of rs4918 and parameters of obesity, lip- id status, tumor necrosis factor-a (TNFa), adipokines (adiponectin, resistin, leptin), and insulin resistance in healthy persons and in patients with previous myocardial infarction.
Material/Methods: This was a cross-sectional study comprising cohort 1 (81 healthy individuals) and cohort 2 (157 patients with pre- vious myocardial infarction). We used the allele-specific KASP genotyping assay to detect rs4918 polymorphism.
Results: In cohort 1, G-nucleotide carriers had significantly lower serum TNFa, adiponectin, and higher leptin concentra- tions than in non-G carriers. These differences, however, were not observed in cohort 2. In cohort 2, G-carriers had lower BMI and waist circumferences than in non-G carriers. The G allele was more frequent among lean than obese patients (RR=1.067, 95%CI=1.053–2.651, p=0.015). An association between BMI and rs4918 poly- morphism was observed among patients without diabetes (CC/CG/GG genotypes: p=0.003, G vs. non-G allele:
p=0.008) but not in diabetics. In addition, a strong linearity between BMI and the CC/CG/GG genotypes (asso- ciation value: 4.416, p=0.036) and the frequency of the G allele (7.420, p=0.006) could be identified. In cohort 2, non-obese, non-diabetic G-carriers still had lower BMI and waist circumferences than in non-G carriers.
Conclusions: The rs4918 minor variant is associated with lower TNFa and adiponectin, higher leptin levels in healthy per- sons, and more favorable anthropomorphic parameters of obesity in cohort 2.
MeSH Keywords: alpha-2-HS-Glycoprotein • Diabetes Mellitus • Myocardial Infarction • Obesity • Polymorphism, Single Nucleotide
Full-text PDF: http://www.medscimonit.com/abstract/index/idArt/896232
Authors’ Contribution:
Study Design A Data Collection B Statistical Analysis C Data Interpretation D Manuscript Preparation E Literature Search F Funds Collection G
1 3rd Department of Internal Medicine, Semmelweis University, Budapest, Hungary 2 Department of Family Medicine, Semmelweis University, Budapest, Hungary 3 Department of Internal Medicine, Károlyi Sándor Municipal Hospital, Budapest,
Hungary
4 Atherosclerosis Research Group of Hungarian Academy of Sciences, Budapest, Hungary
5 Department of Genetics and Immunology, and Cell Sciences, Semmelweis University, Budapest, Hungary
6 Department of Public Health, Semmelweis University, Budapest, Hungary
Background
Alpha2HS-glycoprotein/human fetuin A (AHSG) is a multi- functional glycoprotein secreted by liver parenchymal cells in adults [1]. The molecule is a negative acute phase reactant [2]
and inhibits extraosseal calcification [3]. Its decreased serum levels predict mortality of patients with liver cirrhosis [4] and end-stage renal disease [5].
The molecule is a natural inhibitor of insulin receptor tyro- sine kinase, thus AHSG plays a role in the development of in- sulin resistance [6–9]. Obesity [10], type 2 diabetes mellitus (T2DM) [11–13], metabolic syndrome [14], adipocyte dysfunc- tion [15] and fatty liver [9,16] have been linked to elevated se- rum AHSG concentration.
At the molecular level, the synthesis of AHSG is enhanced by free fatty acids (FFAs) via the nuclear factor kB (NFkB) [15]. The AHSG molecule binds to FFA [17]. By binding to the Toll-like re- ceptor 4 (TLR4), the FFA-AHSG complex generates inflamma- tory signals and insulin resistance [17]. Serum AHSG and FFA interact with each other in predicting insulin sensitivity [18].
Several SNP-s of AHSG have been studied. Serum AHSG con- centration has been linked with the rs4917 [19–22], the AHSG 1–2 [23], and polymorphism of the molecule. The rs4917 SNP has been associated with obesity [22,24,25], T2DM [26,27], ath- erosclerosis, and mortality [19,27]. In these studies the minor variants seemed to be protective. Others did not find such as- sociations in these clinical settings [26,28–30]. Dyslipidemia has been associated with the –469 T/G (rs2077119) SNP [26,28].
The minor variant of the SNP rs2248690 was associated with lower AHSG concentrations but not with the higher risk of di- abetes [27,31]. This SNP in the promoter region of the AHSG gene seems to affect the AHSG gene transcription, possibly by producing different associations with AP-1 [32]. A strong link- age between the rs224869, rs4917, and the risk of myocardial infarction has been observed in the EPIC Potsdam Study [19].
Others found no association between AHSG variants rs4917, rs2248690, and rs2518136, and clinical atherosclerosis [33].
In a magnetic resonance study, AHSG variation was not as- sociated with regional body fat distribution AHSG but it was with the whole body fat composition [20].
Reports on AHSG rs4918 (Thr256Ser) polymorphism in exon 7 are less inconsistent. Lavebratt et al. reported a higher frequen- cy of the G allele among lean Swedish men [22]. Others found the G allele less advantageous. The rs4918 G allele was associ- ated with high mortality in renal transplant patients [34], and conferred higher risk for ischemic stroke than the C allele [35].
In this study we intended to determine the association of the alleles in rs4918 SNP of AHSG with parameters of obesity (BMI), lipid status (total cholesterol, LDL cholesterol, HDL cho- lesterol, and triglyceride), proinflammatory cytokines (TNFa), and adipokines (adiponectin, resistin, and leptin), in two un- related groups of individuals, i.e., among healthy persons (co- hort 1) and patients surviving myocardial infarction (cohort 2).
Material and Methods
Cohorts
Cohort 1 consisted of 82 healthy individuals (17 men, 65 wom- en, age: 60.1±6.9 years, mean±SD, range: 42–79) who met the inclusion criteria: healthy status by physical examination, com- parable age to group 2, BMI below 30 kg/m2, and normal re- sults during routine laboratory analysis. These individuals were selected from a larger group of patients as described earlier [25]. The male/female ratios according to the genotypes were:
CC: 8/31, CT: 7/25, and TT: 2/8.
Cohort 2 consisted of 157 patients with previous myocardial infarction (103 men, 54 women, age: 59.4±12.2 years, range:
37–85). Only cases with ST-elevation (STEMI) occurring 6–24 months before the start of the study were investigated. The diagnosis of STEMI was established by the alteration of elec- trocardiography and troponin. Exclusion criteria were: clinical or laboratory signs of acute infection, malignant tumor, hepatic disease, renal failure, immune suppression, and severe medi- cal or surgical conditions such as myocardial infarction with- in 6 months, stroke (at any time), trauma, or surgical proce- dures. There were 48 patients with diabetes mellitus (all with type 2 diabetes [T2DM], diagnosed according to WHO criteria) and were treated with diet, metformin, and bedtime insulin.
Sixty-five percent of patients in cohort 2 received statins and 70% of them received aspirin. Cohort 2 also included 42 obese (BMI ³30 kg/m2) and 115 non-obese patients. The male/fe- male ratios according to the genotypes were: CC: 48/30, CT:
40/18, and TT: 15/6.
The study was approved by the local Ethics Committee of the Károlyi Sándor Municipality Hospital. All persons gave their in- formed consent prior to their inclusion in the study.
Genotyping
The single-nucleotide polymorphism (SNP) rs 4918 genotyp- ing was carried out using the Kompetitive Allele Specific PCR genotyping system assay (KASPTM) (LGC Genomics, Berlin, Germany) according to the manufacturer’s instructions and also described by us earlier [25]. Polymerase chain reaction (PCR) conditions included 20 ng of genomic DNA per sample
in a total volume of 8 µl and 37 temperature cycles. PCR reac- tion was carried out by a 7900HT Fast Real-Time PCR System (Life Technologies). Classical three-cluster pattern for a SNP was considered successful and polymorphic. The genotyping was monitored by using 9 samples (3 parallels for CC, CT, and TT genotypes, each) in every measurement. These genotypes were also determined by KASPTM. The success rate of geno- type calls was >99%.
Determination of other laboratory parameters
Serum AHSG concentration by radial immunodiffusion (RID) was as previous described elsewhere [36]. Intra-assay (IACV) and interassay IECV) coefficients of variation were below 5%.
Adiponectin levels were measured with radioimmunoassay
(IACV: 3.86%, IECV: 8.47%; Linco Research, St Charles, MO, USA). Serum tumor necrosis factor-a (TNFa, Sigma, St Louis, MO, USA; IACV: 4.8%, IECV: 6.7%), resistin (Linco Research Inc., IACV: 4.0%, IECV: 7.0%), and leptin (DRG International, Mountainside, NJ, USA, IACV%: 4.6%, IECV%: 6.6%) were mea- sured by ELISA.
Fasting levels of serum glucose, total cholesterol, low-density (LDL) cholesterol, high-density (HDL) cholesterol, and triglyc- erides were detected by routine chemical laboratory methods.
Insulin concentration was measured by insulin direct human ELISA kit (Invitrogen, Camarillo, CA, USA, lowest detectable concentration 0.17 µIU/ml, IACV: 4.8%, IECV: 81%). C-peptide was measured by RIA (Biodata, Rome, Italy, lowest detectable concentration: 0.2 ng/ml, IACV: 5.6%, IECV: 7.3%).
rs4918 polymorphism* Nucleotide count Nucleotide frequency**
CC CG GG Total C G C G
Cohort 1 39 32 10 81 110 52 0.679 0.321
Cohort 2 81 61 15 157 223 91 0.710 0.290
Table 1. Allelic distribution of cohorts 1 and 2.
Chi2=0.528, p=0.768.
Parameter CC homozygotes
(n=39)
CG heterozygotes (n=32)
GG homozygotes
(n=10) p*
AHSG (mg/l) 605±84 627±85 613±117 0.185
BMI (kg/m2) 23.9±1.7 24.1±1.4 24.5±1.6 0.257
Abdominal circumference (cm) 87±11 88±8 87±10 0.872
Total cholesterol (mmol/l) 4.98±1.07 4.96±0.83 5.13±1.35 0.930
LDL-cholesterol (mmol/l) 3.13±0.64 2.65±0.82 1.93±0.40 0.292
HDL-cholesterol (mmol/l) 1.39±0.20 1.54±0.27 1.49±0.41 0.597
Triglyceride (mmol/l) 1.85±1.13 1.71±0.88 1.64±0.75 0.950
TNFa (pg/ml) 4.11±0.25 4.10±0.20 3.85±0.22 0.013
0.007**
Adiponectin (µg/ml) 12.3±3.37 12.7±2.87 14.3±2.30 0.131
Resistin (ng/ml) 6.64±2.24 5.76±2.67 6.96±3.52 0.264
Leptin (ng/ml) 10.7±9.2 13.8±9.2 14.1±9.8 0.109
C-peptide (ng/ml) 1.07±0.31 1.15±0.42 1.07±0.29 0.247
Glucose (mmol/l) 4.58±0.42 4.39±0.36 4.22±0.34 0.052
Insulin (µU/ml) 5.30±1.16 5.05±0.99 5.62±0.93 0.348
Table 2. Cohort 1: Comparison of the genotypes of rs4918 (mean ±SD).
* Kruskal-Wallis test in all parameters; **CC vs. GG, when post hoc p<0.05
Statistical analysis
Statistical analysis was carried out using the SPSS v.21 statisti- cal software (SPSS Inc., Chicago, IL, USA). Non-parametric meth- ods, including the Bonferroni (Dunn) post-hoc test, were used.
Results
The allele frequencies did not differ between the two cohorts (Table 1).
Cohort 1. Association of the rs4918 alleles with parameters of obesity
Anthropologic and laboratory parameters of cohort 1 are shown in Table 2. During multiple comparisons we observed significant differences in TNFa levels only. Compared to non-G carriers (n=39), the presence of the G nucleotide (n=42) was associat- ed with lower TNFa (3.85±0.22 vs. 4.10±0.23 pg/ml, p=0.003), higher leptin (13.9±9.23 vs. 10.7±9.19 ng/ml, p=0.036), and low- er adiponectin levels (12.4±3.14 vs. 14.3±2.30 µg/ml, p=0.047).
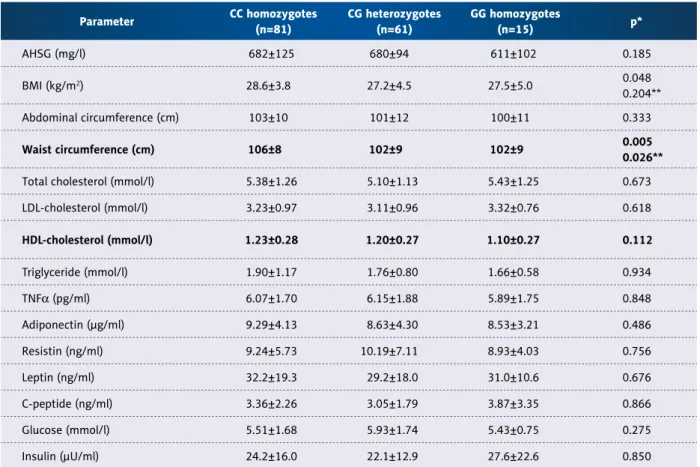
Cohort 2. Association of the rs4918 alleles with parameters of obesity
On multiple comparisons we found significant differences in waist circumference (Table 3). There was a trend towards lower values of obesity in patients with the G allele. Indeed, G-carriers (n=76) had significantly lower BMI (27.3±4.6 vs.
28.6±3.8 kg/m2, p=0.017) and waist circumference (102±9 vs. 106±8 cm, p=0.002) than those without the G nucleotide (n=81). Other parameters, including abdominal circumference (101±12 vs. 104±10 cm, p=0.168), did not differ significantly.
Comparison of diabetic and non-diabetic individuals in cohort 2
There were 48 patients with T2DM in cohort 2. They differed from the non-diabetic individuals (n=109) only in parameters of insulin resistance – glucose (7.08±1.99 vs. 5.03±0.68 mmol/l, p<0.001), insulin (28.4±16.4 vs. 21.7±14.8 µU/ml, p=0.008), C-peptide (3.93±2.27 ng/ml vs. 3.00±2.13 ng/ml, p=0.008), HOMA A (7.62±3.45 vs. 4.67±3.04 p<0.001), and HOMA B (194±133 vs. 260±147, p=0.004), but not in those of obesity – BMI (28.8±4.51 vs. 27.7±3.93 kg/m2, p=0.187), abdominal
Parameter CC homozygotes
(n=81)
CG heterozygotes (n=61)
GG homozygotes
(n=15) p*
AHSG (mg/l) 682±125 680±94 611±102 0.185
BMI (kg/m2) 28.6±3.8 27.2±4.5 27.5±5.0 0.048
0.204**
Abdominal circumference (cm) 103±10 101±12 100±11 0.333
Waist circumference (cm) 106±8 102±9 102±9 0.005
0.026**
Total cholesterol (mmol/l) 5.38±1.26 5.10±1.13 5.43±1.25 0.673
LDL-cholesterol (mmol/l) 3.23±0.97 3.11±0.96 3.32±0.76 0.618
HDL-cholesterol (mmol/l) 1.23±0.28 1.20±0.27 1.10±0.27 0.112
Triglyceride (mmol/l) 1.90±1.17 1.76±0.80 1.66±0.58 0.934
TNFa (pg/ml) 6.07±1.70 6.15±1.88 5.89±1.75 0.848
Adiponectin (µg/ml) 9.29±4.13 8.63±4.30 8.53±3.21 0.486
Resistin (ng/ml) 9.24±5.73 10.19±7.11 8.93±4.03 0.756
Leptin (ng/ml) 32.2±19.3 29.2±18.0 31.0±10.6 0.676
C-peptide (ng/ml) 3.36±2.26 3.05±1.79 3.87±3.35 0.866
Glucose (mmol/l) 5.51±1.68 5.93±1.74 5.43±0.75 0.275
Insulin (µU/ml) 24.2±16.0 22.1±12.9 27.6±22.6 0.850
Table 3. Cohort 2: Comparison of the genotypes of rs4918 (mean ±SD).
* Kruskal-Wallis test in all parameters; ** CC vs. GG, when post hoc p<0.05
circumference (104±12 vs. 101±10 cm, p=0.200), or waist cir- cumference (105±10 vs. 104±8 cm, p=0.510). Due to the small size of the minor allele G among diabetics, statistical analy- sis could not be done among CC (n=24), CG (n=21), and GG (n=3) variants. Comparison of C- (n=45) with non-C (n=3) or G- (n=24) with non-G-carriers (n=24) showed no significant differences in the diabetic group (data not shown).
In patients without diabetes, we found no significant differ- ences between CC and GG homozygotes. On the other hand, G-carriers (n=52) had lower serum AHSG (602±108 vs. 676±110 mg/l, p=0.043), BMI (26.4±4.0 vs. 28.7±3.8 kg/m2, p=0.001), and waist circumference (100±7 vs. 106±8 cm, p<0.001) and mild- ly lower abdominal circumference values (99±11 vs. 103±10 cm, p=0.068) than non-G carriers (n=57).
Comparison of obese and non-obese individuals in cohort 2
Forty-eight patients were clinically overweight or obese as de- fined by BMI ³30 kg/m2. They differed from non-obese individu- als only in BMI, abdominal and waist circumferences, waist/hip ratio, and TNFa, but not in other parameters (Table 4). Serum
AHSG and resistin concentrations were also marginally high- er in obese than in non-obese patients.
Nineteen percent (12/64) of the lean individuals carried the GG genotype in contrast to 9% (3/32) of obese patients.
Accordingly, the minor allele G was found to be more frequent in lean (62/114) than in obese patients (14/43, chi-square:
5.957, RR=1.067, 95% CI=1.053–2.651, p=0.015).
Since AHSG has been implicated both with obesity and dia- betes, further analysis of the genotype and allelic distribution among obese and non-obese was performed with respect to diabetes (Table 5). Association between BMI and rs4918 poly- morphism (CC, CG, and GG genotypes, and G allele) could be observed among patients without diabetes but not in diabet- ics. In addition, a strong linearity between the frequency of the G allele and lower BMI could be identified. Subgroup anal- ysis of the anthropometric and metabolic parameters in obese patients according to different genotypes and alleles did not result in significant statistical differences (data not shown).
Parameter Obese
(n=48)
Non-obese
(n=109) p*
AHSG (mg/l) 699±126 661±105 0.053
BMI (kg/m2) 23.1±2.9 26.0±2.4 <0.001
Abdominal circumference (cm) 112±8 98±10 <0.001
Waist circumference (cm) 111±8 102±7 <0.001
Waist/hip ratio 1.00±0.07 0.96±0.08 <0.001
Total cholesterol (mmol/l) 5.20±1.31 5.29±1.14 0.520
LDL-cholesterol (mmol/l) 3.14±0.99 3.20±0.90 0.653
HDL-cholesterol (mmol/l) 1.14±0.23 1.22±0.29 0.107
Triglyceride (mmol/l) 1.99±1.04 1.80±0.95 0.066
TNFa (pg/ml) 6.69±1.77 5.91±1.72 0.009
Adiponectin (µg/ml) 8.53±4.78 9.24±4.12 0.198
Resistin (ng/ml) 11.6±8.13 8.96±5.58 0.057
Leptin (ng/ml) 38.1±20.5 29.9±17.4 0.122
C-peptide (ng/ml) 3.76±2.41 3.10±2.10 0.097
Glucose (mmol/l) 5.69±1.47 5.70±1.71 0.553
Insulin (µU/ml) 27.0±16.9 22.4±14.8 0.106
Table 4. Cohort 2: Comparison of laboratory parameters (mean±SD) of obese and non-obese patients (mean±SD).
* Mann-Whitney test.
Table 5. Cohort 2: Association between BMI and rs4918 polymorphism. A: genotypes (CC, CG, GG), B: distribution of the G allele.
Genotype BMI (kg/m2)
Total
0–25 26–29 30–39 40 or more
Patients without diabetes
CC 13 22 22 0 57
CG 16 20 4 0 40
GG 5 4 2 1 12
Total 34 46 28 1 109
Chi square: 19.671, p=0.003
Linear-by-linear association value: 4.416, p=0.036
Patients with diabetes
CC 7 8 9 0 24
CG 6 5 9 1 21
GG 1 2 0 0 3
Total 14 15 18 1 48
Chi square: 4.201, p=0.649
Linear-by-linear association value: 0.011, p=0.918
All patients in cohort 2
CC 20 30 31 0 81
CG 22 25 13 1 61
GG 6 6 2 1 15
Total 48 61 46 2 157
Chi square: 11.479, p=0.075
Linear-by-linear association value: 3.314, p=0.075
Allele BMI (kg/m2)
Total
0–25 26–29 30–39 40 or more
Patients without diabetes
G 21 24 26 1 52
Non-G 13 22 22 0 57
Total 34 46 28 1 109
Chi square: 11.908, p=0.008
Linear-by-linear association value: 7.420, p=0.006
Patients with diabetes
G 7 7 9 1 24
Non-G 7 8 9 0 24
Total 14 15 18 1 48
Chi square: 1.067, p=0.785
Linear-by-linear association value: 0.111, p=0.739
All patients in cohort 2
G 28 31 15 2 76
Non-G 20 30 31 0 81
Total 48 61 46 2 157
Chi square: 11.479, p=0.075
Linear-by-linear association value: 3.314 p=0.075 Mantel-Haenszel statistics
A
B
Analysis of non-obese, non-diabetic patients in cohort 2 In order to eliminate the confounding effects of diabetes and obesity, we analyzed non-obese, non-diabetic patients sepa- rately in cohort 2 (n=83). On comparison of patients with the CC (n=37), CG (n=37) and GG genotypes (n=9), no significant differences were observed. Patient with G allele (n=37), how- ever, still had significantly lower waist circumference (103±6.8 vs. 99±7.3 cm, p=0.026) and mildly lower BMI (25.3±2.6 vs.
26.5±2.3 kg/m2, p=0.048) than the non-G carriers (n=46). Other parameters showed no differences (data not shown).
Discussion
Our results suggest that in rs4918 SNP of AHSG, the presence of the G nucleotide is associated with lower serum TNFa and adiponectin and higher leptin concentrations in cohort 1 com- pared to that of the C nucleotide. In cohort 2, waist circumfer- ence and BMI values were lower in G-carriers than in C-carriers.
In cohort 2, the association between the rs4918 polymorphism and obesity was relevant only in patients without diabetes. The small sample size could not allow analysis in the diabetic sub- group. The link between obesity parameters and the rs4918 polymorphism, however, could still be observed among non- obese and non-diabetic patients. Leanness, again, was asso- ciated with higher prevalence of the G allele.
There were obvious differences between the anthropometric, metabolic, adipokine, and other cytokine levels of the two co- horts; therefore, we did not intend to compare them. Cohort 1 consisted of healthy individuals with normal BMI (below 25), whereas members in cohort 2 were chosen based on a hard cardiovascular endpoint (myocardial infarction) and had mul- tiple cardiovascular risk factors (vascular disease, obesity, di- abetes, and elevated proinflammatory cytokine levels).
Reports on AHSG rs4918 (Thr256Ser) polymorphism are con- tradictory. The rs4917 TT and rs4918 GG haplotypes, along with rs2593813: G, conferred an increased likelihood of lean- ness in Swedish men [22]. We also found the minor T allele of rs4917 was more frequent among lean patients [25]. On the other hand, others found the G allele less advantageous. In a follow-up study on dialysis patients, the CG and GG genotypes were associated with lower AHSG levels and slightly increased mortality; however, no causative effect on lethal outcome was observed [37]. The rs4918 G allele was associated with low- er serum AHSG levels [23], the latter being a determinant of aortic calcification and high mortality in renal transplant pa- tients [34]. Similarly, Ma and others found the G allele confers a higher risk for ischemic stroke than the C allele [35]. In ad- dition, they found a higher frequency of the GG genotype and the G allele in patients with ischemic stroke or atherosclerotic
cerebral infarction than in healthy controls in a Northern Han Chinese population [35].
There are increasing number of observations suggesting that ethnic differences may explain the contradictory effects of dif- ferent AHSG genotypes and their putative function. It is known that the minor variant AHSG-2 is linked with higher estradiol levels and higher bone density in Caucasian women [38,39].
Jiang and others found evidence of linkage between the AHSG- SacI polymorphism (rs4918) and bone geometry in Caucasians, but not in Chinese [40]. Other studies also demonstrated sig- nificant differences between genes determining bone density in the Caucasian and Chinese populations [41,42].
In theory, change in its serum concentrations or altered mo- lecular structure or function of AHSG (or both) may explain the different activities of the rs4918 variants.
Elevated AHSG levels play a role in the development of obe- sity and insulin resistance [6–10,14]. Since the first report on AHSG SNP-s, including rs4918 [23], several other studies have confirmed that minor variants of AHSG (AHSG2) are linked with lower serum AHSG levels [19,20,22]. In spite of the small sample size, we also noticed a similar trend in cohort 2. The mean of the AHSG levels was lower in the GG than in the CC in cohort 2, although the difference was not statistically sig- nificant, probably because of the small sample size.
Elevated serum AHSG is also associated with increased risk of diabetes [11,12,43] but this association is not as clear as that with non-diabetic healthy or obese individuals [27,44]. Jensen et al. found that serum AHSG concentration was inversely cor- related with cardiovascular mortality in old, non-obese, non- diabetic individuals [27]. This trend was reversed in diabetes.
Obesity and insulin resistance had similar modifying effects in individuals without diabetes. Thus, the association with elevat- ed AHSG and lower mortality was present only in non-obese persons with normal HOMA-IR below the median value [27].
In the EPIC Potsdam Study, Fisher et al. observed a strong associ- ation between the C allele of rs4917 and occurrence of myocar- dial infarction [19]. They suggested the pathogenic role of AHSG in the development of cardiovascular diseases. We found no sta- tistically significant differences of rs4918 genotypes and alleles between the two small cohorts we studied. Nevertheless, it is remarkable that in cohort 1 (healthy persons with normal BMI), TNFa levels significantly differed among rs4918 homozygotes and the G was associated with lower TNFa and adiponectin and higher leptin levels than the C allele. These differences could not be detected in cohort 2, probably because of the existing sub- clinical inflammation and prevalence of obesity among patients.
Signal transduction changes in the peri-infarct area may also affect infarct size and post-infarction cardial remodelling [45].
In theory, the rs4918 polymorphism, which affects the intron 7 of the molecule (D3 domain region), may also result in al- tered function of the molecule. It has been demonstrated that the TT variant of rs4917 has 35 times higher lipolytic sensitivi- ty than its CC variant, but no functional differences for rs4918 have been reported [46]. Since AHSG connects metabolic and inflammatory processes by linking FFAs and TLR4-s, it seems relevant to investigate the FFA and TLR4 binding activities of the various rs4918 AHSG polymorphisms [15–17].
One limitation of our study is that the sample size did not al- low for subgroup analysis, especially the minor (G) nucleotide frequency in cohort 2. Secondly, the cross-sectional design did not allow drawing causal relationships between rs4918 poly- morphism and the parameters we investigated. The obligatory antilipemic (mainly with statins), platelet aggregation inhibit- ing (salicylates, clopidogrel), and antidiabetic treatment (bed- time insulin) may mask the differences in serum AHSG concen- trations and their correlation with rs4918 variants in cohort 2.
Conclusions
Our observations (made in a Caucasian population) are in line with those suggesting that the minor variant G of rs4918 is linked with more favorable parameters than is the C allele. In addition, AHSG seems to be correlated much more with obe- sity than with diabetes mellitus. Large-scale prospective stud- ies could determine the causative relationship and functional impact of AHSG variants in different populations.
Acknowledgements
Authors thank to Mrs. M. Vángor for the genotyping of fe- tuin-A rs4918 and V.M. Nagyné for the determination of se- rum AHSG concentration.
Conflicts of interest
The authors declare that they have no conflicts of interest.
References:
1. Triffitt JT, Gebauer U, Ashton BA et al: Origin of plasma alpha-2 HS- glycoprotein and its accumulation in bone. Nature, 1976; 5565: 226–27 2. Lebreton JP, Joisel F, Raoult JP et al: Serum concentration of human alpha
2 HS glycoprotein during the inflammatory process: evidence that alpha 2 HS glycoprotein is a negative acute-phase reactant. J Clin Invest, 1979; 4:
1118–29
3. Schafer C, Heiss A, Schwarz A et al: The serum protein alpha(2)-Heremans- Schmid glycoprotein/fetuin-A is a systemically acting inhibitor of ectopic calcification. J Clin Invest, 2003; 3: 357–66
4. Kalabay L, Graf L, Voros K et al: Human serum fetuin A/alpha 2HS- glycoprotein level is associated with long-term survival in patients with alcoholic liver cirrhosis, comparison with the Child-Pugh and MELD scores.
BMC Gastroenterol, 2007; 7: 15
5. Ketteler M, Bongartz P, Westenfeld R et al: Association of low fetuin-A (AHSG) concentrations in serum with cardiovascular mortality in patients on dialysis: a cross-sectional study. Lancet, 2003; 9360: 827–33 6. Srinivas PR, Wagner AS, Reddy LV et al: Serum alpha 2-HS-glycoprotein is
an inhibitor of the human insulin receptor at the tyrosine kinase level. Mol Endocrinol, 1993; 11: 1445–55
7. Kalabay L, Chavin K, Lebreton JP et al: Human recombinant alpha 2-HS gly- coprotein is produced in insect cells as a full length inhibitor of the insu- lin receptor tyrosine kinase. Horm Metab Res, 1998; 1: 1–6
8. Mathews ST, Singh GP, Ranalletta M et al: Improved insulin sensitivity and resistance to weight gain in mice null for the Ahsg gene. Diabetes, 2002;
8: 2450–58
9. Stefan N, Hennige AM, Staiger H et al: Alpha(2)-Heremans-Schmid glyco- protein/fetuin-A is associated with insulin resistance and fat accumulation in the liver in humans. Diabetes Care, 2006; 4: 853–57
10. Reinehr T, Roth CL: Fetuin-A and its relation to metabolic syndrome and fatty liver disease in obese children before and after weight loss. J Clin Endocrinol Metab, 2008; 11: 4479–85
11. Stefan N, Fritsche A, Weikert C et al: Plasma fetuin-A levels and the risk of type 2 diabetes. Diabetes, 2008; 10: 2762–67
12. Ix JH, Wassel CL, Kanaya AM et al: Fetuin-A and incident diabetes mellitus in older persons. JAMA, 2008; 2: 182–88
13. Stefan N, Sun Q, Fritsche A et al: Impact of the adipokine adiponectin and the hepatokine fetuin-a on the development of type 2 diabetes: prospec- tive cohort- and cross-sectional phenotyping studies. PloS One, 2014; 3:
e92238
14. Ix JH, Shlipak MG, Brandenburg VM et al: Association between human fe- tuin-A and the metabolic syndrome: data from the Heart and Soul Study.
Circulation, 2006; 14: 1760–67
15. Dasgupta S, Bhattacharya S, Biswas A et al: NF-kappaB mediates lipid-in- duced fetuin-A expression in hepatocytes that impairs adipocyte function effecting insulin resistance. Biochem J, 2010; 3: 451–62
16. Stefan N, Haring HU: The role of hepatokines in metabolism. Nat Rev Endocrinol, 2013; 3: 144–52
17. Pal D, Dasgupta S, Kundu R et al: Fetuin-A acts as an endogenous ligand of TLR4 to promote lipid-induced insulin resistance. Nat Med, 2012; 8:
1279–85
18. Stefan N, Haring HU: Circulating fetuin-A and free fatty acids interact to predict insulin resistance in humans. Nat Med, 2013; 4: 394–95 19. Fisher E, Stefan N, Saar K et al: Association of AHSG gene polymorphisms
with fetuin-A plasma levels and cardiovascular diseases in the EPIC-Potsdam study. Circ Cardiovasc Genet, 2009; 6: 607–13
20. Müssig K, Staiger H, Machicao F et al: AHSG gene variation is not associ- ated with regional body fat distribution – a magnetic resonance study. Exp Clin Endocrinol Diabetes, 2009; 8: 432–37
21. Jensen MK, Bartz TM, Djousse L et al: Genetically elevated fetuin-A lev- els, fasting glucose levels, and risk of type 2 diabetes: The cardiovascular health study. Diabetes Care, 2013; 10: 3121–27
22. Lavebratt C, Wahlqvist S, Nordfors L et al: AHSG gene variant is associat- ed with leanness among Swedish men. Hum Genet, 2005; 1: 54–60 23. Osawa M, Tian W, Horiuchi H et al: Association of alpha 2-HS glycoprotein
(AHSG, fetuin-A) polymorphism with AHSG and phosphate serum levels.
Hum Genet, 2005; 3: 146–51
24. Suchanek P, Kralova-Lesna I, Poledne R et al: An AHSG gene variant mod- ulates basal metabolic rate and body composition development after a short-time lifestyle intervention. Neuro Endocrinol Lett, 2011; 32(Suppl.)2:
32–36
25. Temesszentandrasi G, Voros K, Borocz Z et al: Association of human fetuin- A rs4917 polymorphism with obesity in 2 cohorts. J Investig Med, 2015; 3:
548–53
26. Andersen G, Burgdorf KS, Sparso T et al: AHSG tag single nucleotide poly- morphisms associate with type 2 diabetes and dyslipidemia: Studies of met- abolic traits in 7,683 white Danish subjects. Diabetes, 2008; 5: 1427–32 27. Jensen MK, Bartz TM, Mukamal KJ et al: Fetuin-A, type 2 diabetes, and risk
of cardiovascular disease in older adults: the cardiovascular health study.
Diabetes Care, 2013; 5: 1222–28
28. Dahlman I, Eriksson P, Kaaman M et al: Alpha2-Heremans-Schmid glyco- protein gene polymorphisms are associated with adipocyte insulin action.
Diabetologia, 2004; 11: 1974–79
29. Siddiq A, Lepretre F, Hercberg S et al: A synonymous coding polymorphism in the alpha2-Heremans-schmid glycoprotein gene is associated with type 2 diabetes in French Caucasians. Diabetes, 2005; 8: 2477–81
30. Lehtinen AB, Burdon KP, Lewis JP et al: Association of alpha2-Heremans- Schmid glycoprotein polymorphisms with subclinical atherosclerosis. J Clin Endocrinol Metab, 2007; 1: 345–52
31. Thakkinstian A, Chailurkit L, Warodomwichit D et al: Causal relationship be- tween body mass index and fetuin-A level in the asian population: A bidi- rectional Mendelian randomization study. Clin Endocrinol, 2014; 2: 197–203 32. Inoue M, Takata H, Ikeda Y et al: A promoter polymorphism of the alpha
2-HS glycoprotein gene is associated with its transcriptional activity. Diab Res Clin Pract, 2008; 1: 164–70
33. Muendlein A, Stark N, Rein P et al: Are AHSG polymorphisms directly asso- ciated with coronary atherosclerosis? Clin Chim Acta, 2012; 1–2: 287–90 34. Marechal C, Schlieper G, Nguyen P et al: Serum fetuin-A levels are associ-
ated with vascular calcifications and predict cardiovascular events in re- nal transplant recipients. Clin J Am Soc Nephrol, 2011; 5: 974–85 35. Ma S, He Z, Zhao J et al: Association of AHSG gene polymorphisms with
ischemic stroke in a Han Chinese population. Biochem Genet, 2013; 11–
12: 916–26
36. Kalabay L, Jakab L, Prohászka Z et al: Human fetuin/alpha 2HS-glycoprotein level as a novel indicator of liver cell function and short-term mortality in patients with liver cirrhosis and liver cancer. Eur J Gastroenterol Hepatol, 2002; 4: 389–94
37. Verduijn M, Prein RA, Stenvinkel P et al: Is fetuin-A a mortality risk factor in dialysis patients or a mere risk marker? A Mendelian randomization ap- proach. Nephrol Dial Transplant, 2011; 1: 239–45
38. Eichner JE, Friedrich CA, Cauley JA et al: Alpha 2-HS glycoprotein pheno- types and quantitative hormone and bone measures in postmenopausal women. Calcif Tissue Int, 1990; 6: 345–49
39. Dickson IR, Gwilliam R, Arora M et al: Lumbar vertebral and femoral-neck bone-mineral density are higher in postmenopausal women with the al- pha(2)HS-glycoprotein-2 phenotype. Bone Mineral, 1994; 3: 181–88 40. Jiang H, Lei SF, Xiao SM et al: Association and linkage analysis of COL1A1
and AHSG gene polymorphisms with femoral neck bone geometric param- eters in both Caucasian and Chinese nuclear families. Acta Pharmacol Sin, 2007; 3: 375–81
41. Dvornyk V, Liu PY, Long JR et al: Contribution of genotype and ethnicity to bone mineral density variation in Caucasians and Chinese: A test for five candidate genes for bone mass. Chin Med J (Engl.), 2005; 15: 1235–44 42. Dvornyk V, Liu XH, Shen H et al: Differentiation of Caucasians and Chinese
at bone mass candidate genes: Implication for ethnic difference of bone mass. Ann Human Genet, 2003; 67: 216–27
43. Stefan N, Haring HU, Schulze MB: Association of fetuin-A level and diabe- tes risk. JAMA, 2008; 19: 2247
44. Mori K, Emoto M, Yokoyama H et al: Association of serum fetuin-A with in- sulin resistance in type 2 diabetic and nondiabetic subjects. Diabetes Care, 2006; 2: 468
45. Wang L, Li G, Wang Z et al: Elevated expression of C3G protein in the peri- infarct myocardium of rats. Med Sci Monit Basic Res, 2013; 19: 1–5 46. Lavebratt C, Dungner E, Hoffstedt J: Polymorphism of the AHSG gene is as-
sociated with increased adipocyte beta2-adrenoceptor function. J Lipid Res, 2005; 10: 2278–81