T
Maja Klun – Jože Benčina – Lan Umek
Online Budget Transparency Index and its Determinants in Slovenian Municipalities
Summary: In this article, we evaluate the online local budget transparency (OLBT) for all Slovenian municipalities and analyse the impact of various factors on the measured transparency. Most of the municipalities comply with existing regulations. The comparison of the mean values of 91 different characteristics shows that municipalities which do not comply with regulation are smaller, with poorer education structure and social position of citizens. Several municipalities are providing budget transparency beyond the legal requirements. They are smaller and less wealthy than other municipalities complying with regulation. We explain both phenomena by agency and legitimacy theory.1
KeywordS: local budget, fiscal transparency, Slovenia JeL Code: E6
doI: https://doi.org/10.35551/PFQ_2019_3_5
The transparency of spending public money has become of interest in terms of extensive research, since it verifies the effects of various factors on transparency and vice versa. Greater budget transparency is supposed to enable more efficient use of public money and the implementation of public policies. The main purpose of transparency is that the public is given access to information related to public finances; thus having a greater opportunity to influence decisions on public spending and public revenues. Caamano-Alegre et al. (2013) explained budget transparency as '…a tool for facilitating a relationship between public
budgeting and market requirements, civil society demands and citizen participation.'
In literature, we can find different approaches to measuring budget transparency.
some of the approaches use questionnaires;
others use tracking the information available to the public. The International Budget Partnership (i.e. IBP, 2013) uses a complex questionnaire to measure the national budget transparency index for most countries in the world. In our research, we decided to use the methodology determined in Ott et al. (2014), according to which we checked webpages of all the slovenian municipalities to track the budget documents available online.
further from research on measuring transparency, we can find different studies about explanations of transparency and the E-mail address: joze.bencina@fu.uni-lj.si
maja.klun@fu.uni-lj.si lan.umek@fu.uni-lj.si
different impacts of transparency. Explanations are usually based on the principal-agent theory (ferejohn, 1986; Barro, 1973) and legitimacy theory (Weber, 1978 and suchman, 1995).
Alesina and Perotti (1996) mention also fiscal illusion theory. As mentioned, other studies focused on the impacts of transparency, particularly on fiscal discipline; the efficiency of public money allocation; responsibility;
corruption, etc. (Alesina and Perotti, 1996;
Hameed, 2005; Wehner and Renzio, 2013).
Better transparency improves fiscal discipline, the efficiency of public money allocation and decreases corruption. Despite a range of positive effects studied in a variety of research, Peisakhin and Pinto (2010) argued also side effects of transparency, such as fiscal scandals.
our research adds to different studies in at least two points. firstly, we present the first measurement of slovenian local budget transparency. There is no existing comprehensive study of local budget transparency completed in slovenia to such an extent. secondly, the research complements the existing literature in the field of measuring the explanatories on the level of transparency of local communities.
The basic research question is how the municipalities that demonstrate different levels of transparency of budget documents differ from each other. or in other words, what incentives or external pressures make the agents to develop a certain level of possible transparency actions. from this point, we formulate two specific questions:
What makes the municipalities not comply with regulations?
What makes the municipalities develop the budget transparency to the highest level observed in our research?
To answer the questions, we defined a model for comparison of groups of municipalities.
Therefore, we compared the groups of municipalities with different behaviour in the provision of transparency and studied
differences between the pairs of groups. We tested 91 fiscal, political, socio-demographic and socio-economic indicators. We chose them based on previous research, and we added others following the explanatory theories mentioned before.
This research complements the findings of other authors who used similar indicators and analysed their impact on transparency.
Beside that, it opens also some new questions about determinants of the behaviour of the municipalities in provision of transparency.
The article is structured as follows: the literature review chapter is followed by the presentation of methodology and the results of the research, along with the comparison of findings from similar research. The conclusion includes a summary of the findings and challenges for future research.
MEASUREMENTS AND DETERMINANTS OF BUDGET TRANSPARENCY
Transparency is a very broad concept. It is usually connected to availability of information. Esteves de Araujo and Tejedo-Romero (2016) defined availability of information as supply-side transparency, in contrary to demand-side of transparency, which is determined as usability of this information by different stakeholders.
Heald (2006) pointed out that transparency is a facilitator of good governance. Information available to the public should be timely, reliable, understandable and comprehensive (Kopits and craig, 1998). oEcD (2001, p. 7) adds further that budget transparency means 'the full disclosure of all relevant fiscal information in a timely and systematic manner'. The Inter- national Monetary fund (IMf) in its Manual on fiscal transparency (2007) determined that fiscal transparency include fiscal poli- cy intentions, public sector accounts and fiscal projections. Jordan et al. (2017) pointed
out also the importance of understandable reports, since annual financial reports can be too comprehensive to be understood by the general public. Esteller-More and Polo- Otero (2012, p. 1156) summarised different definitions into 'fiscal transparency entails a government providing detailed information not only about its current budgetary activity, but also about its future forecasts and past perfor- mance … and that this information should be readily available (e.g. accessible free-of-charge on the internet)'. The use of information and communication technologies (IcTs) as a tool, which can improve fiscal transparency was also recognized by different authors (Heeks, 2005;
Kraemer and King, 2006; Alcaide-Muñoz and Rodríguez-Bolívar, 2015).
Monitoring of budget transparency at the national level is carried out by several institutions, namely the oEcD Working Group, the Eu, and the aforementioned IBP.
According to the availability of information on the openness of national budgets, several studies on national budget transparency were carried out [e.g. (Alesina and Perotti, 1996;
Alesina et al., 1999; Bastida and Benito, 2007;
Wehner and Renzio, 2013)]. since there is no common definition of budget transparency, there is also no uniform measurement methodology. Nevertheless, there are several recommendations and measurements, some of which have already been mentioned above.
The oEcD (2002) presents good practices of budget transparency, the International Monetary fund (IMf, 2014) introduced the fiscal transparency code, and the IBP measures open budgets by means of a questionnaire (IBP, 2013). All these recommendations can provide a good basis for the preparation of the basic elements for measuring the openness of fiscal or budget transparency. This has resulted in a number of different measurements and questionnaires, leading to a calculation of budget transparency index (Tekeng and sharaf,
2015; Bolívar, Pérez and López-Hernández, 2013; Jarmuzek et al., 2009; Bastida and Benito, 2007).
studies on measuring local budget transparency are less frequent. Kroth (Kroth, 2012) also points out that there is no uniform methodology for measuring local fiscal transparency since it is more difficult to determine, mainly because it requires the incorporation of knowledge of local conditions. Guillamón et al. (2011) also stressed that measurement at sub-national level is more complex. In 2012, the IBP carried out an analysis of ten pilot studies in the field of local budgets. This article also states that there are very few studies in the field of local government. Nevertheless, in the last decade, some research in the field of establishing local budget transparency can be found in the literature. Beales and Thompson (2010) carried out research for 134 local units in Virginia, usA. They checked the availability of information on the internet using 16 criteria. other authors (Boubeta, santias and Alegre 2010; caamano – Allegre et al., 2011, caamano – Allegre et al., 2013) examined budget transparency for municipalities in an autonomous community of spain, Galicia. Rodríguez-Bolívar et al.
(2013) examined transparency of spanish municipalities. They used the methodology of the International Monetary fund. using the IBP’s methodology, Kroth (2012) carried out an analysis for several south American countries, as well as for India, Malaysia, Mongolia and Mali. Lawson and Alvarez (2013) used the IBP’s methodology to evaluate local budget transparency in Bali, Indonesia and Tanzania.
Ma and Wu (2011) used different sources to determine fiscal transparency of 31 provinces in china. In ott, et al. (2014), the authors checked the availability of budget documents on websites of local communities in croatia.
Like the croatian study, the evaluation of local
budget transparency was done by reviewing websites. Examples of similar methodlogy include selected regions in czech Republic (sedmihradská, 2015), Romania (Pintea et al., 2013; Pintea, 2014) and selected American cities (styles & Tennyson, 2007). In our research, we used the same methodology as ott et al. (2014). We review the webpages of all slovenian municipalities and checked the availability of the selected budget documents.
The methodology is further explained in the chapter about methodology.
Various researchers examined the influence of different factors on budget transparency.
According to different research, the most common theories behind
• determiners of transparency are agency or principal-agent theory,
• neo-institutional theory,
• legitimacy theory and
• fiscal illusion theory.
The main principle of agency theory is that public managers do not have the same interests as citizens, and, therefore, disclosure of information makes their decisions more accountable (Alt et al., 2001; Jensen and Meckling, 1976; fama, 1980; ferejohn, 1986; Barro, 1973). Elected officials as agents should act in the interest of the public that elected them. since citizens are not sure about the actions of elected officials, asymmetry of information occurs. Better transparency improves the lack of information, and, therefore, stakeholders can inform themselves of the actions done by public managers.
It increases efficiency and confidence and therefore reduces the principal-agent problem.
Rodríguez-Bolívar et al. (2013) along with agency theory mentioned neo-institutional theory, which explain adaptation of innovations in management accounting. According to the neo-institutional theory external stakeholders influence the organizations to practices legitimate and socially acceptable measures
(Meyer and Rowan, 1977, scott, 1987; Powel and DiMaggio, 1991). According to legitimacy theory, public officials want to disclose information about their work to promote organizational legitimacy and improve trust in public actions. Therefore, transparency improves public perception of political decisions and makes them more legitimate (Heald, 2006; De fine Licht et al., 2011). In alignment with principal-agent theory, fiscal illusion theory also points out that elected officials are not encouraged to be transparent.
Alesina and Perotti (1996) explained that fiscal illusion theory is based on the perception that the citizen (taxpayer) is not capable to evaluate the full cost of public programmes. In addition, they presented the sources of fiscal illusion in other empirical research (i.e. oates, 1991; Heyndels and smolders, 1994). fiscal transparency overcomes the problem of fiscal illusion since citizens have more information available, and, therefore, the illusion on underestimated costs and overestimated benefits of public spending is decreased.
According to the mentioned theories, different research covers the evaluation of the impact of political factors (i.e. incumbent’s ideology, effective number of political parties, coalition governments and political participation), economic factors (i.e. GDP per capita, local debt, expenditure), and socio-cultural factors, i.e. population size and unemployment rate (Albalate del sol, 2013).
Therefore, it is difficult to make a direct comparison between research results based on reviewed research. Notwithstanding the above, some impacts, which have most commonly proven to be important, can be drawn from most of the research. The results of the research show that the number of inhabitants has a positive impact on budget transparency (e.g.
styles and Tennyson, 2007; caamano-Allegre et al., 2011). A higher level of development or income per capita also has a positive impact
(Giroux and McLelland, 2003). Most of the research did not find any significant impact of local debt (sedmihradska and Haas, 2013; caamano-Allegre et al., 2013;2 Gerunov, 2016).
our research differs from other studies in that it includes the analysis of the behaviour of municipalities, grouping them into categories of those that achieved the index that fulfils the legal requirements and those that do not fulfil these requirements and evaluates the impact of the factors mentioned. This study includes the indicators that can be divided into three main categories: economic, demographic and societal. The average values of these indicators are compared according to the index achieved.
METHODOLOGY
This article presents the results of the first evaluation of the local budget transparency index in slovenia. We used the methodology implemented by ott et al. (2014). As explained above, the review of websites was also used to determine the transparency in several other studies (Kadunc, 2016; sedmihradská, 2015; Pintea et al., 2013; styles & Tenny- son, 2007). The difference from IMf, oEcD and IBP measurements is that we checked the availability of the document as they are, since mentioned measurements use surveys among experts on several questions connected to the fiscal transparency (ie. clear strategy of fiscal development) and not only budget itself. In most cases the mentioned toolkits are prepared for central governments and some parts do no apply for local budget transparency. We decided to measure transparency as availability of selected budget documents for general public. The main purpose of determining the index is to check which documents related to the municipality’s budget are published on their websites. The index is thus determined
by reviewing the municipalities’ websites and determining whether the documents related to budgets are available to the public. In this study, the publication of the following documents was examined (Table 1).
According to the regulations, the publication of the following documents is required: budget proposal, enacted budget and end-year report of the budget (Public finance Act – Jf uPB4, official Gazette of the Republic of slovenia, no. 14/13 of 15 february 2013), which means that municipalities that publish at least the oLBT 1, 2 and 4 (Table 1) documents comply with the regulations. All aspects of transparency include two additional documents, a mid-year report on the implementation of the budget and the citizens’ budget (oLBT 3 and 5) (Table 1).
We checked the municipalities’ websites in accordance with the terms set out in the legislation. In order to determine the index for 2015/2016, we examined the period from December to April, and verified whether the mid-year report for 2015, budget proposal for 2016, enacted budget for 2016 and the final accounts of the budget proposal for 2015 were published. At the same time, we checked that the so-called citizens’ budget is present on the webpage. The presence of each of these documents adds one point to the final index.
If all the stated documents are published on the municipality’s website, the municipality achieves an index of 5. By calculating the transparency index, local communities were classified according to the relationship in regards to the provision of transparency.
The second step of the research was aimed at finding the differences between local communities with different levels of transparency provision. To determine whether the behaviour of municipalities regarding the information transparency is mainly affected by institutional factors or whether the environmental impact is of greater significance
we considered the classification into two main groups of factor variables as follows:
institutional factors and environmental factors (Muñoz & Bolívar, 2015).
Along with this approach, we considered another similar classification focused on information transparency drivers, which takes into account four perspectives (Ma &
Wu, 2011): the perspective external demand on the site of the environmental impact and three perspectives expressing the institutional factors (fiscal performance, resources and capacity and strategic leadership).
finally, to preserve compatibility with the majority of other studies which consider a bit more macro-economic view, we considered four classes of variables (sol, 2013): fiscal, institutional and political, socio demographic
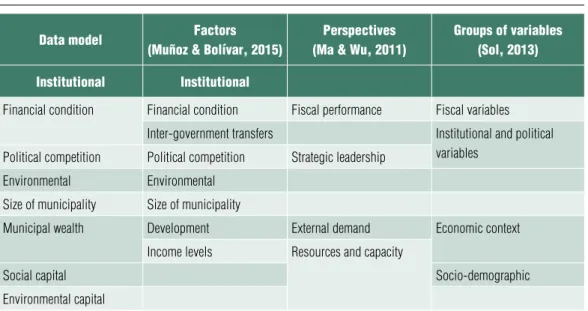
and economic context variables and furnished our data model with the sociodemographic class. The structure of the data model is presented in the Table 2.
following the above-mentioned theories and previous research on influence of different factors on behaviour of municipalities’
officials, we defined a data model with 91 variables (Table 5 in appendix) with 3 control variables, 15 fiscal condition variables, 10 variables of political competition, 4 variables defining municipal size, 34 mucipal wealth varaibles, 18 social capital variables and 7 variables of environmental capital. We took the core variables from the previous research and supplemented them with additional variables from available sources. The core varaibles included
Table 1 Online lOcal budget transparency
(Olbt)
1 Budget proposal Any document which in its title includes a budget proposal or a draft on a municipality’s website, regardless of whether it is published separately or as part of the documentation for consideration at a meeting.
2 Enacted budget Decree on the enacted budget, the enacted budget only as a document or the enacted budget published in a local official journal or local newspaper. The condition is that the document is published on the municipality’s website (i.e.
as part of an official journal or newspaper). If the budget was not adopted in time, the decree on temporary financing is also considered. If the enacted budget is published as a link to another website which, for example, publishes public information of municipalities, it is considered that the document is not available on the municipality’s website.
3 Mid-year report on the implementation of the budget
It is considered that the document is published if it is published separately or as part of the documentation of the municipal council meeting, and it is clear from the title of the document that it is a mid-year report.
4 Year-end report on the implementation of the budget
It is considered that the document is published if it is published separately or as a part of documentation of the municipal council meeting, and it is clear from the title of the document that it is a year-end report.
5 Citizens’ budget It shall be considered if the municipality’s website includes any simplified explanation of the budget, its meaning, or general explanation.
Source: own edited
• investment, debt, electoral turnout, mayor’s gender, population size, unemployment (Esteves de Araujo & Tejedo-Romero, 2016);
• municipal budget balance, municipal public expenditure, municipal public debt, effective number of political parties, number of inhabitants, unemployment rate (caamaño-Alegre, Lago-Peñas, Reyes- santias, & santiago-Boubeta, 2013);
• transfers/total revenues, current transfers/
total revenues, capital transfers/total revenues, public deficit, voter abstention, population, percentage of population over 65 years (Esteller-Moré & otero, 2012);
• debt, budget_imbalance, budget surplus, turnout, gender, population, economic activity, unemployment, tourism, elderly (sol, 2013);
• municipal debt per capita, municipal deficit per capita, tax revenue per capita, regional and central transfers per capita, municipal political strength, Rate of female
aldermen in the council, mayor gender, population of the municipality, income per capita, number of entities depending on the municipality, turn out rate in last municipal elections (Guillamón, Bastida,
& Benito, 2011).
The lack of homogeneity of slovenian municipalities was at that point a considerable challenge that required the development of an appropriate research approach.
Apparently, we considered the fact that slovenian municipalities include 11 urban municipalities, which differ significantly from the others by size and development. Therefore, the method described was used across the set of slovenian municipalities excluding the urban municipalities, whereas a short, qualitative analysis was carried out as a glance at the issues in the set of urban municipalities.
following the theories (agency, institutional and legitimacy), we put the attention on the differences between the groups of local communities exhibiting different behaviour.
Table 2 structure Of the data mOdel
data model factors
(muñoz & bolívar, 2015)
perspectives (ma & Wu, 2011)
groups of variables (sol, 2013) institutional institutional
Financial condition Financial condition Fiscal performance Fiscal variables Inter-government transfers Institutional and political
variables Political competition Political competition Strategic leadership
Environmental Environmental Size of municipality Size of municipality
Municipal wealth Development External demand Economic context
Income levels Resources and capacity
Social capital Socio-demographic
Environmental capital Source: own edited
Accordingly, we divided municipalities in two ways: based on their compliance with the regulations and regarding their fulfilment of all observed aspects of transparency.
The assumption was that by exploring the differences between the groups, the reasons for certain (undesirable and desirable) types of behaviour could be detected.
In order to examine the differences between the groups, we used a t-test for independent samples. Due to the large size of the examined dataset (201 municipalities), we could assume the usage of t-test as appropriate.
The interpretation of the results of t-test (difference between means) compared to the nonparametric Mann-Whitney test (sum of ranks) is also more informative. for nominal indicator variables, such as the gender of the mayor, we used a z-test for the comparison of proportions. We defined statistically significant differences between the groups at the significance level α=0.1.
RESEARCH RESULTS
The evaluation of budget transparency showed that the average index is relatively low, since it reached an average value of 3.4.
This is partly due to the delays in the process of adopting final accounts of local budgets and the fact that many municipalities report about the mid-year budget realisation in the form of news which is communicated to the municipal council by the mayor; however, the documents with this content are not available on the Internet. Municipalities have the lowest index regarding the 'citizens’
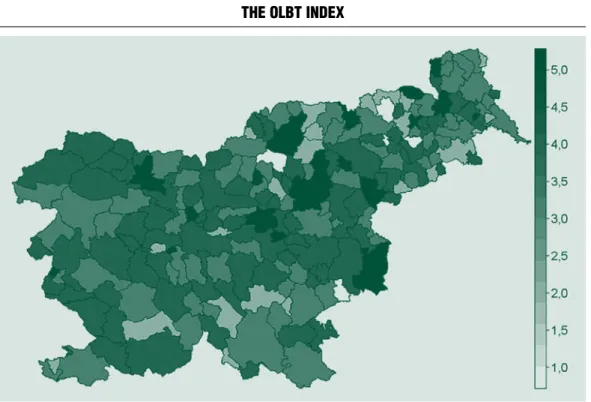
budget', since slovenia has not yet adopted the oEcD recommendations, i.e. 'a budget for the general public', which are supposed to promote a simplified explanation of the budget. Results by individual municipality are shown in Figure 1. It is interesting to note that
no municipality reached the index 0, which means that municipalities publish at least one document in connection with the budget on their websites.
As mentioned in the previous chapter, the second step of the research was the analysis of factors influencing different behaviour of municipalities in the provision of budget transparency. The population was the set of slovenian non-urban municipalities (201 of 212). We analysed two kinds of behaviour comparing groups of municipalities regarding noncompliance with regulations and regarding fulfilling all aspects of transparency.
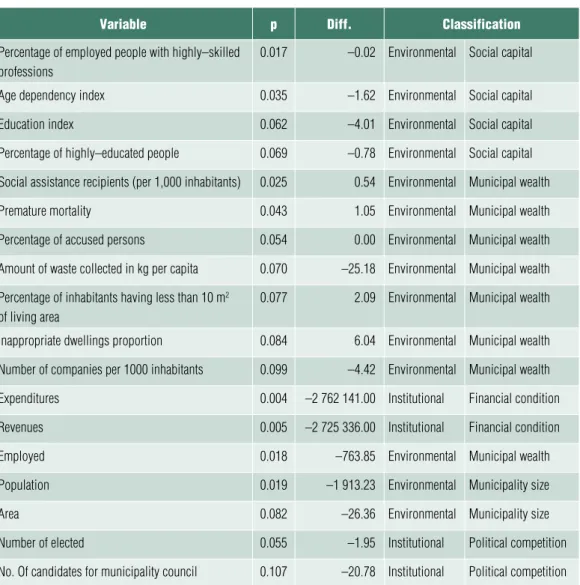
The results of the former analysis showed that 41 municipalities do not comply with the regulations on budget transparency and 160 municipalities publish budget documents in accordance with the regulations. on the basis of the established criterion, 18 variables that show differences between both groups of municipalities were drawn from the full set of variables, in accordance with the assumption that the significance of the t-test is p ≤ 0,1 (Table 3). Almost all of them were the environmental factors, forming three categories: the size of the municipality (5 variables), social capital (4 variables) and municipal wealth (7 variables). The two remaining variables expressing a certain level of statistical significance of the differences were of the political nature, but both were dependent on the population of a municipality (number of elected officials, number of candidates).
Based on the evidence, we could conclude that the compliance with regulations is driven by environmental factors which cover the socio-demographic and economic context. All the differences are in the favour of the group of municipalities which are at least compliant with regulations. We could therefore derive the picture of the characteristics of the municipalities not meeting the regulations requests. The municipalities that do not
ensure budget transparency in accordance with the regulations are of smaller size. A similar impact of the size and the volume of expenditure of municipalities was determined in other research (caamano-Alegre et al. 2011;
serrano-cinca et al. 2008; styles and Tennyson 2007; Hemeed, 2005). furthermore, these municipalities have a worse educational structure of employees and inhabitants. A similar impact of the educational structure of inhabitants was also determined in other research (Perez et al., 2008; Gandia
& Archidona, 2007; serrano-cinca et al., 2008). finally, their lower municipal wealth is expressed by
• the number of social assistance recipients per 1000 inhabitants and
• premature mortality (at the statistical significance level p ≤ 0,05) and
• the percentage of accused persons,
• amount of waste collected,
• percentage of inhabitants having less than 10 m2 of living area,
• percentage of inappropriate dwellings and
• number of companies per 1000 inhabitants (at the statistical significance level p ≤ 0,11).
A similar impact of poorer development on transparency is indirectly demonstrated in the research by Bastida & Benito (2007);
Laswad et al. (2005); Piotrowski & Van Ryzin (2007).
Besides that, a short correlation analysis showed that the size of municipalities (population) is in correlation with most of the above-mentioned variables (percentage of employed people with highly-skilled professions, premature mortality, percentage of
Figure 1 the Olbt index
Source: own edited
accused persons, education index, percentage of highly-educated people, amount of waste collected in kg per capita, percentage of inhabitants having less than 10 m2 of living area, and number of companies per 1000 inhabitants). Additionally, considering the three variables not being in correlation with the population (social assistance recipients
per 1,000 inhabitants, age dependency, and percentage of people with inappropriate dwellings), we could conclude that the group of the municipalities not being able to provide regulatory stipulated level of budget transparency consists of smaller municipalities, with a lower level of social capital and economic power and a worse socio-economic situation.
Table 3 differences in arithmetic means Of variables betWeen the grOups
Of municipalities – cOmpliance With the legislatiOn (nO/yes)
variable p diff. classification
Percentage of employed people with highly–skilled professions
0.017 –0.02 Environmental Social capital
Age dependency index 0.035 –1.62 Environmental Social capital
Education index 0.062 –4.01 Environmental Social capital
Percentage of highly–educated people 0.069 –0.78 Environmental Social capital Social assistance recipients (per 1,000 inhabitants) 0.025 0.54 Environmental Municipal wealth
Premature mortality 0.043 1.05 Environmental Municipal wealth
Percentage of accused persons 0.054 0.00 Environmental Municipal wealth Amount of waste collected in kg per capita 0.070 –25.18 Environmental Municipal wealth Percentage of inhabitants having less than 10 m2
of living area
0.077 2.09 Environmental Municipal wealth Inappropriate dwellings proportion 0.084 6.04 Environmental Municipal wealth Number of companies per 1000 inhabitants 0.099 –4.42 Environmental Municipal wealth
Expenditures 0.004 –2 762 141.00 Institutional Financial condition
Revenues 0.005 –2 725 336.00 Institutional Financial condition
Employed 0.018 –763.85 Environmental Municipal wealth
Population 0.019 –1 913.23 Environmental Municipality size
Area 0.082 –26.36 Environmental Municipality size
Number of elected 0.055 –1.95 Institutional Political competition
No. Of candidates for municipality council 0.107 –20.78 Institutional Political competition Source: own edited
The second comparison addressed the municipalities which ensure the publication of prescribed budget documents, i.e. the municipalities with the optimal behaviour model, which publish all the documents considered, and the municipalities which do not publish one or both additional documents (Table 1, 3 – Mid-year report on the implementation of the budget or 5 – citizens’
budget). using the same threshold p ≤ 0,1 (Table 4) we extracted four institutional and eight environmental factors. Two institutional factors belonged to the political competition category and two others to the category of financial condition. The environmental factors include a slightly more coloured set of categories with four variables for municipal wealth, two variables for municipality size, and a single variable for two of the other categories (environmental capital and social capital). Results points out variables similar as in other studies, since municipalities giving full budget transparency had male mayors, mayors not replaced at last elections, a higher share of wages and material costs in total expenditure and lower expenditures per capita (ie. Esteves de Araujo & Tejedo-Romero, 2016; Alesina, Troiano & cassidy, 2015; Lee, Moretti & Butler, 2004; ferreira & Gyourko, 2009 and 2014). Environmental factors had lower values of municipal wealth factors (gross added value per employee, average net wage, local economic investment) except of a percentage of habitants with a small living area. The municipalities from this group cover a smaller area and are more densely populated.
Besides of that, they have a smaller proportion of Natural 2000 areas and worse age structure change trend. We expected that the analysis of differences between groups would produce results along with the theoretical premises as it was in the case of the former comparison.
on the contrary, we revealed that the characteristics of municipalities giving full
budget transparency did not experience theoretically-expected incentives.
The established facts apply also to 11 urban municipalities, of which 2 do not cover the legal requirements for transparency, and 9 comply with the legislation, i.e. they publish an additional mid-year report; 2 of these also provide a complete set of budget transparency elements. Both phenomena discussed above are also expressed in urban municipalities in a similar way, as in the set of non-urban municipalities. Both municipalities which do not ensure the publication of prescribed documents are located in the north-east of slovenia, and both are characterised by difficult economic and social situations. The municipalities which publish the complete set of documents considered are smaller and economically weaker, as is the case in non- urban municipalities.
CONCLUSION
As mentioned above, we analysed the differences for two pairs of groups of municipalities for institutional (financial condition, intergovernmental subsidies, and political competition) and environmental factors (municipal size, income level and municipal wealth) of fiscal transparency.
Along with agency and legitimacy theory, we expected to find differences in at least some variables in each category. However, like several other researchers, we were not able to confirm all theoretical expectations. Moreover, in the case of municipalities providing full budget transparency, the results were just opposite as expected.
The evidence of the comparison between municipalities which did and did not comply with regulation revealed that institutional factors have no influence on budget transparency. so we could conclude that for
this case the agency theory is not applicable.
Notwithstanding, we could employ legitimacy theory claiming that the incumbents of bigger and more developed municipalities tend to fulfil the expectations of the stakeholders.
furthermore, the municipalities not satisfying regulations probably have too few resources or are, because of other challenges, less focused on fiscal information disclosure.
The comparison between the municipalities giving full budget transparency and other municipalities satisfying regulations brought just the opposite results (Table 4). Both
institutional and environmental variables had (excepting percentage of habitants with small living area), opposite values than expected. In our literature research, we did not found evidence like that; however, the phenomenon could be somehow explained by agency and legitimacy theory. Namely, we asked the question, 'what are the factors that made the municipality to disclose budget information voluntarily?' This meant that agents in less wealthy municipalities put additional effort to make the information more visible to the principal. Transparency Table 4 differences in arithmetic means Of variables betWeen the grOups
Of municipalities – all dOcuments published (nO/yes)
variable p diff. classification
Unemployment change 0.108 0.846 Environmental Municipal wealth
Proportion of natura 2000 area 0.005 15.740 Environmental Environmental capital
Age structure change 0.017 –0.028 Environmental Social capital
Gross added value per employee 0.002 4009.000 Environmental Municipal wealth
Average net wage 0.037 36.650 Environmental Municipal wealth
Local economy investment 0.063 455.070 Environmental Municipal wealth
Average gross wage 0.069 57.150 Environmental Municipal wealth
Percentage of inhabitants having less than 10m2
of living area 0.069 1.760 Environmental Municipal wealth
Density 0.008 –49.920 Environmental Municipality size
Area 0.046 41.320 Environmental Municipality size
Share of wages and material costs in total
expenditure 0.055 –1.590 Institutional Financial condition
Net current expenditures per capita 0.109 36.180 Institutional Financial condition
Mayor gender 0.000 0.094 Institutional Political competition
Replacement of the mayor 0.032 0.190 Institutional Political competition
Source: own edited
increases the degree of confidence and public trust in political actors (Laswad et al., 2005). Also, an increased level of transparency in government decision-making and activities reinforces the likelihood of democracy and citizen involvement (Esteves de Araujo & Tejedo-Romero, 2016), which probably could leverage the development of municipalities. Additionally, as information disclosure is a way to legitimate actions to
their stakeholders (Archel et al., 2009) the incumbents of less successful municipalities tend to gain the confidence of citizens, regain the confidence of citizens and change their perceptions of the organizations.
since these municipalities provide the citizens with comprehensive information, this phenomenon could also be named 'focus on citizens', which is additional aspect, which is not researched in that case.
Appendix
Table 5 all 91 variables used in the analysis With their units Of measure
and sOurce Where they Were Obtained
variable units of measure class source
Old municipality Dummy variable: 1 – established in 1991, 0 – established after 1991
CV SORS
Cohesion region Cohesion region: 1 – east slovenia, 2 – west slovenia
CV SORS
Statistical region One of 12 statistical regions in slovenia CV SORS
Revenues 2015 EUR FC MF
Expenditures 2015 EUR FC MF
Deficit/suficit 2015 EUR FC MF
The share of wages and material costs in total expenditure
Percentage FC MF
The share of government assistance in the budgets of cities
Percentage FC MF
Budget and efficiency index – aggregated indicator from variables with annotation
Index FC GS
Eu funds obtained EUR FC GS
Growth of non-transferable and durable revenues Percentage FC GS
Indebtedness EUR FC GS
Debt growth EUR FC GS
Net current expenditure (eff) EUR FC GS
variable units of measure class source Increase of expenditure for public administration
(eff)
Percentage FC GS
Investments (eff) EUR FC GS
Financial autonomy of municipalities Index FC GS
Self-sufficiency index – aggregated indicator from variables with annotation
Index FC GS
Environment index – aggregated indicator from variables with annotation
Index EC GS
Replacement of the mayor at last elections Dummy variable: 1 – new mayor, 0 – old mayor
PC SEC
Number of candidates for municipality council Number PC SEC
Number of elected Number PC SEC
Proportion of elected candidates Percentage PC SEC
Number of political parties with representation in local legislative body
Number PC SEC
Mayor gender Binary variable: 1 – male, 2 – female PC SEC
Political party of mayor Binary variable: 0 – local party, 1 – national party
PC SEC
Mandate Number PC SEC
% of voters for elected mayor Percentage PC SEC
Mayor wage EUR PC MF
Area Km2 MS SORS
Population Number MS SORS
Density People per km2 MS SORS
Number of settlements Number MS SORS
Average income per capita EUR MW SORS
Employed Number MW SORS
Unemployment rate Percentage MW SORS
Average gross wage EUR MW SORS
Net migration between municipalities Index MW SORS
Net migration Per 1000 inhabitants MW GS
Economy index – aggregated indicator from variables with annotation
Index MW GS
Promotion of a small economy EUR MW GS
variable units of measure class source
Added value EUR per inhabitant MW GS
Gross investment in the economy EUR per inhabitant MW GS
Number of companies Number per 1000 inhabitants MW GS
Change in the number of companies Number per 1000 inhabitants MW GS
New businesses Number per 1000 inhabitants MW GS
Revenue growth Percentage MW GS
Labour market index – aggregated indicator from variables with annotation
Index MW GS
Funds for an active employment policy per capita (lm)
EUR per inhabitant MW GS
The share of persons in employment Percentage MW GS
Number of jobs in the municipality Per 1000 inhabitants MW GS
Job structure – percentage of highly qualified jobs Percentage MW GS
Change in the number of posts Percentage MW GS
Movement of unemployment Percentage MW GS
Living standard index – aggregated indicator from variables with annotation
Index MW GS
Budget expenditure on culture EUR per inhabitant MW GS
Budgetary expenditure on sport EUR per inhabitant MW GS
Net wages EUR MW GS
Average gross receipts EUR MW GS
The share of the population living on less than 10 m2 of residential area
Per 1000 inhabitants MW GS
Recipients of social assistance Per 1000 inhabitants MW GS
Share of inhabited dwellings that do not have all the elements of basic infrastructure
Per 1000 inhabitants MW GS
Premature mortality Per 1000 inhabitants MW GS
Change in average gross earnings Percentage MW GS
New connections to the sewage system Per 1000 inhabitants MW GS
Social cohesion and political culture index – aggregated indicator from variables with annotation
Index MW GS
Budgetary expenditure on international cooperation EUR per inhabitant MW GS
Percentage of highly educated people Percentage SC SORS
Percentage of people older than 65 Percentage SC SORS
variable units of measure class source
Percentage of accused persons Percentage SC SORS
Voters turnout in the last local elections Percentage SC SEC
Demography index Index SC GS
Aging index – aggregated indicator from variables with annotation
Index SC GS
Age dependency coefficient Ratio SC GS
Change in the number of inhabitants Percentage SC GS
Change in age structure Percentage SC GS
Education index – aggregated indicator from variables with annotation
Index SC GS
Municipal grants EUR per 1000 inhabitants SC GS
Educational structure – percentage of highly educated people
Percentage SC GS
Share of graduates Per 1000 inhabitants SC GS
Share of new doctors and masters of science Per 1000 inhabitants SC GS
Change in educational structure Percentage points SC GS
Turnout Percentage SC GS
Convicted criminals Per 1000 inhabitants SC GS
The share of long-term unemployed population Percentage SC GS
Environmental protection expenditure EUR per inhabitant EC GS
Expenditure on the promotion of efficient energy use EUR per inhabitant EC GS
Waste Kg per inhabitant EC GS
Natura 2000 Percentage EC GS
Increase in the amount of waste Percentage EC GS
Final index Index EC GS
Remarks: Class: CV – Control Variable, FC – Financial Condition, PC – Political competition, MS – Municipal Size, MW – Municipal Wealth, SC – Social Capital, EC – Environmental Capital; Sources:
Source: SORS – Statistical Office of Republic of Slovenia, MF – Ministry of Finance, SEC – State Election Commission, GS – Golden Stone
Notes
1 This work has been supported by croatian science foundation under the project (IP-2014-09-3008) and by slovenian Research Agency under the project (ID P5-0093).
2 They found a positive impact of debt on their first partial transaprency index.
Albalate del sol (2013). The institutional, economic and social determinants of local government transparency. Journal of Economic Policy Reform. 16 (1), pp. 90-107,
https://doi.org/10.1080/17487870.2012.759422 Alcaide-Muñoz, L., Rodríguez-Bolívar, M.
P. (2015). Determing factors of Transparency and Accountability in Local Governments: A Meta- Analytic study. Lex Localis. 13(2), pp. 129-160.
https://doi.org/10.4335/13.2.129-160 (2015) Alesina, A., Perotti, R. (1996). fiscal Discipline and the Budget Process. The American Economic Review. 86(2), pp. 401-407
Alesina, A., Hausmannb, R., Hommesc, R., steinb, E. (1999). Budget institutions and fiscal performance in Latin America. Journal of Development Economies. 59(2), pp. 253-273, https://doi.org/10.1016/s0304-3878(99)00012-7
Alesina, A. f., Troiano, u., cassidy, T. (2015).
Old and Young Politicians (No. w20977). National Bureau of Economic Research,
https://doi.org/10.3386/w20977
Alt, J. E., Lassen, D. D., skilling, D. (2001).
fiscal transparency, gubernatorial popularity, and the scale of government: evidence from the states.
EPRu Working Paper 2001-16, university of copenhagen,
https://doi.org/10.1177/153244000200200302 Alt, J. E., Lassen, D. D., Rose, s. (2006). The causes of fiscal Transparency: Evidence from the American states. EPRu Working Paper series, 06- 02, http://www.econ.ku.dk/eprn_epru/Workings_
Papers/wp-06-02.pdf
Alt, J. E., Lowry, R. c. (2010). Transparency and Accountability: Empirical Results for us states.
Journal of Theoretical Politics. 22(4), pp. 379-406, https://doi.org/10.1177/0951629810375641
Archel, P., Husillos, J., Larrinaga, c., spence, c. (2009). social disclosure, legitimacy theory and the role of the state. Accounting, Auditing
& Accountability Journal. 22(8), pp. 1284–1307, https://doi.org/10.1108/09513570910999319
Barro, R. (1973). The control of Politicians.
An Economic Model. Public Choice. 14, pp. 19–42.
https://doi.org/10.1007/bf01718440
Bastida, f., Benito, B. (2007). central Government Budget Practices and Transparency: An International comparison. Public Administration, 85(3), 667-716,
https://doi.org/10.1111/j.1467-9299.2007.00664.x Beales, J., Thompson, M. W. (2010).
Government transparency in Virginia: How localities compare. The Thomas Jefferson Institute for Public Policy. http://www.thomasjeffersoninst.
org/pdf/articles/Govt_Transparency_LocalGov.pdf Bolívar, M. P. R., Pérez, M. del c. c., López-Hernández, A. M. (2013). online Budget Transparency in oEcD Member countries and Administrative culture. Administration & Society, 95399713509238.
http://doi.org/10.1177/0095399713509238 Bolívar, M. P. R., Muñoz, L. A., Hernández, A. M. L. (2013). Determinants of financial Transparency in Government. International Public Management Journal. 16(4), pp. 557-602,
https://doi.org/10.1080/10967494.2013.849169 Boubeta, A. s., santias, f. R., Alegre, J. c. (2010). Budget Transparency in Local Government: Empirical Analysis on a sample of 33 Galician Municipalities. http://www.um.es/dp- References
hacienda/eep2010/comunicaciones/eep2010-65.pdf https://doi.org/10.1080/03003930.2012.693075
caamaño-Allegre, J. et al. (2011). Budget Transparency in Local Governments: An Empirical Analysis. Atlanta: Georgia state university – Andres Young school of Policy studies.
https://doi.org/10.2139/ssrn.1768091
caamaño-Alegre, J., Lago-Peñas, s., Reyes- santias, s., santiago-Boubeta, A. (2013). Budget Transparency in Local Governments: An Empirical Analysis. Local Government Studies. 39(2), pp. 182-207, https://doi.org/10.1080/03003930.2012.693075
Esteller-Moré, A., – otero, J. P. (2012). fiscal transparency: (why) does your local government respond? Public Management Review. 14(8).
https://doi.org/10.1080/14719037.2012.657839 Esteves de Araujo, J. f. f., Tejedo-Romero, f. (2016). Local government transparency index: determinants of municipalities’ rankings.
International Journal of Public Sector Management.
29(4), pp. 327-347,
https://doi.org/10.1108/ijpsm-11-2015-0199 fama, E. f. (1980). Agency Problems and the Theory of the firm. Journal of Political Economy.
88(2), pp. 288-307. https://doi.org/10.1086/260866 ferejohn, J. (1986). Incumbent Performance and Electoral control. Public Choice. 50, pp. 5-25, https://doi.org/10.1007/bf00124924
ferejohn, J. (1999). Accountability and Authority:
Toward a Theory of Political Accountability. In A. Przeworski, s. c. stokes, – B. Manin (eds.), Democracy, Accountability, and Representation.
Cambridge University Press, pp. 131-153,
https://doi.org/10.1017/cBo9781139175104.005 ferreira, f., Gyourko, J. (2009). Do Political Parties Matter? Evidence from us cities. The
Quarterly Journal of Economics. 124(1), pp. 399-422, https://doi.org/10.3386/w13535
ferreira, f., Gyourko, J. (2014). Does gender matter for political leadership? The case of us mayors. Journal of Public Economics. 112, pp. 24-39, https://doi.org/10.1016/j.jpubeco.2014.01.006
De fine Licht, J., Naurin, D., Esaiasson, P., Gilljam, M. (2011). Does transparency generate legitimacy? An experimental study of procedure acceptance of open and closed-door decision-making, working paper, The Quality of Government Institute, university of Gothenburg, GothenburgDe Mello, L. R. (2004). can fiscal Decentralization strengthen social capital? Public finance Review. 32(1), pp. 4-35,
https://doi.org/10.1177/1091142103260699 fox, R. L., schuhmann, R. A. (1999). Gender and Local Government: A comparison of Women and Men city Managers. Public Administration Review. 59(3), pp. 231-242,
https://doi.org/10.2307/3109951
fung, A. (2013). Infotopia. Politics & Society.
41(2), pp. 183-212,
https://doi.org/10.1177/0032329213483107 Gandia, J. L., Archidona, M. c. (2007).
Determinants of web site information by spanish city councils. Online Information Review. 32(1), pp. 36-57
Gandía, J. L., Archidona, M. c. (2008).
Determinants of web site information by spanish city councils. Online Information Review. 32(1), pp. 35- 57, https://doi.org/10.1108/14684520810865976
García, A. c., García-García, J. (2010).
Determinants of online Reporting of Accounting Information by spanish Local Government Authorities. Local Government Studies. 36(5), pp.
679-695,
https://doi.org/10.1080/03003930.2010.506980
Gerunov, A. (2016). financial Effects of fiscal Transparency: A critique. Bulgarian Economic papers. 2016(1). 19 p. http://www.bep.bg/p/papers.
html.
Giroux, G., McLelland, A. J. (2003).
Governance structures and Accounting at Large Municipalities. Journal of Accounting and Public Policy. 22(3), pp 203-230,
https://doi.org/10.1016/s0278-4254(03)00020-6 Guillamón, M.-D., Bastida, f., Benito, B.
(2011). The Determinants of Local Government’s financial Transparency. Local Government Studies.
37(4), pp 391-406,
https://doi.org/10.1080/03003930.2011.588704 Hameed, f. (2005). fiscal Transparency and Economic outcomes. IMf Working Paper, 225, http://www.imf.org/external/pubs/ft/wp/2005/
wp05225.pdf
https://doi.org/10.5089/9781451862447.001 Heald, D. (2006). Varieties of transparency. In Hood, c., Heald, D. (eds), Transparency: The Key to Better Governance?, Oxford University Press, oxford, pp. 25-43,
https://doi.org/10.5871/bacad/9780197263839.003.0002 Heeks, R. (2005). E-Government as a carrier of context. Journal o f Public Policy. 25 (1), pp. 51-74, https://doi.org/10.1017/s0143814x05000206
Heyndels, B., smolders, c. (1994). source fiscal illusion at the local level: empirical evidence for the flemish municipalities, Public Choice.
80(3/4), pp. 325-338,
https://doi.org/10.1007/bf01053224
Jarmuzek, M., Polgar, E. K., Matousek, R.
– Hölscher, J. (2009). fiscal Transparency in Transition Economics. Studies and Analyses (328).
online: http://www.case-research.eu/upload/
publikacja_plik/11096266_sa328.pdf
Jensen, M., W. Meckling (1976). Theory of the firm: Manageral Behaviour, Agency costs and ownership structure. Journal of Financial Economics.
3, pp. 305-360,
https://doi.org/10.1016/0304-405x(76)90026-x Jordan, M. M., Yusuf, J.-E., Berman, M., Gilchrist, c. (2017). Popular financial Reports as fiscal Transparency Mechanisms: An Assessment using the fiscal Transparency Index for the citizen user. International Journal of Public Administration.
40(8), pp 625-636,
https://doi.org/10.1080/01900692.2016.1186175 Kopits, G., craig, J., (1998). Transparency in government operations. IMF Occasional Papers, 158.
Washington, Dc: International Monetary fund.
https://doi.org/10.5089/9781557756978.084 Kraemer, K., King, J. L. (2006). Information Technology and Administrative Reform: Will e-Government be different? International Journal of Electronic Government Research. 2(1), pp. 1-20, https://doi.org/10.4018/jegr.2006010101
Kroth, V. (2012). subnational Budget Transparency: An Analysis of Ten Pilot studies.
http://internationalbudget.org/wp-content/uploads/
subnational-synthesis-Paper_final.pdf
Laswad, f., fisher, R., oyelere, P. (2005).
Determinants of voluntary Internet financial reporting by local government authorities. Journal of Accounting and Public Policy. 24, pp. 101-121, https://doi.org/10.1016/j.jaccpubpol.2004.12.006
Lawson, A., Alvarez, G. (2013). International Budget Partnership: synthesis Report on the piloting of the subnational open Budget survey in Brazil, Indonesia and Tanzania. final Report submitted by fIscus Public finance consultants, uK for the International Budget Partnership. http://internationalbudget.org/
wp-content/uploads/IBP-synthesis-Report-on-sN- oBs-Pilot-surveysfinal020714.pdf
Lee, D. s., Moretti, E., Butler, M. J. (2004).
Do voters affect or elect policies? Evidence from the us House. The Quarterly Journal of Economics.
119(4), pp. 807-859,
https://doi.org/10.1162/0033553041502153 Ma, L., Wu, J. (2011). What Drives fiscal Transparency? Evidence from Provincial Governments in china (ssRN scholarly Paper No.
ID 1807767). Rochester, NY: social science Research Network. https://papers.ssrn.com/abstract=
1807767,
https://doi.org/10.2139/ssrn.1807767
De Mello, L. R. (2004). can fiscal Decentralization strengthen social capital? Public Finance Review, 32(1), pp. 4-35,
https://doi.org/10.1177/1091142103260699 Meyer, J. W. , B. Rowan. (1977). Institutionalized organizations: formal structure as Myth and ceremony. American Journal of Sociology. 83(2), pp.
340-363,
https://doi.org/10.1086/226550
Muñoz, L. A., Bolívar, M. P. R. (2015).
Determining factors of Transparency and Accountability in Local Governments: A Meta- Analytic study. Lex Localis – Journal of Local Self- Government. 13(2), pp. 129-160.
https://doi.org/10.4335/13.2.129-160(2015) oates, W. E. (1991). on the nature and measurement of fiscal illusion: a survey. In: W.
E. oates (ed.) Studies in Fiscal Federalism. pp.
431-448,
ott, K. – Bronić, M. – Petrušić, M. (2014).
Budget transparency of croatian counties, cities and municipalities in 2013/2014, Newsletter, 87.
https://doi.org/10.3326/nle.2014.87
Peisakhin, L., Pinto, P. (2010). Is transparency an effective anti-corruption strategy? Evidence from
a field experiment in India. Regulation & Governance.
4(3), pp. 261-280,
https://doi.org/10.1111/j.1748-5991.2010.01081.x Perez, c. c., Rodriguez Bolivar, M. P., Lopez- Hernandez, A. M. (2008). e-Government Process and Incentives for online Public financial Information.
online Information Review. 32(3), pp. 379-400.
https://doi.org/10.1108/14684520810889682 Pina, V., Torres, L., Royo, s. (2010). Is E-Government Promoting convergence Towards More Accountable Local Governments? International Public Management Journal. 13(4), pp. 350-380, https://doi.org/10.1080/10967494.2010.524834
Pintea, M.-o., Achim, s. A., Lacătuş, V. (2013).
Transparency of local budgets in the Nord-West Region of Romania. The Annals of the university of oradea. Economic Sciences. 1, pp. 931-941, http://
steconomiceuoradea.ro/anale/volume/2013/n1/098.pdf Pintea, M.-o. (2014). Transparency of local budgets in the center Region of Romania. Review of Economic Studies and Research Virgil, Madgearu.
pp. 81-96
Piotrowski, s. J., – Van Ryzin, G. G. (2007).
citizen Attitudes Toward Transparency in Local Government. The American Review of Public Administration. 37(3), pp. 306-323,
https://doi.org/10.1177/0275074006296777 Powell, W. W., P. J. DiMaggio, eds. (1991).
The New Institutionalism in Organizational Analysis.
university of chicago Press. chicago.
https://doi.org/10.7208/chicago/9780226185941.001.0001 Rodríguez-Bolívar, M. P., Alcaide- Muñoz, L., López Hernández, A. M. (2013).
Determinants of financial Transparency in Local Government. International Public Management Journal. 16(4, pp. 557-602,
https://doi.org/10.1080/10967494.2013.849169
scott, W. R. (1987). The Adolescence of Institutional Theory. Administrative Science Quarterly. 32(4), pp. 493-511,
https://doi.org/10.2307/2392880
sedmihradská, L. (2015). Budget Transparency in czech Local Government. Procedia Economics and Finance. 25, pp. 598-606,
https://doi.org/10.1016/s2212-5671(15)00774-1 sedmihradská, L., Haas, J. (2013). Budget Transparency and fiscal Performance: Do open Budgets Matter? AcTA VŠfs. 7(2), pp., 109- 122
serrano-cinca, c., Rueda-Tomas, M., Portillo-Tarragona, P. (2008). factors Influencing E-disclosure in Local Public Administrations.
Documento de Trabajo 2008-03. facultad de ciencias Economicas y Empresarialed: universidad de Zaragoza. (22 January 2017). http://www.
dteconz.unizar.es/DT2008-03.pdf
sol, D. A. del. (2013). The institutional, economic and social determinants of local government transparency. Journal of Economic Policy Reform. 16(1), pp. 90-107,
https://doi.org/10.1080/17487870.2012.759422 styles, A., Tennyson, M. (2007). The Accessibility of financial Reporting of u.s. Municipalities on the Internet. Journal of Public Budgeting, Accounting &
Financial Management. 19(1), pp. 56-92, https://doi.org/10.1108/jpbafm-19-01-2007-b003
suchman, M. c. (1995). Managing Legitimacy:
strategic and Institutional Approaches. Academy of Management Review. 20(3), pp. 571-610.
https://doi.org/10.5465/amr.1995.9508080331 Tekeng, Y. M. T., sharaf, M. f. (2015). fiscal Transparency, Measurement and Determinants:
Evidence from 27 Developing countries. Journal
of Economics and Political Economy. 2(1), pp.
69-91
Weber, M. (1978). The types of Legitimate Domination. In G. Roth and c. Wittich, (eds.) Economy and society. Berkeley: University of California Press, pp. 212-254
Wehner, J., De Renzio, P. (2013). citizens, Legislators, and Executive Disclosure: The Political Determinants of fiscal Transparency. World Development. 41, pp. 96-108,
https://doi.org/10.1016/j.worlddev.2012.06.005 Določitev koeficientov razvitosti občin. (n.d.).
Retrieved february 23, 2017, from http://www.
mf.gov.si/si/delovna_podrocja/lokalne_skupnosti/
izracuni/dolocitev_koeficientov_razvitosti_obcin/
za_leti_2016_in_2017/
IBP (2013). subnational open Budget survey Metodology. http://internationalbudget.org/wp- content/uploads/sN-oBs_Methodology_final 020514.pdf
IMf (2007). Manual on fiscal transparency (2007).
Washington Dc: International Monetary fund. http://
www.imf.org/external/np/pp/2007/eng/101907m.pdf [Accessed 10 June 2017].
IMf (2014). The fiscal Transparency code.
http://blog-pfm.imf.org/files/ft-code.pdf
PEfA framework. https://pefa.org/content/pefa- framework
oEcD (2001). oEcD best practices for budget transparency. Paris: oEcD. http://www.oecd.org/
dataoecd/33/13/1905258.pdf
Transparency of Local Budgets in the North-West Region of Romania. (2013). Annals of faculty of Economics. (1), pp. 931