and municipalities in Serbia
TAMÁS BAKÓ1, SZILÁRD RÁCZ2
Abstract: In the period of socialism (until 1990), municipalities owned larger amounts of funds, more jobs and responsibilities were entrusted to them, and a higher degree of inter- municipal cooperation was achieved. Public service and services were more accessible to citizens.
The turning point in the development of cities and municipalities in Serbia was the period between 1990–2000. During this decade, a strong centralization of the authorities, taking over the competencies of the municipalities and transferring them to the city and state levels were carried out. In this way, cities and municipalities lost their role and the character they had built in the socialist era. We can conclude that in the 21st century, through the activities of city authorities and public companies, a high degree of centralization and state management of cities and municipalities is achieved. Most of the work at the municipal and city level is done by the public sector.
There is a lack of cooperation and dialogue between the institutional and non- institutional environments. This means that the dialogue between city government and citizens is on low level. In the period of socialism, industrial zones and green spaces were envisaged and represented much more by urban plans. Since 2000, with the aim of stimulating business and urban development, more and more areas have been earmarked for the construction of business premises and shopping centers.
Key words: Serbia, cities, municipalities, governance
1. Introduction – Characteristics of cities and municipalities in Serbia The socialist cities as the predecessors of modern cities. During the socialist system great attention was paid to state property and social collectivity. There was a general belief that the individual was a part of society that the state should help.
According to the viewpoint of socialism, the development of cities requires the formation of cities in order to develop and further develop society (Hirt, 2012).
This ideological reason actually facilitated the start of the urbanization process in Yugoslavia and its rapid implementation (migration from village to city). Great attention was paid to the process of urban planning, which was considered part of
1 TAMÁS BAKÓ, Széchenyi István University, Hungary TBako@mfa.gov.hu
2 SZILÁRD RÁCZ, Institute for Regional Studies; Bolyai+ Scholar, Széchenyi István University, Hungary, szracz@rkk.hu
the mechanism for optimal decisions. Urban planning, due to its awareness of collectivity, was an integral part of urban development (Enyedi, 1978).
The following political-institutional and economic factors, which characterize the state system, contributed to the formation of a unified structure of socialist cities (French, Hamilton, 1979): (1) extensive industrialization to develop the economy, industrial development was a priority; (2) under-urbanization (Konrád, Szelényi, 1971) lower growth rates and less territorial concentration of the urban population, lagging behind in terms of infrastructure development compared to capitalist cities. The socialist cities of Yugoslavia, including Serbia, were characterized by a slow increase in the urban population relative to industrial production. Under-urbanization was most characteristic of the early stages of the development of socialist cities.
The building area and communal infrastructure are state property, state monopoly. Following the land nationalization the land became social property, and due this the new legal status, it was fully controlled by the state. Maintenance and development of communal infrastructure was the responsibility of public companies (as if they were natural monopolies). It is important to mention that until 1990 these tasks were essentially the responsibility of the municipalities.
Strong state control of financial resources and development funds of the cities.
Through the establishment of development funds, the cities obtained significant financial resources, which have mostly been used for infrastructure development and housing construction. Decision-making on the distribution of money to cities and municipalities was reviewed on the state level.
Central housing policy was also under centralized control and it resulted a specific procedure. According to Yugoslav socialism, the state must provide housing space for all residents (state egalitarianism). Housing funds existed for this purpose, but they were not able to provide everyone with this opportunity, so other, not economic criteria were used for the allocation of housing.
Table 1 shows the development history of Serbian cities and municipalities.
Until 1990, most of the activities took place at the municipal level, since 2000, cities have been prioritized.
It is important that municipalities hade the greatest power during socialism.
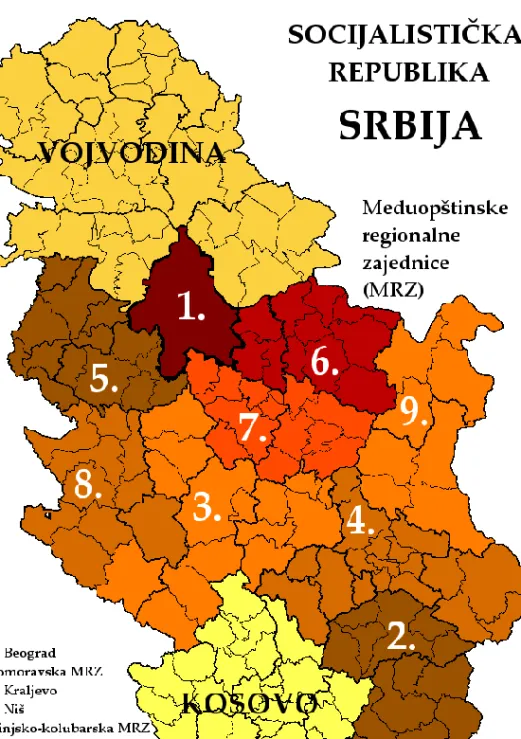
Their decision-making power and influence have been enforced by the regional municipal communities. Figure 1 presents the map of regional municipal commu- nities. The decision to establish the municipal communities was an important step towards decentralization, increasing the powers of local governments and reducing the impact of the central government. These changes were contrary to traditional socialism in Eastern Europe.
During socialism, municipalities and cities (in various forms) had greater budgetary autonomy than they do today. The municipalities as a social-political
communities were set up to carry out independently the tasks within the compe- tence of the republic. Cities and municipalities have greater financial resources and sets of resources.
The transfer of powers to the municipal level was the result of the socialist principle of bringing citizens closer to the decision-making process in the interest of activities useful to society (the only socialist country where this type of self- government was realized). During socialism, cities and municipalities were very important elements of the national development strategy.
Table 1. History of the development of cities and municipalities in Serbia
Period Administrative division
1943–1975
After the Second World War, the districts and larger districts were phased out.
Several cities and villages were part of one larger district. The municipalities were established and their area expanded over time.
1975–1990
Municipalities are grouped into regional municipal communities. In the territory of the Socialist Republic of Serbia existed 8 regional municipal communities.
The territory of Autonomous Province of Vojvodina, the Autonomous Province of Kosovo and the city of Belgrade were exceptions (several independent municipalities remained within the autonomous provinces).
1980–1989 In the city of Belgrade, of Novi Sad and Pristina a community of municipalities was established. This is the first form of association at city level.
1990–2000
Regional municipal communities have ceased to exist and many smaller municipalities have been established. In Novi Sad the community of the municipalities was dissolved and the Novi Sad municipality was formed.
2000–2019
Cities were formed as a result of the reorganization of institutions and the enforcement of laws. In 2008, a decision was taken to adopt the Statute of the city throughout Serbia. As a result of this measure, it was possible to establish cities and their urban municipalities. As of 2017, Serbian cities have begun to introduce new Statutes to strengthen local governments.
Source: Own compilation3.
3 Based on the following: Constitutional Law on the Abolition of Districts/Ustavni zakon o ukidanju srezova, 1966.; Law on Amendments to the Law on Education of Municipalities in SR Serbia, 1967/Zakon o izmenama i dopunama zakona o obrazovanju opština u SR Srbiji iz 1967;
Constitution of the Socialist Republic of Serbia, 1974/Ustav Socijalističke Republike Srbije 1974;
Supplement and amendment to the 1980 Act on the Definition of the Territory of Local Governments/Zakon o izmenama i dopunama Zakona o utvrđivanju teritorija opština iz 1980;
Law on Territorial Organization of the Republic of Serbia 1991/Zakon o teritorijalnoj organizaciji Republike Srbije iz 1991; Law on Territorial Organization of the Republic of Serbia 2007/Zakon o teritorijalnoj organizaciji Republike Srbije iz 2007; Statut of the City 2008/Statut grada iz 2008.
Figure 1. Regional municipal communities in Serbia 1974–1990 Source: Federal Institute for Statistics of the SFRY.
For the regional development of the state (SFRJ) has established two funds (Radulović, 2013)
Federal Finance Fund for lending to the faster development of economically underdeveloped republics and regions/Fond federacije za kreditiranje bržeg razvoja privredno nedovoljno razvijenih republika i regiona/Founded in 1965 and at the federal state level, it was a major source of funding for faster regional development. Assets earmarked by the central government for a period of 5 years were included in the Fund (the full amount came from domestic sources). The following table shows the distribution of these assets.
Table 2. Distribution of Federal Financial Fund assets by area, %
Period Bosnia and
Herzegovina
Montenegro Macedonia Kosovo
1966–1970 30.7 13.1 26.2 39.0
1971–1975 32.4 11.4 22.9 33.3
1976–1980 30.6 10.8 31.6 37.0
1981–1985 26.4 9.2 20.9 43.6
1986–1987 29.3 9.1 16.9 44.7
1988–1990 24.6 6.2 16.9 52.3
Source: Radulović, 2013.
There was also a fund for financing the increase of employment in economically underdeveloped and highly emigrated areas/Fond za finansiranje povećanja zaposlenosti u privredno nedovoljno razvijenim i izrazito emigracionim područjima. The fund was set up in 1978 to increase employment and, due to the financial difficulties of Yugoslavia in the late 1970s, was financed exclusively from foreign loans and non-repayable assets. It was set up in 1978 to increase employment and, due to the financial difficulties of Yugoslavia in the late 1970s, was financed exclusively from foreign loans and non-repayable assets.
This fund was used to finance programs in the form of loans at local level.
Within the framework of the demographic and economic development of the socialist cities, the aim was to form them as strategic centers of industrial development and regional administration (Hamilton, 1979). In line with the principles of egalitarianism and collectivism, due to accelerated urbanization, the cities have been expanding at a faster rate than planned.
It can be stated that in the second half of the 20th century the Yugoslav socialist municipalities were overwhelmingly suited to the tasks of the municipalities, but today the Serbian municipalities mostly have only an advisory role.
The role of municipalities has gradually declined over the last three decades.
Local governments had the greatest autonomy and decision-making power during the period of socialism (until 1990).
Between 1990 and 2000, political and economic insecurity in Yugoslavia and then in Serbia resulted in the strengthening of centralism and the suppression of the role of municipalities. From 2000 to the present, as the city emerged, the situation of municipalities continued to deteriorate as fortified cities became centers of power and command/political influence. In parallel with the process of the formation of cities from 2000 to the present day, the position of the municipalities deteriorated, because the cities strengthened, and became the centers of power and command/political influence.
The perception of the successful functioning of the socialist cities continues to this day, which is also supported by the fact that the inhabitants of Belgrade consider that the socialist system has provided the population with a particular welfare (Zepeda et al., 2017).
Table 3. Territory and population of the five largest cities in Serbia Cities in
Serbia
Number of inhabitants Territory, (km2)
Population /km2
Growth rate (%) 1991 2002 2011 2018 2018 2018 1991–2002 2002–2018 Belgrade 1,602,226 1,576,124 1,659,440 1,690,193 3,234 522 –1.63 7.24 Novi Sad 265,464 299,294 341,625 358,572 699 513 12.74 19.81
Nis 248,086 235,159 260,237 256,381 597 430 –5.21 9.02
Kragujevac 180,084 175,802 179,417 177,383 835 212 –2.38 0.90 Subotica 150,534 148,401 141,554 137,173 1,007 136 –1.42 –7.57
Source: Statistical Office of the Republic of Serbia.
2. Basic guidelines for the development and operation of cities and municipalities
During the period of socialism (until 1990), municipalities had greater financial resources, more mandates, wider powers and greater cooperation among themselves. Public services and services were more accessible to citizens.
Between 1990 and 2000, the development of Serbian cities and municipalities took a turn. During this period, the central power was strongly centralized, the power of the municipalities was reduced, and the city and state became highly competent. As a result, cities and municipalities have lost their character acquired during socialism.
Our conclusion might be that in the 21st century in Serbia, the operation of city authorities and public enterprises is highly centralized and that the cities and municipalities are governed by the state. In cities and municipalities, most of the activity is carried out by the public sector. There is a lack of dialogue between the institutional and non-institutional spheres, including the relationship between city government and citizens.
During socialism, industrial and green areas were given much greater promi- nence in urban planning. Since 2000, business facilities and shopping centers have been gaining more and more space in order to stimulate business and to develop cities.
In 2009, the territory of the Republic of Serbia was subdivided according to the NUTS system, but never in practice. Population migration to large cities is ongoing. The population is growing most in the downtown areas. The introduced city statute is the legal framework for the rules governing the city. As a result of city statutes, many former municipalities became cities in Serbia. The regulation and management of urban land is entirely within the competence of the city, as opposed to socialist practice when it was in the hands of the municipality.
3. Analysis of the economic development in the regions of Serbia In the 21st century, free zones were created to create the conditions for developing business in cities and attracting foreign direct investment. Currently, the most successful free zones are “Subotica”, “FAS Slobodna zona” in Kragujevac, and the “Novi Sad” in Novi Sad.
The current statutes of cities determine the city budget to which most of the municipal income has been redeployed. The consequence of this measure is that municipalities are in a state of dependence on cities and the financial resources they receive from the city. According to the new statute of cities, municipalities have been given greater autonomy in the use of money.
Table 4 shows the 2018 foreign trade flows in the Republic of Serbia.
Examining the regions, it can be concluded that the Belgrade Economic Region mainly depends on the development of the volume of imports. Most of the goods on the Belgrade market are imported. The reason for this is the continuous expansion of the market and the fact that the needs cannot be met from domestic sources. Imports are also strongly encouraged by the fact that the domestic population is looking for foreign goods and services. In the Belgrade Region, the continuous expansion of the market is supported by the expansion of capacity and the emergence of new companies. Growth in the city's population will also boost demand for foreign goods. The Belgrade Region, with its many business and other opportunities, is different from other regions and encourages new companies to
invest in Belgrade. In 2018, the bulk of total imports (46.1%) came to Belgrade, followed by Vojvodina (29.4%), Sumadia and Western Serbia (14.7%) and Southern and Eastern Serbian Region (9.2%). Imports of goods in the Belgrade Region also show that investment and trade in goods are more intensive here. In all regions, intermediate exports (goods that require further processing before being placed on the market) are present in total exports. Such a structural breakdown of imports shows that, in order to maximize profits, companies supply raw materials which require further processing to meet the needs of the population.
Table 4. Foreign trade by region
Export Import % of total
exports
% of total imports
Balance
2017 2018 index 2017 2018 index 2017 2018 2017 2018 2017 2018 Republic of Serbia
15050.8 16271.4 108.1 19396.0 21918.4 113.0 100.0 100.0 100.0 100.0 –4345.2 –5647.0 Region of Belgrade
3967.5 4342.6 109.5 8907.8 10104.9 113.4 26.4 26.7 45.9 46.1 –4940.3 –5762.3 Region of Vojvodina
4974.6 5655.8 113.7 5340.3 6448.0 120.7 33.1 34.8 27.5 29.4 –365.6 –792.2 Region of Sumadia and Western Serbia
3704.3 3678.9 99.3 3183.9 3222.2 101.2 24.6 22.6 16.4 14.7 520.5 456.6 Region of Southern and Eastern Serbia
2395.0 2582.9 107.8 1848.5 2024.2 109.5 15.9 15.9 9.5 9.2 546.5 558.8 Source: Statistical Office of the Republic of Serbia.
Vojvodina ranks first (34.8%) in total Serbian exports due to agriculture. From here they export primary agricultural products (fresh and frozen fruits and vegetables). Second place is Belgrade Region (26.7%), followed by Sumadia and Western Serbia (22.6%) and Southern and Eastern Serbia (15.9%).
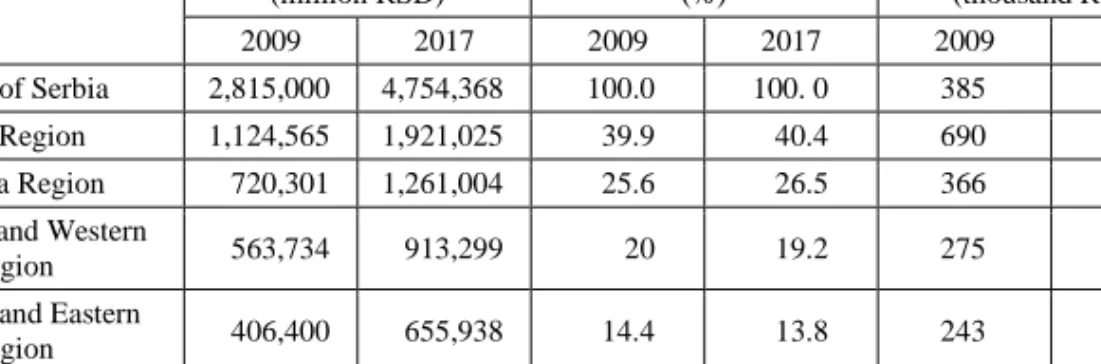
Table 5 shows the GDP values of the regions and their proportion within the national GDP. The country's GDP increased by 69% between 2009 and 2017, mainly due to the accelerated growth of the Belgrade Region. The Belgrade Region continues to achieve average annual GDP growth of 5%. To make business decisions, it is very important to look at the GDP per capita of a given region, which is an indicator of the standard of living of the population and the level of development of the region.
Table 5. Regional GDP
Area GDP
(million RSD)
GDP (%)
GDP per capita (thousand RSD)
2009 2017 2009 2017 2009 2017
Republic of Serbia 2,815,000 4,754,368 100.0 100. 0 385 677
Belgrade Region 1,124,565 1,921,025 39.9 40.4 690 1139
Vojvodina Region 720,301 1,261,004 25.6 26.5 366 674
Sumadia and Western
Serbia Region 563,734 913,299 20 19.2 275 470
Southern and Eastern
Serbia Region 406,400 655,938 14.4 13.8 243 431
Source: Statistical Office of the Republic of Serbia.
The GDP per capita in the Belgrade Region is RSD 1139000. In this region, GDP per capita is 68.1% higher than the national level. The uneven distribution of the regions is caused by the concentration of resources (domestic and foreign) and the stronger purchasing power in the Belgrade Region. Internal migration to Belgrade will only deepen these processes. The GDP per capita in the Vojvodina Region corresponds to the average of the Republic, while the other two regions lag behind significantly. When comparing the regions, the Belgrade Region (as measured by GDP per capita) is 2.6 times more developed than the Southern and Eastern Serbian region. Compared to 2009, regional disparities have declined to some extent (compared to the national value, GDP growth per capita in the Belgrade Region was 80% and all other regions were below the national average).
4. Conclusions
The analyzes above and data confirms that in the early 1990s, when Yugoslavia began to dissolve and a total economic embargo was introduced against the country, the transformation of the municipal system in Serbia began. The former socialist municipal system based on reducing regional disparities and helping the prosperity in less developed regions was replaced by a centralized “income redirection” system with the official explanation, that the reason of it is the difficult economic condition in the country.
The economic and social development of the five largest Serbian cities was completely different in the last decades of the 20th century. A serious decline in the population can be observed everywhere, except in Novi Sad. The largest number of refugees from Croatia, Bosnia and Herzegovina and Kosovo moved to the capital of Vojvodina and the population growth was 12.74%.
In all the cities the economic performance has fallen significantly. The two cities with the smallest decline in economy were Belgrade and Novi Sad, the
center of agricultural products processing that performed well despite the economic embargo. The biggest economic downturn was in the central Serbian city Kragujavac, a city known for its armaments and car industry. Large companies in the city have lost their export markets, and the unemployment was over 50%.
Although the Nis lost its earlier importance in heavy and electrical industry, but as one of the centers of so-called tolerated black trade, socially it has not been in difficult situation as Kragujevac was.
Subotica also suffered heavy losses in the 1990s, in terms of population decline (1.42%), but far below the rate of Nis (5.21%).
The economic crisis caused by Milosevic's policy Subotica, as a border city, compensated from the aforementioned black market, prosperous agriculture, and previously negligible revenue from tourism, which achieved significant growth in the 1990s. In the nearly two decades since the democratic transition, in the five largest Serbian cities these processes have changed slightly. Development is evident in every city, but not in the same fields or to the same extent.
Population growth continues to be the most significant in Novi Sad (19.81%
between 2002 and 2018), but there is a strong population growth both in Nis (9.02%) and Belgrade (7.24%).
In contrast, the population of Kragujevac could not increase significantly (0.9%), while in Subotica the number of inhabitants decreased by 7.57% (basically social migration). Since 2001 the economic growth was most significant in Belgrade and Novi Sad. While Novi Sad has grown into an export-oriented center of science, innovation and technology, Belgrade became an “import distribution center”. The education policy support given by the city management of Novi Sad and the significant increase of foreign investments played an important role in the serious economic growth. Belgrade and its region play a significant role (40.4%) due to the high proportion of multinational companies and real estate developments that result in rapid GDP growth.
The situation improved slightly in the city of Nis thanks to rapid growth in IT training and IT companies operating in the town, while the former succesfull heavy and mechanical industry is still underdeveloped.
The rapid economic growth expected from the investment of the Italian FIAT plant in Kragujevac was delayed because the investment – trusting in the benefits of the Serbian-Russian Free Trade Agreement – was not successfull, as the Russian market did not open up for cars manufactured in Serbia.
In recent years Subotica made good use of its free zone potential and of the proximity of the EU border. Large number of multinational companies have emerged, and nowadays the labor shortage is the barrier to further growth. In the last one and a half decade there was a huge emigration from the city, and now the
question is, will it be able to replace the lost labor and to provide the basic conditions for growth or no.
Acknowledgements
Research of Szilárd Rácz supported by the János Bolyai Scholarship of the Hungarian Academy of Sciences.
References
ENYEDI, GY. 1978. Kelet-Közép-Európa gazdaságföldrajza. Budapest: Közgazdasági és Jogi Könyvkiadó.
FRENCH, R. A., HAMILTON, F. E. I. 1979. Is there a Socialist City? U R. A. French i F. E. I.
Hamilton (Ur.), The Socialist City: Spatial Structure and Urban Policy (str. 1–22). Chichester, New York, Brisbane, Toronto: John Wiley & Sons.
HAJDÚ, Z., SZÜGYI, É. 2015. Szerbia. In: HORVÁTH, GY. (szerk.): Kelet- és Közép-Európa régióinak portréi. Budapest: Kossuth Kiadó. pp. 385–408.
HAJDÚ, Z., RÁCZ, SZ. 2011. Urbanisation, state formation processes and new capital cities in the Western Balkans. In: Acta Universitatis Palackianae Olomucensis Facultas Rerum Naturalium Geographica. Vol. 42, No. 2, pp. 63–77.
HAMILTON, F. E. I. 1979. Urbanization in Socialist Eastern Europe: The Macro-Environment of Internal City Structure. U R. A. French i F. E. I. Hamilton (Ur.), The Socialist City: Spatial Structure and Urban Policy (str. 167–194). Chichester, New York, Brisbane, Toronto: John Wiley & Sons.
HIRT, S. A. 2012. Iron Curtains: Gates, Suburbs and Privatization of Space in the Post-socialist City. Chichester, Oxford, Malden: John Wiley & Sons.
KONRÁD, GY., SZELÉNYI, I. 1971. A késleltetett városfejlődés társadalmi konfliktusai. In:
Valóság. No. 12, pp. 19–35.
NAGY, I. (szerk.) 2007. Vajdaság. Pécs–Budapest: MTA Regionális Kutatások Központja, Dialóg Campus Kiadó. (A Kárpát-medence régiói, 7).
RADULOVIĆ, D. 2013. Regionalna politika i regionalni razvoj – Evropska Unija. Hesperia, Novi Sad.
WOODWARD, S. L. 1995. Socialist Unemployment: The Political Economy of Yugoslavia, 1945–
1990. Princeton: Princeton University Press.
ZEKOVIĆ, S. 2009. Regional competitiveness and territorial industrial development in Serbia.
Spatium. No. 21, pp. 27–38.
ZEPEDA C., ZARIĆ S. 2017. An analysis of urban planning in postsocialist societies through the concept of sustainable development: Evidence from Budapest and Belgrade, Limes plus. Vol.
XIV, No.3, pp. 75–91.