RESEARCH
Blood–brain barrier dysfunction
in l -ornithine induced acute pancreatitis in rats and the direct effect of l -ornithine on cultured brain endothelial cells
Fruzsina R. Walter1, András Harazin1,10, Andrea E. Tóth1,10, Szilvia Veszelka1, Ana R. Santa‑Maria1,9, Lilla Barna1, András Kincses1, György Biczó2, Zsolt Balla2,11, Balázs Kui2, József Maléth2,4,5, László Cervenak6, Vilmos Tubak7, Ágnes Kittel8, Zoltán Rakonczay Jr2,3 and Mária A. Deli1*
Abstract
Background: In severe acute pancreatitis (AP) the CNS is affected manifesting in neurological symptoms. Earlier research from our laboratory showed blood–brain barrier (BBB) permeability elevation in a taurocholate‑induced AP model. Here we aimed to further explore BBB changes in AP using a different, non‑invasive in vivo model induced by l‑ornithine. Our goal was also to identify whether l‑ornithine, a cationic amino acid, has a direct effect on brain endothelial cells in vitro contributing to the observed BBB changes.
Methods: AP was induced in rats by the intraperitoneal administration of l‑ornithine‑HCl. Vessel permeability and the gene expression of the primary transporter of l‑ornithine, cationic amino acid transporter‑1 (Cat-1) in the brain cortex, pancreas, liver and lung were determined. Ultrastructural changes were followed by transmission electron microscopy. The direct effect of l‑ornithine was tested on primary rat brain endothelial cells and a triple co‑culture model of the BBB. Viability and barrier integrity, including permeability and TEER, nitrogen monoxide (NO) and reac‑
tive oxygen species (ROS) production and NF‑κB translocation were measured. Fluorescent staining for claudin‑5, occludin, ZO‑1, β‑catenin, cell adhesion molecules Icam‑1 and Vcam‑1 and mitochondria was performed. Cell surface charge was measured by laser Doppler velocimetry.
Results: In the l‑ornithine‑induced AP model vessel permeability for fluorescein and Cat-1 expression levels were elevated in the brain cortex and pancreas. On the ultrastructural level surface glycocalyx and mitochondrial damage, tight junction and basal membrane alterations, and glial edema were observed. l‑ornithine decreased cell impedance and elevated the BBB model permeability in vitro. Discontinuity in the surface glycocalyx labeling and immunostain‑
ing of junctional proteins, cytoplasmic redistribution of ZO‑1 and β‑catenin, and elevation of Vcam‑1 expression were measured. ROS production was increased and mitochondrial network was damaged without NF‑κB, NO production or mitochondrial membrane potential alterations. Similar ultrastructural changes were seen in l‑ornithine treated brain endothelial cells as in vivo. The basal negative zeta potential of brain endothelial cells became more positive after
l‑ornithine treatment.
© The Author(s) 2022. Open Access This article is licensed under a Creative Commons Attribution 4.0 International License, which permits use, sharing, adaptation, distribution and reproduction in any medium or format, as long as you give appropriate credit to the original author(s) and the source, provide a link to the Creative Commons licence, and indicate if changes were made. The images or other third party material in this article are included in the article’s Creative Commons licence, unless indicated otherwise in a credit line to the material. If material is not included in the article’s Creative Commons licence and your intended use is not permitted by statutory regulation or exceeds the permitted use, you will need to obtain permission directly from the copyright holder. To view a copy of this licence, visit http:// creat iveco mmons. org/ licen ses/ by/4. 0/. The Creative Commons Public Domain Dedication waiver (http:// creat iveco mmons. org/ publi cdoma in/ zero/1. 0/) applies to the data made available in this article, unless otherwise stated in a credit line to the data.
Open Access
*Correspondence: deli.maria@brc.hu
1 Institute of Biophysics, Biological Research Centre, Temesvári krt. 62, Szeged 6726, Hungary
Full list of author information is available at the end of the article
Introduction
Acute pancreatitis (AP) is a serious gastroenterologi- cal inflammatory disease with a high mortality rate [1].
A central problem in the treatment of AP patients is that there is still no specific therapy for this disease and its complications [2, 3]. A better understanding of AP and the related comorbidities would improve the disease out- come reducing the rate of organ failure and mortality [4].
In the most severe form of AP mortality is high due to the serious damage of the exocrine pancreas, and sys- temic inflammation caused by the high level of secreted cytokines and other toxins in the circulation causing multiple organ failure [5, 6]. Among the complications, the central nervous system (CNS) is affected in 10% of all cases during severe AP leading to pancreatic encephalop- athy [7, 8]. Disorientation, agitation, hallucinations, slow reaction time and apathy are major indicators of CNS involvement. Postmortem tissue examination reveals diffuse demyelination, edema, neuronal loss and hem- orrhagic stroke in the brain, while MRI studies confirm lesions in the white matter [7]. Since the mortality rate is 50% among these patients, it is crucial to describe and identify the most important factors and changes leading to this condition [1, 8]. Recently it was found that in all forms of AP disturbance in consciousness might develop manifesting in confusion, delirium and convulsion both in alcohol-induced and non-alcohol related AP [9].
Although case studies and animal models of AP have revealed several aspects about the course of the patho- mechanism, further studies are needed to fully describe this disease and its comorbidities [10]. Invasive mod- els of pancreatitis have been developed since the 1970’s [10]. One of the surgical methods is the injec- tion of taurocholic acid into the pancreatic duct [11].
Our research group described for the first time that in taurocholate induced AP blood–brain barrier (BBB) permeability was elevated in rats in parallel with high levels of cytokines [12]. Later new, non-invasive animal AP models were introduced. Intraperitoneal injection of cationic amino acids such as l-arginine at high con- centration induces AP [13]. l-arginine is a major mem- ber of several metabolic pathways including the urea cycle, therefore l-ornithine, a metabolite of arginine,
and another cationic amino acid, l-lysine, were also tested and demonstrated to generate AP in rats [14, 15]. In these models NF-κB activation, mitochondrial injury, nitric oxide (NO) and calcium-signaling were described to contribute to the development of AP [14–18]. In the l-ornithine-induced AP model, pancre- atic edema is visible already after 6 h of the treatment, trypsin activity increases, pancreatic proinflammatory cytokine levels are elevated, NF-κB activation and tis- sue necrosis are detectable [14, 19]. Among the cationic amino acid injection methods, the most effective and most reproducible model proved to be the l-ornithine induced AP model, which by reproducing several labo- ratory and morphological signs is most similar to the human disease.
Brain capillary endothelial cells form the functional basis of the BBB creating a dynamic interface between the CNS and the periphery. These brain microvessel endothelial cells possess unique features, such as tight intercellular junctions, specialized nutrient and efflux transport systems, and negatively charged surface gly- cocalyx to protect the CNS from toxic insults, provide nutrients, and maintain the ionic homeostasis for brain functions [20]. BBB integrity, transporter activity, sur- face glycocalyx thickness and composition of brain endothelial cells are altered in several disease patholo- gies, like epilepsy, dementia, trauma, hypoxia, infec- tions and inflammation, which alone or in combination can lead to clinical and behavioral manifestations in both patients and in animal models [21–23].
Our hypothesis is that BBB dysfunction and barrier damage play a major role in the development of CNS complications during severe AP in patients, and this can be studied by using animal models of severe AP. In this study we aimed to characterize and describe BBB integrity and morphology changes in the l-ornithine- induced AP model in rats. Expression levels of cationic transporter-1 (Cat-1) as primary transporter of l-orni- thine in the brain and other organs was also studied to identify tissue specific changes. Our second main goal was to investigate the direct effect of l-ornithine on culture BBB models to reveal if this cationic amino acid can directly damage brain endothelial cells and Conclusion: We demonstrated BBB damage in the l‑ornithine‑induced rat AP model suggesting a general, AP model independent effect. l‑ornithine induced oxidative stress, decreased barrier integrity and altered BBB morphology in a culture BBB model. These data suggest a direct effect of the cationic l‑ornithine on brain endothelium. Endothelial surface glycocalyx injury was revealed both in vivo and in vitro, as an additional novel component of the BBB‑related pathological changes in AP.
Keywords: Acute pancreatitis, Blood–brain barrier, Ornithine, Permeability, Glycocalyx, Mitochondrial damage, Reactive oxygen stress, Cell surface charge
contribute to the BBB alterations in the rat model addi- tionally to the known pathogenic factors of AP.
Materials and methods Materials
All reagents were purchased from Sigma-Aldrich Ltd.
(belonging to Merck Group, Darmstadt, Germany) unless otherwise indicated. A table providing catalog numbers and source information of antibodies used in the present study is shared in the Additional file 1: Table S1.
Animals
All animals were handled in accordance with approved procedures as defined by the EU Directive 2010/63/EU and all animal work was approved by the regional Station for Animal Health and Food Control Csongrád County, Hungary (project license: XVI/834/2012 for M.A.D., XVI/3554/2020 for F.R.W. and XII/955/2012 for Z.R.).
Male Wistar rats were housed in conventional animal facilities of the University of Szeged and the Biological Research Centre, Szeged according to EU regulations.
Animals were kept under standard conditions (22–24 °C, 12 h light–dark cycle) with regular rodent chow diet and water available ad libitum. For the isolation of primary cells, organs were harvested after the euthanasia of rats with CO2 inhalation.
Induction of acute pancreatitis in rats
The non-invasive acute necrotizing pancreatitis model used in the present paper was described earlier in detail [14, 17]. Male Wistar rats weighing 200–250 g (n = 12) were injected intraperitoneally (i.p.) with 3 g/kg l-orni- thine-HCl (pH = 7.4, 30%), to induce homogenous and reproducible AP pathology within 24 h. Control animals received equal volume of physiological saline solution (n = 12). To decrease dehydration, 1.5 ml Ringer-lactate solution was injected subcutaneously. To set up a humane endpoint a point scale system was developed based on our experience and literature data [24, 25]. Accordingly, animals were monitored every 2–3 h and their general state was assessed (fur, position, motility, awareness, star- tling reaction scored from 0 to 2). If animals reached a total sum of score above six, their level of distress was considered too high and a humane endpoint was intro- duced with the i.p. injection of 150 mg/kg pentobarbital.
In vivo permeability experiments
The microvessel permeability was investigated in the brain, pancreas, liver and lung of rats in both treat- ment groups. One day after the induction, when acute necrotizing pancreatitis was developed, the extravasa- tion of permeability markers, sodium fluorescein (SF, 376 Da) and Evans blue-labeled albumin (EBA, 67 kDa)
was tested [26, 27]. Solutions of 2% containing both dyes were given to the animals intravenously (tail vein). After 30 min, deep anesthesia was induced by sodium pento- barbital (50 mg/kg i.p.) and animals were perfused with saline. Tissue samples from the brain cortex, pancreas, liver and lung were collected, weighed and stored fro- zen. To measure dye concentrations tissue samples were homogenized in 15% trichloroacetic acid and were cen- trifuged at 10,000 × g for 10 min at 4 °C. Concentrations of the two different dyes from the supernatants were measured using a spectrofluorometer (Photon Technol- ogy International Inc., Birmingham, NJ, USA). The fluo- rescence emission of SF was measured at 525 nm after the excitation at 440 nm. Absorbance of EBA was deter- mined at 620 nm. Extravasation was calculated as ng tracer / mg tissue.
Transmission electron microscopy
Ultrastructural changes in the acute necrotizing pancrea- titis and control groups (n = 4 / group) was investigated with transmission electron microscopy (TEM). Rats were anesthetized with sodium pentobarbital (150 mg/
kg), then were transcardially perfused with 0.9% NaCl in 0.1 M phosphate buffer. Animals were then perfused with 0.1 M phosphate buffer containing 4% paraformaldehyde (PFA), 2.5% glutaraldehyde and 2% Alcian blue. Brains and pancreata were removed and post-fixed with 4% PFA in 0.1 M phosphate buffer overnight at 4 °C. Three mm thick tissue blocks of a half brain containing the frontal cortex region or 2 × 5 × 7 mm tissue blocks of the pan- creas were cut out by blade and washed in 0.1 M phos- phate buffer. Coronal brain Sects. (50 µm) or pancreas Sects. (60 µm) were obtained by a vibrating microtome (VT1000S; Leica Microsystems, Wetzlar, Germany). Sec- tions were postfixed with 1% OsO4 for 1 h, rinsed with distilled water, dehydrated in graded ethanol, en bloc stained with 2% uranyl acetate in 70% ethanol for 30 min, finally embedded in Taab 812 (Taab Equipment Ltd., Aldermaston, UK). Following overnight polymerization at 60 °C, ultrathin sections were obtained using a Leica UCT ultramicrotome (Leica Microsystems). The digital pictures were taken on a Hitachi 7100 electron micro- scope (Hitachi, Tokyo, Japan). Brightness and contrast were adjusted if necessary using Adobe Photoshop CS3 (Adobe Inc., San Jose, CA, USA). A total of 28–28 images of the sham (control) and AP groups were analyzed and morphological changes in endothelial cells of brain corti- cal capillaries are summarized in Table 1.
Assessment of the gene expression of cationic amino acid transporter‑1 (Cat‑1)
The mRNA expression of Cat-1 was measured using quantitative real-time PCR (qPCR) following RNA
isolation and cDNA synthesis from brain microves- sels, brain cortex, pancreas, liver and lung samples (n = 3–6). Tissue samples were collected at 3 different time points after l-ornithine injection. Rats were anes- thetized with pentobarbital (50 mg/kg), cervically dis- located and decapitated. The abdomen of the animals was quickly opened and ~ 100 mg tissue pieces from the pancreatic head were dissected and snap frozen in liq- uid nitrogen within 90 s to avoid damage of pancreatic tissue. Next, samples from the liver and the lung were collected. After opening the skull, the whole brain was collected, the cerebellum was removed and brain cortex samples were dissected. Following the removal of white matter pieces, the rest of the brain tissue was used for brain microvessel isolation based on our recently pub- lished protocol [28]. All samples were snap frozen and homogenized in TRI Reagent (Molecular Research Center Inc., Cincinnati, OH, USA) with an electric homogenizer (T8.01, IKA Labortechnik, Staufen im Breisgau, Germany). Isolated brain microvessels were homogenized with a glass homogenizer.
The homogenates were used for isolation of total RNA. Briefly, after phase separation with chloroform, RNA was precipitated with isopropanol and cleaned with a subsequent precipitation with lithium chloride (LiCl). The precipitated RNA was dissolved in 200 µl sterile distilled water, reprecipitated with additional 60 µl of 8 M LiCl and incubated on ice for 30 min. The precipitated RNA was collected with centrifugation and washed twice with ice-cold 80% ethanol. After air- drying RNA samples were dissolved in 40 µl of sterile distilled water and were measured using NanoDrop 1000 spectrophotometer (Thermo Fisher Scientific Inc., Waltham, MA, USA). RNA quality was also confirmed by agarose gel electrophoresis.
After DNase treatment (Thermo Fisher Scientific Inc.), 1 μg RNA from each sample was transcribed to complementary DNA with Maxima First Strand cDNA Synthesis Kit (Thermo Fisher Scientific Inc.) follow- ing the manufacturer’s instructions. To perform qPCR, gene-specific and exon/exon junctions covering oligo- nucleotide primer pairs were used from The Univer- sal Probe Library Assay Design Center (Merck). The following primer pairs were used with FAM-TAMRA labelled universal probes: for Cat-1/Slc7a1 transporter (gene ID: NM_013111.3) fw 5’-GGA GCT CTG GGC CTT CAT -3’; rv 5’-CTT GCC ACG CTG GAT GTA -3’;
probe #20; for hypoxanthine phosphoribosyltrans- ferase 1 (Hprt-1; gene ID: NM_012583.2) fw 5’-GAC CGG TTC TGT CAT GTC G-3’; rv 5’-ACC TGG TTC ATC ATC ACT AAT CAC -3’; probe #95. qPCR was performed with iQ Supermix (Bio-Rad Laboratories Inc., Hercules,
CA, USA) in a CFX96 Real-Time PCR Detection Sys- tem (Bio-Rad Laboratories Inc.). After heat activation at 95 °C for 3 min the following cycling conditions were applied: denaturation for 30 s at 93 °C, annealing and polymerization for 60 s at 60 °C and registration of flu- orescent signals (50 cycles). Data was processed with the CFX Manager software (Bio-Rad Laboratories Inc.).
Relative gene expression levels were normalized to the endogenous control gene Hprt-1 (ΔCt). Then ΔΔCt was calculated in comparison to the lowest relative expres- sion of Cat-1/Slc7a1 in the liver samples from the vehi- cle-treated group. Fold changes were calculated using the 2−ΔΔCt formula.
Primary rat brain cell cultures
Primary rat brain endothelial cells and primary brain microvessel pericytes along with primary brain astro- glia cells were isolated according to our well established and characterized method [27, 29, 30]. Reagents for the isolation are listed in our previous paper [31]. Primary cell based culture models are widely used and suitable systems to investigate the pathology, pharmacology and physiology of the BBB in vitro [32]. For perme- ability and barrier integrity studies primary rat brain endothelial cells were co-cultured with primary rat brain pericytes and glial cells on cell culture inserts to induce BBB properties. All surfaces for primary brain endothelial cells were coated with collagen type IV and fibronectin (100 µg/ml each in sterile distilled water).
To culture pericytes and astrocytes, collagen type IV (100 µg/ml in sterile distilled water) coating was used.
Cell culture medium during all experiments’ growth period contained 10% plasma derived serum (PDS, First Link UK Ltd., Birmingham, UK), 5 μg/ml insulin, 5 μg/
ml transferrin, 5 ng/ml sodium selenite (ITS, Thermo Fisher Scientific Inc.), 1 ng/ml basic fibroblast growth factor, 10 mM HEPES, 100 µg/ml heparin and 50 µg/
ml gentamycin in DMEM/F12 (Thermo Fisher Sci- entific Inc.). In all experiments 24 h before treatment cells received 550 nM hydrocortisone to tighten barrier properties [31, 32].
Cell viability assays MTT assay
For this method primary rat brain endothelial cells were seeded on 96-well plates (Corning Costar, Corn- ing, NY, USA) at a cell number of 5 × 10⁴ cells/well.
Cells reached confluency within 3–4 days, then cul- tures were treated with 1–40 mM l-ornithine or d-ornithine. Triton-X100 (1%) was used to induce cell death. Conversion of the yellow MTT dye
(3-(4,5-dimethylthiazol2-yl)-2,5-diphenyltetrazolium bromide) to blue formazan crystals reflects the meta- bolic activity: wells with living cells turn blue and wells with less viable cells stay more yellow. After 24 h treat- ment, solutions were removed and cells were incubated with 0.5 mg/ml MTT dye in phenol red-free DMEM/
F12 (Thermo Fisher Scientific Inc.). Cell cultures were observed during this period every 30 min until maxi- mum crystal conversion occurred (~ 1.5–2 h). Formazan crystals were then dissolved in dimethyl sulfoxide, and absorbance was measured with a multiwell plate reader (Fluostar Optima, BMG Labtechnologies, Offenburg, Germany) at 592 nm. Cell viability was calculated as a percentage of the medium-treated control group, where the maximum dye conversion was observed.
Impedance measurement
Using a label-free, noninvasive, impedance based tech- nique (RTCA SP, Agilent, Santa Clara, CA, USA) con- fluency, morphology and barrier integrity of primary rat brain endothelial cells can be monitored in real time. This technique correlates linearly with the cell number, adherence, growth and viability of the cells [27, 33]. This method is also a good verification for end- point colorimetric tests, such as MTT assay [33]. Here primary rat brain endothelial cells at a cell number of 5 × 10⁴ cells/well were seeded on special 96-well plates with embedded gold electrodes (E-plate, Agilent). First, background impedance was measured with the addi- tion of 50 µl cell culture medium, then cells were added and growth was followed. Once cells reached the pla- teau phase of growth they were treated with 1–40 mM l-ornithine or d-ornithine, or with the reference com- pound 1% Triton-X100 detergent to induce cell death.
Effects of the treatment was followed for 24 h.
Barrier integrity tests
For these assays the triple co-culture model of the BBB was established from primary rat brain endothe- lial cells, primary rat brain pericytes and glial cells on cell culture inserts (Transwell inserts: 12 mm diameter, 1.12 cm2 surface, 0.4 µm membrane pore size, polyester membrane; Corning Costar).
Transendothelial electrical resistance measurement
To follow the development of barrier properties of primary rat brain endothelial cells in co-culture transendothelial electrical resistance (TEER) was meas- ured every second day before the medium change on a heating pad set to 37 °C using an EVOM Volt/
Ohm Meter with an STX-2 electrode (World Preci- sion Instruments, Sarasota, FL, USA). The TEER was
always calculated relative to the surface of the cell culture insert (Ω × cm2) and the background of cell- free inserts was subtracted from the measured values (120 Ω × cm2). TEER was measured 24 h after 20 mM l-ornithine or d-ornithine treatment, culture medium- treated cells served as control.
Permeability studies
Directly after the 24 h 20 mM l-ornithine or d-ornith- ine treatment and the resistance measurements, the BBB model was tested for permeability of two fluorescent dyes, SF (10 µg/ml) and EBA (170 µg/ml EB and 10 mg/
ml bovine serum albumin, BSA) in Ringer-Hepes buffer exactly as described previously [34]. Permeability of cell- free inserts was also tested and used later to calculate the permeability coefficient for endothelial monolayers (Pe) [34] for each treatment condition.
Immunohistochemistry
To investigate the direct effect of l-ornithine treatment on junctional integrity primary brain endothelial cells were stained for four membrane and membrane associ- ated junctional proteins: tight junction (TJ) molecules claudin-5 and occludin, and junctional associated cyto- plasmic linker proteins zonula occludens-1 (ZO-1) and β-catenin. Directly after the permeability measurements, inserts containing cells were rinsed once in Ringer- Hepes buffer and were fixed with 1% PFA-phosphate buffered saline (PBS) solution for 15 min at room tem- perature. Cells were stored in 0.1% sodium azide-PBS until staining. Cells were also cultured on collagen type IV coated glass cover slips, treated when reaching con- fluency, then fixed and stored similarly. First, cells were permeabilized with 0.1% Triton-X100 in PBS for 15 min at 4 °C. Cells were then washed in PBS and were treated with 1% BSA-PBS for 1 h at room temperature to block the unspecific binding sites. Incubation with rabbit pri- mary antibodies for claudin-5 (SAB4502981, 1.6 µg/ml), occludin (71–1500, 1.25 µg/ml, Thermo Fisher Scien- tific Inc.), ZO-1 (61–7300, 0.625 µg/ml, Thermo Fisher Scientific Inc.) and β-catenin (C2206, 1.6 µg/ml) lasted overnight at 4 °C in blocking buffer. The next day, cells were washed in PBS and were incubated with the second- ary antibody sheep anti-rabbit-Cy3 (C2306, 2.5 µg/ml) for 1 h at room temperature in PBS. After this step, cells were washed again with PBS, then once with distilled water and samples were mounted with Fluoromount G mounting medium (Southern Biotech, Birmingham, AL, USA). Pictures were taken with a TCS SP5 confocal laser scanning microscope (Leica Microsystems, Wetzlar, Ger- many). Image merging was performed using the ImageJ
software (NIH, Bethesda, MD, USA). The fluorescently labeled images were also analyzed using the Matlab soft- ware (R2019a, MathWorks, Inc., Natick, MA, USA). The intracellular areas (cytoplasm) of the cells on each image were defined by a freehand region of interest (ROI) deter- mination, performed by a blinded experimenter. These ROIs were subtracted from the original image, thus the resulting image contained only the immunostaining at the intercellular junctions. Using the threshold of the original image, both the image of the cytoplasm and the TJs were converted to binary images (BI). The BIs were used as masks to determine the cumulative intensities of the original pixels for both cytoplasmic and TJ images.
The ratio of the cell membrane and cytoplasm intensities for each image was calculated and used for the statistical analysis.
Staining for the intercellular adhesion molecule-1 (mouse anti-Icam-1, MA5407, 2 µg/ml, Thermo Fisher Scientific Inc.) and the vascular cell adhesion molecule-1 (mouse anti-Vcam-1, 13–1060-82, 2 µg/ml, Thermo Fisher Scientific Inc.) were performed similarly as writ- ten above. Experiments were finished with incubation in goat anti-mouse-Alexa488 secondary antibody (A-11029, 4 µg/ml, Thermo Fisher Scientific Inc.). Analysis was per- formed using the Olympus FV1000 confocal microscope (Olympus Corporation, Tokyo, Japan). Image merging and analysis measuring total mean gray value was done with the ImageJ software (NIH).
Measurement of reactive oxygen species and nitric oxide production
Both methods to measure reactive oxygen species (ROS) is based on cell-permeable, inherently non-fluorescent dyes, which are converted into a fluorescent form when they enter the cells and detect free oxygen species. All kinds of ROS are detected by the 2’,7’-dichlorodihydroflu- orescein diacetate (H2DCFDA, Thermo Fisher Scientific Inc.), while NO production is measured by the 4-amino- 5-methylamino-2’,7’-difluorofluorescein diacetate (DAF- FM diacetate, Thermo Fisher Scientific Inc.). Primary rat brain endothelial cells were seeded at a cell number of 5 × 10⁴ onto 96-well plates with black wall and transpar- ent bottom (Corning Costar, USA). After reaching con- fluency, cells were treated with 20 mM l-ornithine for 24 h. The assays were performed as previously described in our publications [30, 35]. Reference compounds hydro- gen peroxide (H2O2, 100 µM) for ROS and sodium nitro- prusside (SNP, 100 µM) for NO production were used to validate the assays.
Mitochondrial network staining
Cellular stress influences the basic functions of mito- chondria and the mitochondrial network within a cell.
Therefore, we aimed to visualize this network using the Mitotracker Green dye (Thermo Fisher Scientific Inc.) according to the manufacturer’s instructions. Since this dye cannot be fixed, we performed live cell imaging. Pri- mary brain endothelial cells were grown on glass bottom 35 mm Petri dishes (MatTek Corporation, Ashland, MA, USA) until confluency. Cells were treated with 20 mM l-ornithine for 24 h, or a mitochondrial network decou- pling agent, carbonyl cyanide 3-chlorophenylhydrazone (CCCP, 5 µM) for 30 min. Control cells received cell culture medium. After treatment cells were stained in Ringer-Hepes buffer with Mitotracker Green (0.1 µM) and Hoechst 33,342 nucleus dye (0.6 µg/ml) for 30 min in the cell culture incubator. Cells were then washed three times and fluorescent microscopy pictures were taken on living cells in the Ringer Hepes buffer using the Olympus FV1000 confocal microscope (Olympus Corporation).
Image analysis was performed using the ImageJ software (NIH). Intracellular mitochondrial network integrity was evaluated using the Matlab software (R2019a, Math- Works, Inc.). The fluorescent image of the mitochondrial network was shrinked to a skeletal web. Then, the num- ber of the branchpoints were determined and the aver- age branch length was calculated. Lower average object length represents a disorganized and disassembled mito- chondrial network.
Transmission electron microscopy of the BBB co‑culture and image analysis
In addition to the in vivo TEM studies, we also aimed to visualize the direct effect of l-ornithine treatment on the ultrastructure of primary rat brain endothelial cells. The triple co-culture BBB model was established and treated with 20 mM l-ornithine for 24 h, as described earlier.
After treatment, cells on both surfaces of the membrane of the inserts were washed quickly in warm PBS, then rinsed with the fixative containing 3% PFA and 0.5% glu- taraldehyde (GA) in cacodylate buffer (0.05 M sodium cacodylate, 0.25 M saccharose in filtered distilled water, pH of 7.4) at room temperature. It was followed by fixa- tion with a new portion of the fixative supplemented with 1% Alcian blue for 30 min at 4 °C. This cationic dye is capable of staining the highly negatively charged surface glycocalyx in cell cultures as well, similarly to the in vivo studies. Then the inserts were washed with cacodylate buffer and were processed for TEM analysis as written for the tissue samples. First, the membranes with the cells on their two sides were removed from their support and placed into 24-well chamber slides, postfixed in 1%
OsO4 for 30 min at room temperature, then rinsed with distilled water. Dehydration and embedding in Taab 812 (Taab Equipment Ltd.) were performed as written in the in vivo TEM section. Since the whole membrane was
embedded the small resin blocks suitable for sectioning were cut with a saw. Ultrathin sections were cut perpen- dicularly for the membrane using a Leica UCT ultrami- crotome (Leica Microsystems) and examined using a Hitachi 7100 transmission electron microscope (Hitachi Ltd.). Electron micrographs were made by Megaview II (lower resolution, Soft Imaging System, Münster, Ger- many). Brightness and contrast were adjusted if necessary using Adobe PhotoshopCS3 (Adobe Inc.). A total of 29 images from the control and 48 of the l-ornithine treated groups were analyzed, and ultrastructural changes in cul- tured brain endothelial cells are shown in Table 2.
Zeta potential measurements
To assess the direct, acute effect of l-ornithine treatment on the surface charge (zeta potential) of primary rat brain endothelial cells, we used the dynamic light scattering method measured by a Zetasizer NanoZS instrument (Malvern Panalytical, UK). The measurement was per- formed similarly as we published before [33, 36]. Briefly, confluent layers of cells in a 35 mm or 60 mm Petri dish were quickly and gently trypsinized and counted. For each condition aliquots of 105 cells/microcentifuge tube were prepared. Cells in microtubes received 5–20 mM concentrations of l-ornithine in PBS, then zeta poten- tial was immediately measured. Cell suspensions were directly injected into the folded capillary zeta cell and surface charge measurement was performed. Values presented in mV were calculated by the software of the instrument.
Statistical analysis
Data are presented as means ± SEM. Statistical signifi- cance between treatment groups was determined using the Graph Pad Prism 5.0 Software (GraphPad, USA) using unpaired t- test, one-way and two-way Anova analyses with Bonferroni post-tests. All experiments were repeated at least twice and the number of total bio- logical and technical parallels were always at least three.
Changes were evaluated as statistically significant when p < 0.05.
Results
Pancreas and brain vessel permeability is elevated in l‑ornithine‑induced acute pancreatitis in rats
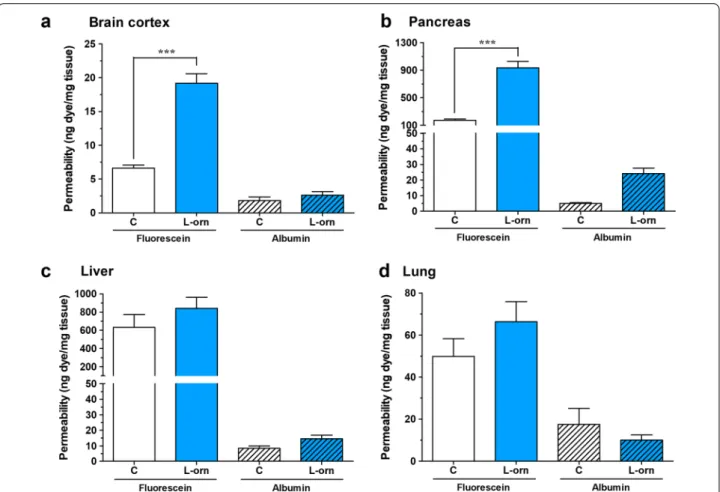
The permeability of vessels was analyzed in the brain, pancreas, liver and lung (Fig. 1). In the AP group, the extravasation of sodium fluorescein was significantly elevated in the brain cortex and in the pancreas, while no change was seen for the albumin permeability. Ves- sel permeability in the liver and lung was not changed for the marker molecules. The lowest basal permeability was
observed in the brain, followed by the lung and pancreas, while the highest vascular leakage was seen in the liver (Fig. 1).
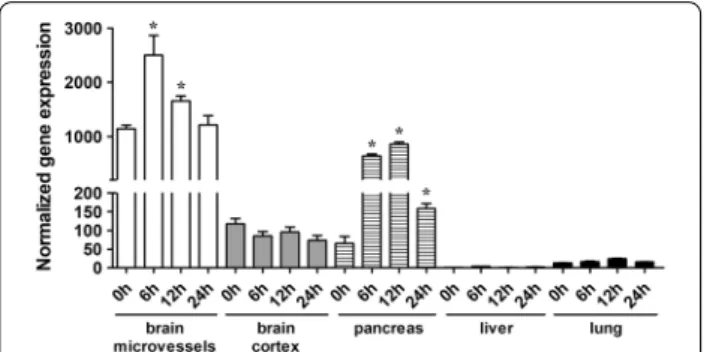
Induction of acute pancreatitis by l‑ornithine increases the expression of the cationic amino acid transporter‑1 (Cat‑1) in the brain and the pancreas of rats
Since l-ornithine is a cationic amino acid, we investi- gated the gene expression of the most abundant cati- onic amino acid transporter, Cat-1/Slc7a1, in different organs (Fig. 2). The relative basal mRNA level of Cat- 1 was the highest in brain microvessels. Gene expres- sion of Cat-1 was elevated in the brain microvessel and pancreas samples of rats with AP. In brain microves- sels, significantly higher mRNA level was found 6 and 12 h after l-ornithine injection compared to the basal level (0 h). In the pancreas, elevated Cat-1 gene expression was detected in the AP group at all the three time points. Cat-1 levels were low in brain corti- cal tissue and lung samples, and no significant change in the gene expression was seen during the develop- ment of AP. The lowest Cat-1 expression was detected in the liver (close to detection limit).
Glycocalyx damage, edema and junctional disturbances occur at the ultrastructural level in the brain and pancreas microvessels during acute pancreatitis in rats
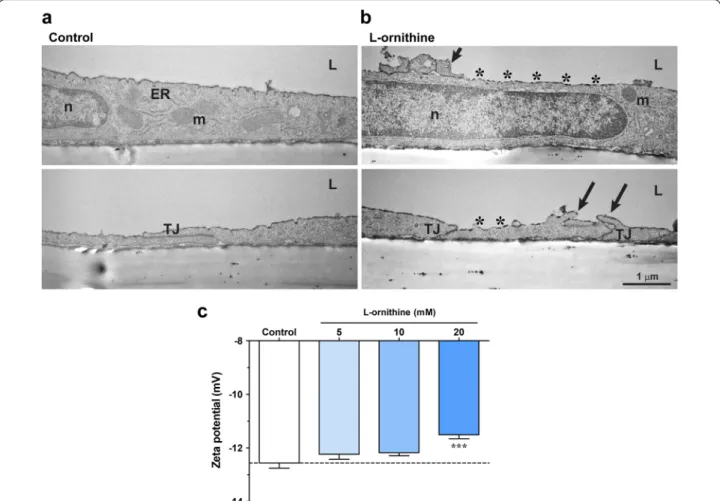
Tissue samples from the pancreas and the brain of AP rats were also analyzed using TEM. To visualize the nega- tively charged glycocalyx, the animals were perfused with a solution containing Alcian blue, a cationic dye.
In the vehicle-treated animals, the glycocalyx lining the lumen of microvessels was clearly visible and formed a continuous coverage in the pancreas (Fig. 3). Intercel- lular junctions were continuous and intact, and there were no ultrastructural changes in any major cellular components, such as mitochondria, nuclei or basal mem- brane. The morphology of the perivascular acinar cells in the pancreas showed no alterations. In the AP group, we observed microvessel and endothelial cell deformi- ties (Fig. 3) as well as severe endothelial ultrastructural damage (Additional file 1: Fig. S1). The pancreatic tissue showed signs of edema and necrosis with damaged mito- chondrial structure (Additional file 1: Fig. S1).
In the brain, we noticed changes indicating barrier integrity damage in endothelial cells in AP: (i) discon- tinuity in the surface glycocalyx staining, (ii) appear- ance of the cationic Alcian blue on the abluminal side of the capillaries suggesting leaky tight junctions, (iii) damaged basal lamina, (iv) swollen glial endfeet (Fig. 3). In the endothelial cells of brain cortex capil- laries, the luminal surface was mostly smooth and pro- trusions were present in the third of images from both
healthy and AP groups (Table 1). The surface glycoca- lyx of brain capillaries, visualized by the cationic dye Alcian blue showed a discontinuous pattern in 69% of the cases of AP animals, while glycocalyx was intact in healthy rats. Only intact TJ profiles were found in brain capillaries from control rats. In AP most of the TJs were also intact, we found only 14% altered (dis- continuous or open) TJs (Table 1). Mitochondria with altered morphology, including less-well defined or not visible cristae and swollen areas were only observed in rats with L-ornithine-induced AP. In AP vacuolization was found in 85% of endothelial cells (Table 1), a 2.5- fold increase as compared to the control group. The basal membrane showed an intact morphology in the control group, while in AP rats basal membrane thick- ening, uneven or irregular profile was observed along with Alcian blue leakage to the surrounding tissue in 66% of the analyzed images (Table 1), indicating BBB disruption. Other ultrastructural changes in brain cap- illaries in the AP group included condensation of het- erochromatin in the nucleus of endothelial cells and
increase in the gap between the glial endfeet and brain endothelial cells reflecting also basal lamina damage.
We found microvessel damage in both tissues on the ultrastructural level in AP, interestingly not only in the pancreas, but also in the brain. We suggest that capil- lary endothelial cell damage in AP can be linked to the observed permeability elevation.
l‑ornithine decreases metabolic activity and impedance of cultured brain endothelial cells
To explore, if l- ornithine has a direct effect on endothe- lial cells that might contribute to the observed increased brain extravasation and cerebral endothelial damage observed in the rat AP model, we investigated differ- ent concentrations (1–40 mM) of l- ornithine on cell viability, function and morphology of rat primary brain endothelial cells. First, the metabolic activity of primary rat brain endothelial cells was evaluated. The biologically inactive enantiomer of the amino acid, d-ornithine was also tested. MTT dye conversion decreased only at the highest, 40 mM concentration of l-ornithine after 24 h
Fig. 1 Extravasation of sodium fluorescein and Evans blue‑labeled albumin in the a brain cortex, b pancreas, c liver and d lung of rats injected with saline and animals with l‑ornithine‑induced acute pancreatitis. Values are given as nanogram dye permeability / miligram tissue and are presented as means ± SEM, n = 6. Statistical analysis: two‑way Anova followed by Bonferroni post‑test, ***, p < 0.001
treatment, while d-ornithine had no effect on the meta- bolic activity of endothelial cells (Fig. 4a). The impedance measurement showed that 24 h treatment with 20 mM l-ornithine had a mild effect, and both l- and d-ornith- ine decreased the impedance of cell layers at 40 mM con- centration. A significant difference was found between the effects of d- and l-ornithine in this assay both at 20 mM and 40 mM concentrations. Since the 40 mM
concentration decreased metabolic activity and imped- ance, we decided to carry on all further experiments with the 20 mM concentration.
l‑ornithine decreases barrier integrity in a triple co‑culture blood–brain barrier model
We investigated the effects of l- and d-ornithine (20 mM, 24 h) on the barrier integrity of a primary cell-based tri- ple co-culture BBB model. We found that l-ornithine treatment caused a decrease in the TEER along with elevated SF and EBA flux across the model compared to the control group (Fig. 5). d-ornithine treatment only showed a mild elevation in the SF permeability which was not corroborated by an elevation in EBA permeabil- ity or decreased TEER (Fig. 5). Since the effect of d-orni- thine treatment was significantly milder compared to that of l-ornithine and similar to the control group both in the viability assays and in the barrier integrity stud- ies, we decided to focus on only l-ornithine in further experiments.
l‑ornithine alters the distribution of junctional associated molecules and elevates Vcam‑1 expression
To confirm the barrier integrity decreasing effects of l-ornithine we performed immunostaining for trans- membrane (claudin-5 and occludin) and cytoplasmic Fig. 2 Relative gene expression changes of cationic amino acid
transporter‑1 (Cat-1/Slc7a1) measured by qRT‑PCR in different organs from rats with acute pancreatitis. Expression levels were normalized to Hrpt-1 mRNA expression in the liver of the untreated group. Values presented are means ± SEM, n = 3–6, one‑way ANOVA, Bonferroni test, *p < 0.05 compared to the 0 h time point
Fig. 3 Representative transmission electron micrographs of pancreas and brain from rats injected with saline (control) and animals with acute pancreatitis induced by l‑ornithine (n = 4). The negatively charged surface glycocalyx was labeled with the cationic dye Alcian blue. A acinar cells, AB Alcian blue, BM basal membrane, ER endoplasmic reticulum, G glial endfeet, L vessel lumen, m mitochondria, n nucleus, P pericyte, TJ intercellular tight junction. Black arrows in the l‑ornithine‑treated pancreas group point to plasma membrane deformities on the luminal surface of endothelial cells. Stars in the l‑ornithine‑treated brain group label discontinuities of the luminal surface glycocalyx. Scale bars: 500 nm or 1 µm
linker (ZO-1 and β-catenin) junctional molecules in pri- mary brain endothelial cells (Fig. 6a). In the control group staining of junctional proteins were located to the cell borders and the cells displayed typical, elongated mor- phology. After l-ornithine treatment we found disconti- nuity and alterations in the immunostaining of junctional proteins (Fig. 6a). Subcellular localization of the junc- tional molecules was analyzed with fluorescence intensity measurements (Fig. 6b). TJ associated molecules ZO-1 and β-catenin showed cytoplasmic redistribution, indi- cated by the decreased junctional/cytoplasmic ratio of the staining compared to the control. In addition to the changes in the junctional morphology, elevation of the
Vcam-1 staining intensity was seen in the l-ornithine treated group, while no change was measured for the Icam-1 expression.
l‑ornithine treatment increased reactive oxygen species production and induced mitochondrial network disorganization in cultured brain endothelial cells
To reveal the reason of the decreased cell viability and barrier integrity in primary rat brain endothelial cells after l-ornithine treatment (20 mM, 24 h) oxidative stress within the cells was investigated. We observed elevated ROS generation within the cells compared to the control group, while no change was seen in case of the
Fig. 4 The effects of l‑ and d‑ornithine (l‑orn and d‑orn, 1–40 mM, 24 h) on the cell viability of primary brain endothelial cells. Control groups received only culture medium. The bar charts show the results of a MTT assay, n = 4–28 and b real‑time impedance measurement, n = 8. Values presented are means ± SEM, statistical analysis: two‑way Anova followed by Bonferroni post‑test, ***, p < 0.001
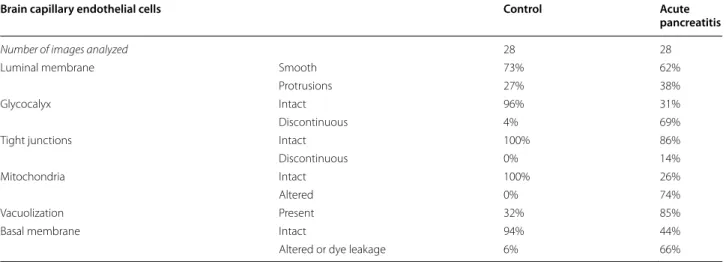
Table 1 Summary of changes in the ultrastructure of capillary endothelial cells in the brain cortex of rats with acute pancreatitis induced by l‑ornithine
Values are shown in percentage of the analyzed images in the groups
Brain capillary endothelial cells Control Acute
pancreatitis
Number of images analyzed 28 28
Luminal membrane Smooth 73% 62%
Protrusions 27% 38%
Glycocalyx Intact 96% 31%
Discontinuous 4% 69%
Tight junctions Intact 100% 86%
Discontinuous 0% 14%
Mitochondria Intact 100% 26%
Altered 0% 74%
Vacuolization Present 32% 85%
Basal membrane Intact 94% 44%
Altered or dye leakage 6% 66%
NO species (Fig. 7). Since we also noted mitochondrial changes in the TEM study, the mitochondrial network integrity was also visualized using Mitotracker staining.
The originally continuous network became fragmented after l-ornithine treatment similarly to the well-known mitochondrial chain uncoupler cyanide agent (Fig. 7c, d). No change was measured in the mitochondrial mem- brane potential neither after short-term or prolonged treatment with l-ornithine (see Additional file 1: Fig.
S2.) Neither did we find any change in the NF-κB nuclear translocation after l-ornithine treatment (see Additional file 1: Fig. S3).
l‑ornithine‑induced glycocalyx damage and zeta potential changes in cultured brain endothelial cells
Similarly to the in vivo study, we were curious about the ultrastructural changes in primary brain endothelial cells after l-ornithine treatment (20 mM, 24 h). We found
major ultrastructural changes compared to the control group: (i) surface glycocalyx discontinuity visualized by Alcian blue, (ii) altered mitochondrial morphology and (iii) increased number of vesicular profiles associ- ated with the plasma membranes (Fig. 8a-b; Table 2).
Cultured brain endothelial cells showed a healthy mor- phology in the control group. The luminal endothelial surface was smooth, with protrusions in about the third of the cases (Table 2), similarly to the in vivo observa- tions (Table 1). In 90% of the analyzed control cells a strong and continuous glycocalyx staining was observed, while the l-ornithine treated group showed in more than 70% of the cases a weak or discontinuous surface glyco- calyx pattern (Table 2), corroborating the in vivo find- ings (Table 1). While TJs and mitochondria were intact in the control cells, junctional discontinuity (22%) and mitochondria with ultrastructure changes (47%), less or disappeared cristae, spherical shape, were detected in the l-ornithine treated group (Table 2). There was only a moderate increase in the vacuolization of l-ornithine treated cells as compared to the control group. We found a pronounced alteration in the number of vesicular pro- files at the luminal and abluminal membranes of the cells (Table 2). The average amount of vesicles associated to the plasma membranes in the images was significantly higher in the l-ornithine treated group, especially at the abluminal membrane.
Since we previously found that surface glycocalyx changes are directly linked to the changes of surface zeta potential [36, 37], we investigated the effect of the cati- onic l-ornithine treatment (5–20 mM) on the negative zeta potential of brain endothelial cells. We found that the effect of l-ornithine was concentration dependent, and the cells’ zeta potential became significantly more positive after the treatment with the highest, 20 mM con- centration, suggesting a direct interaction with the cell surface (Fig. 8c).
Discussion
CNS complications are observed in about one tenth of all severe AP cases [8]. In recent years, more and more clinicians described case studies of posterior reversible encephalopathy syndrome emerging during or after AP [38, 39]. Prompt recognition and treatment can lead to better survival and good prognosis among these patients [40]. Therefore, to understand the role of BBB, as a poten- tial site of damage leading to neurological symptoms is of high clinical importance also during AP.
Here we characterized the permeability and morpho- logical changes in rat microvessels using the l-ornithine- induced non-invasive AP model (Fig. 9). We found that blood vessels in the brain cortex and pancreas of rats with AP were highly permeable for the small molecular Fig. 5 The effects of l‑ and d‑ornithine (l‑orn and d‑orn, 20 mM,
24 h) on the permeability of the triple BBB co‑culture model. a Schematic drawing of the triple BBB co‑culture model assembled from primary rat endothelial cells, brain pericytes and astroglia cells. b Transendothelial electrical resistance (TEER) measurement across the model, n = 3. c Permeability for sodium fluorescein (376 Da), n = 4–5;
d Permeability for Evans blue‑labelled albumin (67 kDa), n = 4–5.
Control groups (C) received culture medium. Values presented are means ± SEM. Statistical analysis: one‑way Anova followed by Bonferroni post‑test, *, p < 0.05; ***, p < 0.001. Permeability is expressed as endothelial permeability coefficient (Pe)
weight tracer fluorescein, but not for the larger tracer albumin, pointing to a higher paracellular permeabil- ity. No changes in marker molecule extravasation were observed in the liver or the lung. Previously, our labora- tory described decreased BBB integrity in the taurocholic acid induced AP rat model for both albumin and fluores- cein [12]. Other groups have also observed BBB leakage in animal AP models: albumin flux increase was seen in a sodium choleate infusion model [41], an l-arginine i.p. injection study [42], and another taurocholate model [43]. These corroborate our findings and show that both in the invasive and non-invasive severe rat AP models BBB integrity is compromised.
In the cationic amino acid l-ornithine-induced AP model, vessel leakage was only identified in the brain
and the pancreas. Therefore, our aim was to identify, why only these two organs were the most affected in our model, since in other models of AP induced by cerulein or taurocholate, lung vessel [44, 45] and gastrointestinal permeability elevation [46] also occurred. The transport of l-ornithine is exclusively mediated by cationic amino acid transporter family y+ in the brain, specifically, the Cat-1 transporter [47]. The system y+ has the highest affinity for arginine, followed by lysine and ornithine [47].
It is known that Cat-1 is highly expressed at the BBB both in vivo and in vitro [48–51] and in the human pancreas, but low or no expression is found in the liver or lung [52].
These literature data correlate with our findings about the basal Cat-1 gene expression (Fig. 2). We found that in the l-ornithine-induced AP model, Cat-1 gene expression Fig. 6 Effects of l‑ornithine (l‑orn, 20 mM, 24 h) on junctional morphology and adhesion molecule expression. a Representative
immunofluorescent pictures of transmemebrane tight junction proteins claudin‑5 (Cl‑5) and occludin (Occl), junctional associated molecules zonula occludens‑1 (ZO‑1) and β‑catenin (β‑cat), and cell adhesion molecules intercellular adhesion molecule‑1 (Icam‑1) and vascular cell adhesion molecule‑1 (Vcam‑1). Arrows point to membrane perturbations, stars indicate monolayer discontinuity. C: control. Scale bar: 20 µm for junctional stainings and 25 µm for Icam‑1/Vcam‑1. b Ratio of the junctional and the cytoplasmic immunostaining intensities. Random pictures (4–5 images/
sample), from 2–3 different experiments (n = 15–25) were compared. c Fluorescence intensity of cell adhesion molecules Icam‑1 and Vcam‑1.
Random pictures (4–5 images/sample), from 2 different experiments (n = 18–28) were evaluated. Values presented are means ± SEM, statistical analysis: unpaired t‑test. *, p < 0.05; ***, p < 0.001
levels were elevated in brain microvessels and in the pan- creas, the organs which showed an elevated vessel per- meability for fluorescein. No change was found in Cat-1 expression of the liver and lung, where no extravasation of the marker molecules was measured. Therefore, we hypothesize, that in the current AP model the presence of l-ornithine in the blood and its direct interaction with and Cat-1 mediated uptake into the cells of BBB, brain and pancreas causes a higher sensitivity to permeability elevation and subsequent edema.
To characterize the ultrastructural changes in the brain and the pancreas, TEM was performed on vehicle treated and AP animal groups. Inflammation, organ failure and edema are well-known in AP [5, 6]. Here we also detected by TEM damaged mitochondria, tissue edema and necro- sis, as well as severe endothelial injury in the pancreas.
These observations are in concordance with previous
observations on tissue necrosis, especially in pancreatic acinar cells, along with the presence of apoptotic bod- ies in the same AP model [14]. Similar observations were made on damaged mitochondria and swollen capillaries in the pancreas of cerulein-induced AP model [53, 54].
Irregularities in endothelial lining in the pancreas capil- laries were found in a canine AP model using electron microscopic analysis [55].
Systemic inflammation affects the BBB in various dis- eases resulting in CNS pathologies [56]. BBB dysfunction and increased permeability have been well described in AP models, yet, ultrastructural changes at the level of brain microvessels in AP have not been studied in detail.
In l-ornithine-induced AP we observed changes in mito- chondria ultrastructure, vacuolization, damage of the basal lamina and Alcian blue leakage in endothelial cells of brain capillaries. Swollen glial endfeet surrounded the Fig. 7 Effects of l‑ornithine (l‑orn, 20 mM, 24 h) on the general oxidative state of cultured primary brain endothelial cells. a Reactive oxygen species production measurement using the DCFDA reagent. In this assay hydrogen peroxide (H2O2, 100 µM) was used to induce oxidative stress. n = 5–12.
b Nitric oxide (NO) production was detected by using the DAF‑FM diacetate reagent. In this assay sodium nitroprusside (SNP, 100 µM) was used as NO donor. n = 8. c Mitochondrial network continuity calculation using Matlab software. Continuous signal lengths were measured and divided by all object number detected to result in the average length of objects. n = 9–19. Cyanide agent (CCCP, 5 µM) was used to decouple mitochondrial networks. d Representative pictures of the mitochondrial network staining using the Mitotracker green labeling. Blue: cell nucleus. Bar: 10 µm.
Control groups (C) received only culture medium. On all graphs, values are presented as means ± SEM. Statistical analysis: one‑way Anova followed by Bonferroni post‑test, *, p < 0.05; ***, p < 0.001
Fig. 8 a Transmission electron micrographs of primary rat brain endothelial cells kept in a triple BBB co‑culture model. Effect of l‑ornithine (l‑orn, 20 mM, 24 h) treatment was investigated on the ultrastructural changes. The negatively charged surface glycocalyx was labeled with the cationic dye Alcian blue. ER: endoplasmic reticulum, L: luminal side, m: mitochondria, n: nucleus, TJ: intercellular tight junction. Black arrows in the l‑ornithine treated group point to plasma membrane deformities. Asterisks show irregular glycocalyx staining by Alcian blue. Bar: 1 µm. b Effect of direct
l‑ornithine (l‑orn, 20 mM) treatment on the surface charge of cultured rat primary brain endothelial cells. Values presented are means ± SEM.
n = 3–10 with a total of 15–111 rounds of measurements. Statistical analysis: one‑way Anova followed by Bonferroni post‑test, ***, p < 0.001 Table 2 Summary of changes in the ultrastructure of l‑ornithine treated cultured brain capillary endothelial cells
Values are shown in percentage or ratio of the analyzed images in the groups. Vesicular profile: mean ± SD, unpaired t-test; *, p < 0.05; ***, p < 0.001
Cultured brain endothelial cells Control l‑ornithine
Number of images analyzed 29 48
Luminal membrane Smooth 74% 67%
Protrusions 26% 33%
Glycocalyx Continuous 89% 29%
Discontinuous 11% 71%
Tight junctions Intact 100% 78%
Discontinuous 0% 22%
Mitochondria Intact 97% 53%
Altered 3% 47%
Vesicular profiles / image Luminal membrane 5.9 ± 4.3 8.7 ± 4.5*
Abluminal membrane 2.2 ± 1.5 5.9 ± 3.8***
Vesicular profiles ratio Luminal membrane 73% 60%
Abluminal membrane 27% 40%
Vacuolization Present 14% 27%
affected microvessels. These morphological changes of microvessels were very similar to those we found in the pancreas of rats in the current l-ornithine-induced AP model. In addition, as a novel approach, we also focused on the changes of the glycocalyx, which is present on the surface of vascular endothelial cells and regulates their functions [57]. This sugar–protein mesh covering the surface of brain capillaries is one of the thickest in the cardiovascular system and forms an important physico- chemical barrier at the BBB [23, 58]. In our AP model, we visualized the glycocalyx with the cationic probe Alcian blue, which binds to the highly negatively charged glyco- calyx residues and due to its copper content can be vis- ualized by TEM [59]. We observed discontinuity of the endothelial surface glycocalyx staining both in the brain
cortex and the pancreas microvessels in the AP group.
In addition, in the brain capillaries Alcian blue staining appeared on the abluminal side of the brain endothelial cells in the disease model, indicating a barrier leakage which is in agreement with the observed increase in per- meability for fluorescein in the present model.
Our results suggest a more pronounced endothelial damage on the ultrastructural level in the pancreas than in the brain. One of the possible explanation can be that brain capillaries are more robust than microvessels of other organs due to the thicker glycocalyx on the surface of brain capillary endothelium, as it was described in a mouse study [60]. After treatment with bacterial lipopol- ysaccharide brain microvessels showed the most intact glycocalyx and low permeability for albumin, while in the Fig. 9 Schematic diagrams of the BBB in vivo (a) and brain endothelial cells in vitro (b) highlighting the most characteristic changes detected after the induction of AP with l‑ornithine (a) and after the direct treatment of brain endothelial cells with l‑ornithine (b)
heart and the lung the endothelial surface glycocalyx dis- appeared or was much sparser and a higher permeability to albumin was measured [60]. This is in agreement with our observations on the permeability and ultrastructural changes in brain and pancreas microvessels in the present rat AP model. Both our results and the mouse study high- light the glycocalyx as a specific protective mechanism at the BBB in systemic inflammation and pathologies.
Several factors were identified contributing to the pathomechanism of AP and AP models. Elevation of cytokine levels is observed in animal models of AP [12]
including the l-ornithine-induced AP model [14] used in our study, as well as in patients at the early phase of AP [61]. Cytokines are well-known potent mediators to increase the permeability of the BBB [62–64]. In addi- tion, in severe AP pancreatic enzymes released to the circulation affect both BBB and brain functions. Elevated levels of serum trypsin activate phospholipase A2, which converts pancreatic lecithins and cephalins to toxic iso- forms, which damage the BBB by destroying membrane phospholipids, and facilitate demyelination [65]. A fur- ther proof of this hypothesis is that antiphospholipase A2 activity is linked to cerebrovascular protection and atten- uation of BBB damage and vasogenic edema formation in animal models of neurological diseases [66, 67]. The trypsin-induced changes, together with elevated blood levels of lipase, elastase and amylase coexacerbate brain edema and CNS dysfunction [68]. In the l-ornithine model, pancreatic edema is visible already after 6 h of the treatment, when trypsin and amylase activity increases, and NF-κB activation and tissue necrosis is detect- able [14, 19]. Thus, according to previous observations cytokine release, excessive pancreatic enzyme produc- tion and activation of different signal transduction path- ways can be identified as possible players contributing to BBB dysfunction and barrier opening in AP animal mod- els and in patients. We hypothesized that besides these mechanisms l-ornithine as a cationic amino acid might exert a direct effect on brain endothelial cell integrity and functions contributing to BBB changes. Therefore, we aimed to reveal the direct effect of l-ornithine treatment on rat brain capillary endothelial cell function and mor- phology using a primary cell based culture model (Fig. 9).
First, we measured cell viability after direct l-ornith- ine treatment, which has not yet been studied on pri- mary rat brain endothelial cells. Supposing a uniform tissue distribution, we estimated that with the injection of 3 g/kg l-ornithine, the levels of this amino acid can reach ~ 20 mM concentration in tissues right after injec- tion. We selected the 20 mM concentration based on this in vivo Cmax estimation. l-ornithine at 20 mM concentra- tion for 24 h caused a mild, but significant decrease in impedance, but it did not change the metabolic activity
of the cells. In concordance with our findings, in a cell culture study l-ornithine at 10 mM concentration had no effect on the metabolic activity of retinal pigment epi- thelial cells [69]. Furthermore, l-ornithine, as an orally administered everyday nutritional additive, has been found effective to reduce stress and fatigue in human vol- unteers [70, 71].
Using the triple BBB co-culture model, we observed a barrier integrity change after l-ornithine treatment both for the electrical resistance and marker molecule permeability. Decrease in TEER on cultured brain capil- lary endothelial cells following treatment with lysine and arginine, cationic amino acids, was already reported in the 0.2–200 mM concentration range [72]. Permeability changes have not yet been studied before after l-orni- thine treatment on cultured brain endothelial cells. We found that in agreement with our rat experiments, the flux of fluorescein was elevated on the triple BBB co-cul- ture model. In addition, an increase in albumin perme- ability was also seen on the in vitro model. These findings correspond to the observed TEER decrease. The morpho- logical data also support the functional barrier integrity results. Discontinuity of the immunostaining for clau- din-5, occludin, ZO-1 and β-catenin was detected at the intercellular junctions. A decrease in the junctional/cyto- plasmic ratio of the fluorescence intensity of ZO-1 and β-catenin indicates the redistribution of these linker pro- teins from the plasma membrane to the cytoplasm. This change suggests TJ perturbation, as we already observed in our recent study [33] and is in concordance with the central role of ZO-1 and β-catenin as nuclear signaling proteins in barrier regulation in endothelial cells [20, 73].
l-ornithine treatment elevated the expression of Vcam-1 pointing to endothelial cell activation, while no change was seen for Icam-1. These two adhesion molecules are activated during inflammation [74]. However, in ath- erosclerosis, as well as in TNFα-induced brain injury in murine models, the importance of Vcam-1 activation was much more substantial than that of Icam-1 [75, 76].
It was already described that in the l-ornithine-induced AP animal model beside the cytokine and enzyme level elevations mitochondrial injury, NO and the activation of NF-κB signaling also contribute to the development of AP [14, 16]. Our aim was to test whether l-ornithine has a direct effect on any of these mechanisms in brain endothelial cells. No change in NO levels or NFκB nuclear translocation after l-ornithine treatment was found, therefore, in the in vitro study NO or the activa- tion of the NFκB signaling pathway probably are not the cause of the l-ornithine-induced decrease in brain endothelial cell barrier integrity. On the contrary, l-orni- thine caused a significant elevation in ROS production in primary brain endothelial cells. Corresponding to our