Environmental Engineering and Management Journal April 2020, Vol. 19, No. 4, 625-634 http://www.eemj.icpm.tuiasi.ro/; http://www.eemj.eu
“Gheorghe Asachi” Technical University of Iasi, Romania
ELEMENTAL PROFILE OF NON-COMMERCIAL WINES IN CHANGING TRADITIONAL RURAL REGIONS FROM EASTERN EUROPE
Xintia Odett Dembroszky
1, Zoltán May
2, Tibor Hartel
1,3, Andreea-Rebeka Zsigmond
1∗1Environmental Science Department of the Sapientia Hungarian University of Transylvania, 4 Calea Turzii, Cluj-Napoca, RO-400193, Romania
2Plasma Chemistry Research Group, Institute of Materials and Environmental Chemistry, Research Centre for Natural Sciences, Magyar tudósok krt. 2, 1117, Budapest, Hungary
3Hungarian Department of Biology and Ecology and Center of Systems Biology, Biodiversity and Bioresources (Center of “3B”), Babeş‐Bolyai University, Cluj-Napoca, Romania
Abstract
Traditional winemaking for subsistence is at the heart of rural households in traditional cultural landscapes where the bioclimatic conditions allow wine production. As these wines are typically not assessed for their elemental content, their consumers could be exposed to various contaminants. Our goals were the followings: (i) to understand the elemental composition of non-commercial traditional wines from three cultural regions of Eastern Europe (Romania) and (ii) to find the main chemical factors which contribute to the differentiation of the wines produced in these regions. Our assessment was based on 62 homemade white and red wines. We used the ICP-OES technique to analyze 21 elements. We found that the wines contained low levels of elemental pollutants. The differentiation of the wines by geographic regions using multivariate pattern recognition analysis was efficient based on magnesium (Mg), strontium (Sr), iron (Fe). Our study shows that the non-commercial wines from the traditional cultural landscapes such as those from Eastern Europe are of good quality with regard to the metallic components. Monitoring these wines will reveal important changes in the quality of these wines as the rural landscapes undergo massive social-ecological changes.
Key words: elemental analysis, geographical origin, multivariate statistics, non-commercial wines, traditional cultural landscape Received: February, 2019; Revised final: September, 2019; Accepted: November, 2019; Published in final edited form: April, 2020
1. Introduction
Vineyards are among the most characteristic elements of the traditional cultural landscapes. The wine production in rural Romania was historically present in the household activity, whenever this was bioclimatically possible. Traditional vineyards have multiple social-ecological values: from an ecological perspective, the small vineyard parcels intermixed with native vegetation elements can contribute to the landscape scale diversity of habitats (Nascimbene et al., 2016; Viers et al., 2013). From a socio-cultural perspective, traditional extensive vineyards represent
∗ Author to whom all correspondence should be addressed: e-mail: zsigmond.andrea@kv.sapientia.ro; Phone: +40 372 788 890; Fax: +40 364 410 069
important management legacies of the farming landscapes (Dougherty, 2012).
The chemical fingerprint, which in our case consists of a wide range of dissolved metals and non- metals (like B, Si) is a crucial quality feature of wines.
Chemical content of wines partly reflects the regional geochemical composition of the soil, but it can also be influenced by the management and processing interventions on grape and wine, as well as by pollution. For example, Versari et al. (2014) in their review showed that elements including alkaline metals (e.g. lithium (Li), rubidium (Rb), cesium (Cs)), alkaline earth metals (e.g. Mg, calcium (Ca), Sr, barium (Ba)), and some lanthanides in wines would
strongly reflect the geochemical composition of the soils where the grapes were produced. Other elements would accumulate in wines due to management interventions in the vineyard, including the application of fertilizers (increasing the potassium (K), phosphorus (P), Ca concentrations), pesticides and fungicides (increasing the concentrations of cadmium (Cd), copper (Cu), manganese (Mn), lead (Pb) and zinc (Zn)), or due to environmental pollution such as that caused by road traffic or industrial facilities (especially Cd and Pb) (Fang, 2016; Pohl, 2007).
Furthermore, the wine production process (i.e. the use of tools, vessels, machinery) can also lead to the accumulation of certain elements in the wine, such as aluminium (Al), Cd, chromium (Cr), Cu, Fe, Zn (Gomes et al., 2019). The chemical treatment of the wines can further increase the concentration of sodium (Na), Ca, Al (Castineira Gomez et al., 2004; Kment et al., 2005; Lara et al., 2005). Pérez-Álvarez et al.
(2019) showed that Mg, Cu and Pb levels increased in wines when SO2 was used in winemaking.
Importantly, certain elements have powerful discriminating properties for wines, both regarding their geographic origins (e.g. Mg, Mn, Sr, Li) and treatment (e.g. Ca, Al, Zn, Cr) (Fabani et al., 2010;
Kruzlikova et al., 2013; Rodrigues et al., 2011;
Sperková and Suchánek, 2005). These elements are potentially good candidates as components of wines for biomonitoring the soil and the human influenced environment, generally.
Romania is particularly important country for addressing chemical characterization of wines. First, Romania is a notable wine producing country at international scale, being classified as the thirteenth country of the world and the seventh country at European level (OIV, 2019a). There are a considerable number of studies addressing the geographical origin identification of Romanian wines based on elemental composition; these studies focus on certified wine producers. Some studies provide a national-level assessment of wines, not explicitly comparing the different regions of Romania within the same methodological framework (Capron et al., 2007;
Forina et al., 2009, Römisch et al., 2009; Smeyers- Verbeke et al., 2009). Geana at al. (2013, 2014) provide information about geographical origin identification on a regional scale of wines coming from the southern, eastern and southwestern part of the country. Moreover, Romania have outstanding traditional farming landscapes in terms of traditional practices (which still involves low chemical input), high biodiversity and nearly half of the population of this country living in rural areas, performing semi- subsistence agriculture (Fischer et al., 2012).
However, the massive social-ecological changes are reflected mainly in the economic growth and the human flow from the rural to the urban environment, which have negative impacts on the traditional, small- scale (subsistence) wine production. First, because the number of the small winemakers is decreasing, second, because many producers switch to the new technology, and third, because of the use of new
agrochemicals applied to the agricultural sites next to the vineyards can contaminate the soil and the vine.
Wine production for local, non-commercial (subsistence) consumption is still common in the rural communities of Romania. The small-scale, traditional process explained by the winemakers consisted of several steps. The grapes were hand-picked, then carefully sorted in order to keep only the healthy berries, the bunches were placed in wooden, stone or stainless steel tanks for fermentation. In some localities, the red grapes were foot-trodden so that the color and flavor components could be released from the skin into the juice. After fermentation has taken place, the remains of the skins and stems were removed by pressing. At this step a basket press made of wood was typically used by the winemakers. Then the wine was transferred to, and stored in barrels, generally made by oak. Some winemakers stored the wine in glass bottles. Occasionally, chemicals were added to the wine, like bentonites, silicon dioxide, potassium metabisulfite.
As the traditional wines typically are not assessed from the perspective of chemical quality, their users may be vulnerable to various contaminants accumulated in the grape. For example, groundwater, which is still used for consumption in several rural regions of Romania accumulating nitrates due to changing land-use, making its consumers vulnerable (Hartel et al., 2014; Muntean and Mihaiescu, 2016). In such conditions, it is imperative to understand the chemical profile of this important provisioning ecosystem service in order to create a baseline dataset against which further studies can be used as comparison.
The main goal of the present paper is to contribute to the understanding of elemental composition of wines produced by the traditional rural communities of Romania by (i) comparing wines from three cultural and bioclimatic regions of Romania:
Transylvania (central Romania), Crișana (western Romania) and Maramureș (north-western part of Romania) and (ii) explored the main factors which contribute to the differentiation of the wines produced in these vine regions based on the elemental composition of wines. While our research is conducted in three distinct cultural regions of Romania, we are confident that our methodology could be applied in other developing countries and regions from Eastern Europe and beyond.
2. Material and methods 2.1. Study regions
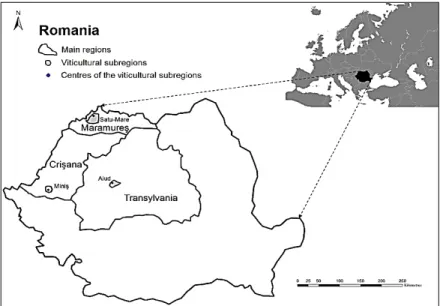
The wine samples were collected from three cultural regions of Romania: Transylvania, Maramureș and Crișana (Fig. 1.). The Transylvanian Basin (Podișul Transilvaniei) is a plateau in the center of the country, surrounded by the Eastern and Southern Carpathians and the Apuseni Mountains in the West. It lies at an average altitude of 411 m. The wine samples were collected from Aiud and its
surroundings, where the average annual temperature is 9.3 °C, and the annual precipitations vary between 600-700 mm (Oșlobeanu et al., 1991). This relatively cold and wet climate is propitious for the cultivation of white vines. The area of Aiud is characterized by phreatic, orthic luvisols (Lg 41 2/3a, FAO-UNESCO, 1981) settled in mountainous topography with a strong lithic character. These soils were formed on the sedimentary units of the Transylvanian Basin. The second sampling site was the surroundings of Satu- Mare in Maramureș region. The vineyards are situated on the slopes of the Eastern Carpathians at average altitudes of 222 m. This region has an average annual temperature of 9.7°C, and the annual precipitations vary between 500–600 mm. This region, which is warmer, enables the raising of both white and red vines. The area of Satu Mare is charecterized by alluvium-type gleysoils (Hg 7-3a, FAO-UNESCO, 1981) settled on the sedimentary units of the Pannonian Basin and the terrace sediments of the Somes River. These soils may contain signs of circulation of uprising water and evaporation, that increases soil salinity. The third wine region, Miniș, is situated in the Southern part of Crișana at an altitude of 230 m. The area of Miniș is chraracterized by alluvium type calcic chernozems of black color and high humus content (Hc 5-2/3a, FAO-UNESCO, 1981) deposited on the terrace sediments of the Mureș River. It has a specific microclimate characterized by an average annual temperature of 11.2°C, by warm and dry autumns and by annual precipitations of 500–
550 mm. This climate is suitable for the cultivation of red vine cultivars. Miniș is famous for its red wines.
2.2. Sampling and sample analysis
A total of 62 traditional wine samples were collected directly from small scale producers. We define a wine traditional if it is produced using typical, regionally characteristic, traditional methods, and importantly, from grape types characteristic for the
region. The wines were produced from grapes seasoned in 2013. We marked the samples as follows:
CW1-CW5 (n = 5 white wines samples from Crișana), CR1-CR8 (n = 8 red wine samples from Crișana), TW1-TW26 (n = 26 white wine samples from Transylvania), MW1-MW15 (n = 15 white wine samples from Maramureș) and MR1-MR8 (n = 8 red wine samples from Maramureș). The wines were made of one, sometimes of more grape cultivars (Cabernet Sauvignon, Cabernet Franc, Pinot Noir, Merlot red grape cultivars; Italian Riesling, Tramini, Feteasca Alba, Sauvignon Blanc, Muscat Ottonel grape cultivars). Volumes of 100–100 mL of samples were collected in plastic bottles and stored in dark place at 4°C a few days until further preparations.
The considerable amounts of organic matter present in wines were decomposed by acidic digestion at atmospheric pressure following the method suggested by Szentmihályi et al. (2000) for ICP-OES analyses of wines. Volumes of 25 mL of wine samples were placed in glass beakers and evaporated to dryness, followed by digestion with 5 mL of 65%
HNO3 (Merck, Suprapur). The digests were diluted to 25 mL with ultrapure water (MilliQ Millipore) and stored in plastic bottles. The multielement analysis was carried out with a Spectro Genesis ICP-OES simultaneous spectrometer. Multielement standards (Merck, standard solutions for ICP) were used for calibration.
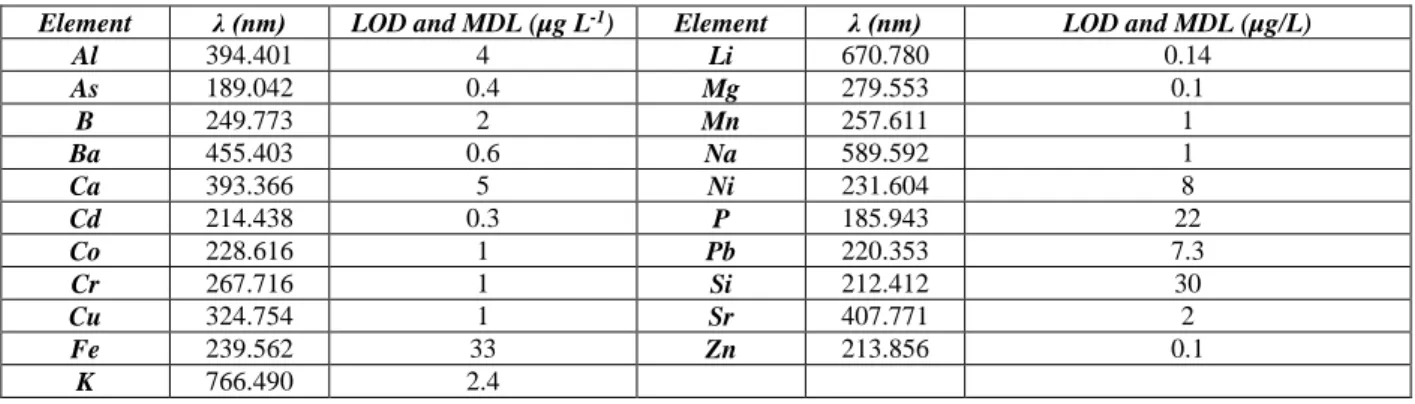
A total number of 21 elements were quantified, as follows: Al, arsenic (As), boron (B), Ba, Ca, Cd, cobalt (Co), Cr, Cu, Fe, K, Li, Mg, Mn, Na, nickel (Ni), P, Pb, silicon (Si), Sr and Zn. The limits of detection for the studied elements are listed in Table 1. The limit of detection (LOD) of the elements for the wine samples was calculated according to the formula:
blank + 3s, where s is the standard deviation of the concentration values obtained for three blank samples.
Considering the dilution factor equal to one for the wines, the method detection limits were equal with the LODs.
Fig. 1. The studied wine regions of Romania: Maramureș (Satu-Mare and surroundings), Crișana (Miniș) and Transylvania (Aiud and surroundings)
Table 1. Limits of detection (LOD) and the method detection limits (MDL) of the elements quantified by ICP-OES
Element λ (nm) LOD and MDL (µg L-1) Element λ (nm) LOD and MDL (µg/L)
Al 394.401 4 Li 670.780 0.14
As 189.042 0.4 Mg 279.553 0.1
B 249.773 2 Mn 257.611 1
Ba 455.403 0.6 Na 589.592 1
Ca 393.366 5 Ni 231.604 8
Cd 214.438 0.3 P 185.943 22
Co 228.616 1 Pb 220.353 7.3
Cr 267.716 1 Si 212.412 30
Cu 324.754 1 Sr 407.771 2
Fe 239.562 33 Zn 213.856 0.1
K 766.490 2.4
2.3. Statistical analysis
Before the statistical analysis, the concentration data were z-transformed (to average of zero and standard deviation of unity) in order to reduce the magnitude of differences between the concentrations and thus make the data comparable.
For every region we tested the normal distribution of the variables (i.e. the concentration of elements across the samples) using Shapiro-Wilk test. The outliers were detected using the box-and-whiskers plots (values falling under Q1 – 1.5 IQR and beyond Q3 + 1.5 IQR, where Q1 and Q3 signifies the first and third quartile, the IQR meaning the interquartile range).
Following this, we applied multivariate analyses for those elements, which were normally distributed.
In order to reveal the underlying structure of our variables we used the Principal Component Analysis (PCA). PCA is widely used to reduce the number of variables to a smaller number of orthogonal principal components (Arvanitoyannis et al., 1999).
The Kaiser-Meyer-Olkin (KMO) test allowed us to sort out the most appropriate variables for the PCA.
We maintained the variables which had a measure of sample adequacy greater than 0.50.
We used Linear Discriminant Analysis (LDA) and k-nearest neighbors (KNN) supervised pattern recognition methods for the geographical discrimination of wines, as several research studies proved their efficiency when used on elemental profile of wines (Arvanitoyannis et al., 1999).The LDA has the advantage to be robust and well stable, even applied on small databases, but it is sensible to the multivariate normal distribution of the variables and to the equality of covariance matrices, meanwhile KNN is independent of these criteria. With regard to the applicability of the LDA we used the Mardia’s test for the multivariate normal distribution of the dataset and the boxM’s test for the equality of covariance matrices. Prior to apply the supervised methods we performed the one-way-ANOVA on the dataset in order to find the most powerful discriminating variables between vine regions according to wine types by means of the Fisher’s F value. We tested the prediction ability of the models with cross-validation.
The overall error rate was given by the mean value calculated over 10 test sets, and expressed by a percent. The more the error rate is close to zero, the
better the prediction of the model. The statistical analyses were performed with R software (version 3.2.1, R Foundation for Statistical Computing).
2.4. References for the evaluation of wine quality
We referred to a wine as of good quality when it contained low levels of elemental pollutants (As, B, Cd, Cu, Pb, Zn) and relatively high concentrations of elements essentials for the human body (Ca, Mg, Fe, Mn). This was evaluated using two references: (i) the maximum admissible levels (MAL) given by the Organisation Internationale de la Vigne et du Vin, OIV (OIV, 2019b) for the major pollutants that might be present in the wines, and (ii) the adequate daily intake (AI) values given by the European Food Safety Authority (EFSA) for the metals essentials for the human body. These values were related to the metal quantities in 100 mL wine. The MALs are given in Table 2. The AI values (men/women) were the followings: 950 mg for Ca, 11/16 mg for Fe, 300/350 mg for Mg and 3 mg for Mn. We carried out the comparison with the commercialized wines relying on literature data.
3. Results and discussion
3.1. Elemental composition of the wines
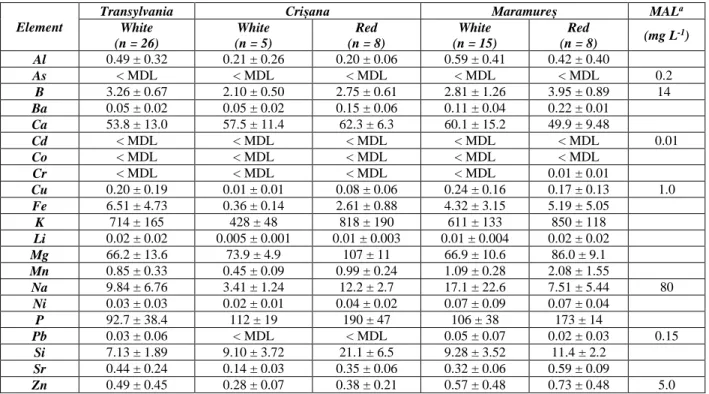
Table 2. provides descriptive statistics for the 21 elements in wines. We did not detect As, Co and Cd, while Pb was detected only in 37% of the samples.
Elements like Al, Cr, Cu, Ni, Pb, Zn exhibited several outlying concentration values, especially in the higher concentration range. The maximum admissible levels given by the OIV (2019b) (Table 2.) were exceeded in three white wine samples for Pb (0.20 mg L-1 in MW1, 0.24 mg L-1 in MW3, 0.16 mg L-1 in TW1 and 0.28 mg L-1 W11), and in four white wine samples for Cu (1.24 and 1.27 mg L-1 in MW3 and MW6, and 2.18, 1.16, 1.76 mg L-1 in TW1, TW7, TW12). The elevated Cu concentrations could be explained by the use of copper-based pesticides, as declared by the winemakers. We found that the wines produced in the northwestern and central part of Romania contained low levels of elemental pollutants. The slightly elevated concentrations of some metals (Al, Cu, Ni, Zn) in several samples are likely due to the human
impact over the raising of grape vines and wine making processes. In a recent study, where grape pulp, skin and seed were analyzed for some metals, they did not found any Al and Ni in the samples (Gomes et al., 2019). Red wines contained notable amounts of Mg (in 100 mL there was about 2.5–3% of the AI given by the EFSA), meanwhile, the white wines, except for those from Crișana, were rich in Fe, containing 5.0–
7.5% of the recommended adequate intake in 100 mL.
The red wines from both regions were richer in Mn than the white wines. An aliquot of 100 mL of these red wines contained on average 3-6% of the AI given for Mn. A possible explanation for the higher Fe levels and lower Mn levels in the white wines compared with the red wines could be the higher Fe content and lower Mn content in the pulp of the white grape varieties than that of the red ones. A recent study showed that the pulp of the white grape varieties might contain 10 times more Fe and slightly lower concentrations of Mn than of the red grape varieties coming from the same viticulture (Gomes et al., 2019).
The comparison with the European, Australian and South American commercialized wines revealed relatively high Fe levels in our samples (Fabani et al., 2010; Frías et al., 2003; Lara et al., 2005; Pohl, 2007;
Rebolo et al., 2000; Rodrigues et al., 2011; Trujillo et al., 2011). Nevertheless, the Cu and the Cr concentrations of our samples were considerably lower than the concentrations reported in these publications. The elevated Cr content of the commercialized wines could be explained by the use of modern machinery and barrels made of stainless
steel, which contain Cr. The machinery and vessels used in the traditional winemaking are generally made of wood. The elements, like Ni, Pb, Zn showed the most striking differences in the elemental composition of commercial and traditional wines. A comparison with Romanian commercial wines coming from microvinification based on EC Regulations studied by Geana et al. (2013) revealed the same pattern: our wine samples exhibited lower Co, Cr, Cu, Ni and higher Mn concentrations. Interestingly, Gomes et al.
(2019) found no detectable Ni and Pb in both the white and red grape varieties. This can consolidate the hypothesis, that the production process is the major factor, which has influence over the accumulation of these metals in the wine. Moreover, the Cr, Ni, Pb could be regarded as important discriminating agents between the traditional and small scale industrialized wine making crafts.
3.2. Discrimination of wines according to geographical origin
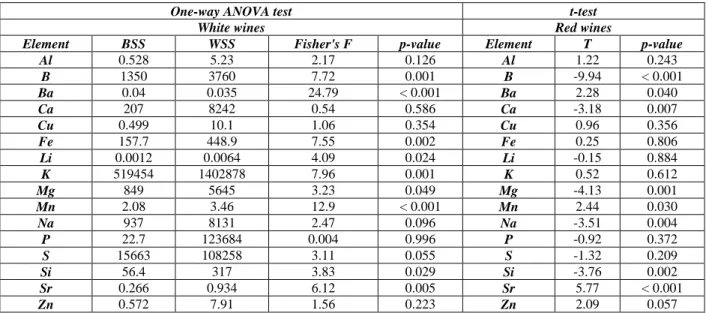
The one-way ANOVA and the t-test performed for the white wines and the red wines by region highlighted some elements, which contributed the most to the differentiation of the wines (Table 3.).
According to the regions, we observed the most significant different average concentrations in the case of B, Ba, Fe, Mn, K and Sr for the white wines, and of B, Mg and Sr for the red wines. Neither of the wines exhibited significant differences in the average concentrations by region for Al, Cu, P, S and Zn.
Table 2. The concentration means (mg L-1) and standard deviations of the elements in the wines by region and wine type
Element
Transylvania Crișana Maramureș MALa
White (n = 26)
White (n = 5)
Red (n = 8)
White (n = 15)
Red
(n = 8) (mg L-1) Al 0.49 ± 0.32 0.21 ± 0.26 0.20 ± 0.06 0.59 ± 0.41 0.42 ± 0.40
As < MDL < MDL < MDL < MDL < MDL 0.2
B 3.26 ± 0.67 2.10 ± 0.50 2.75 ± 0.61 2.81 ± 1.26 3.95 ± 0.89 14
Ba 0.05 ± 0.02 0.05 ± 0.02 0.15 ± 0.06 0.11 ± 0.04 0.22 ± 0.01 Ca 53.8 ± 13.0 57.5 ± 11.4 62.3 ± 6.3 60.1 ± 15.2 49.9 ± 9.48
Cd < MDL < MDL < MDL < MDL < MDL 0.01
Co < MDL < MDL < MDL < MDL < MDL
Cr < MDL < MDL < MDL < MDL 0.01 ± 0.01
Cu 0.20 ± 0.19 0.01 ± 0.01 0.08 ± 0.06 0.24 ± 0.16 0.17 ± 0.13 1.0
Fe 6.51 ± 4.73 0.36 ± 0.14 2.61 ± 0.88 4.32 ± 3.15 5.19 ± 5.05
K 714 ± 165 428 ± 48 818 ± 190 611 ± 133 850 ± 118
Li 0.02 ± 0.02 0.005 ± 0.001 0.01 ± 0.003 0.01 ± 0.004 0.02 ± 0.02
Mg 66.2 ± 13.6 73.9 ± 4.9 107 ± 11 66.9 ± 10.6 86.0 ± 9.1
Mn 0.85 ± 0.33 0.45 ± 0.09 0.99 ± 0.24 1.09 ± 0.28 2.08 ± 1.55
Na 9.84 ± 6.76 3.41 ± 1.24 12.2 ± 2.7 17.1 ± 22.6 7.51 ± 5.44 80
Ni 0.03 ± 0.03 0.02 ± 0.01 0.04 ± 0.02 0.07 ± 0.09 0.07 ± 0.04
P 92.7 ± 38.4 112 ± 19 190 ± 47 106 ± 38 173 ± 14
Pb 0.03 ± 0.06 < MDL < MDL 0.05 ± 0.07 0.02 ± 0.03 0.15
Si 7.13 ± 1.89 9.10 ± 3.72 21.1 ± 6.5 9.28 ± 3.52 11.4 ± 2.2 Sr 0.44 ± 0.24 0.14 ± 0.03 0.35 ± 0.06 0.32 ± 0.06 0.59 ± 0.09
Zn 0.49 ± 0.45 0.28 ± 0.07 0.38 ± 0.21 0.57 ± 0.48 0.73 ± 0.48 5.0
aMAL is the maximum admissible level of the elements given by the Organisation Internationale de la Vigne et du Vin, OIV (OIV, 2019a)
Table. 3. The results for the average concentration of the elements in the wines according to the regions given by the one-way ANOVA and t-test
One-way ANOVA test t-test
White wines Red wines
Element BSS WSS Fisher's F p-value Element T p-value
Al 0.528 5.23 2.17 0.126 Al 1.22 0.243
B 1350 3760 7.72 0.001 B -9.94 < 0.001
Ba 0.04 0.035 24.79 < 0.001 Ba 2.28 0.040
Ca 207 8242 0.54 0.586 Ca -3.18 0.007
Cu 0.499 10.1 1.06 0.354 Cu 0.96 0.356
Fe 157.7 448.9 7.55 0.002 Fe 0.25 0.806
Li 0.0012 0.0064 4.09 0.024 Li -0.15 0.884
K 519454 1402878 7.96 0.001 K 0.52 0.612
Mg 849 5645 3.23 0.049 Mg -4.13 0.001
Mn 2.08 3.46 12.9 < 0.001 Mn 2.44 0.030
Na 937 8131 2.47 0.096 Na -3.51 0.004
P 22.7 123684 0.004 0.996 P -0.92 0.372
S 15663 108258 3.11 0.055 S -1.32 0.209
Si 56.4 317 3.83 0.029 Si -3.76 0.002
Sr 0.266 0.934 6.12 0.005 Sr 5.77 < 0.001
Zn 0.572 7.91 1.56 0.223 Zn 2.09 0.057
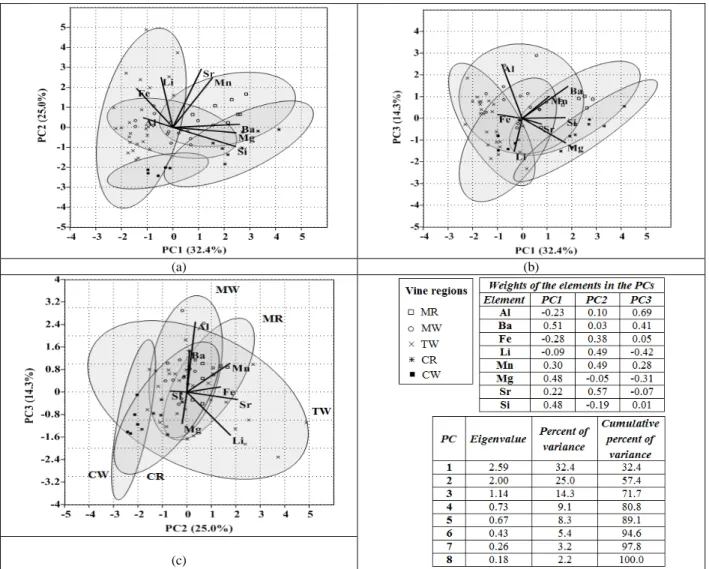
We performed the PCA analysis for 61 wine samples relying on eight elements. The KMO test resulted in eight variables (Al, Ba, Fe, Li, Mg, Mn, Si, Sr) with measure of sample adequacy greater than 0.5, meanwhile the overall measure of sampling adequacy was 0.61. The Bartlett’s sphericity test was also highly significant (chi square = 169.8, df = 28, p < 0.001***).
The PCA resulted in three principal components with eigenvalues higher than one (Fig. 2). These three components explained 71.7% of the total variance.
The plots of the PCA analysis are presented in Fig. 2.
According to the PC1-PC2 and PC1-PC3 plots, we observed a partial differentiation between the white wines (CW, MW, TW) and red wines (CR, MR). The white wines proved to be richer in Al, Fe and Li;
meanwhile, the red ones were richer in Mg, Ba, Si. The white wines from Crișana differed from the white wines of Maramureș, meanwhile the Transylvanian white wines exhibited resemblance with both groups.
The white and red wines from the same viticultural region differed mainly in the content of Mn and Sr, on behalf of the red wines.
We performed the discrimination of the white and red wines separately (Table 4.). The ratio of between group and within group variances revealed three elements (Fe, Mn, Sr) with the highest discriminating power between the three white wine groups and two elements (Mg, Sr) for the red wine groups. We performed the LDA based on these elements. For the white wines the Mardia’s test proved
the multivariate normality of the dataset (p-value for skewness was 0.148, and p-value for kurtosis was 0.315). The red wines showed multivariate normality for the Mg and Sr (Mardia’s test p-value for skewness was 0.8535 and p-value for kurtosis was 0.2791) and homogeneity of covariance matrix (BoxM’s test: chi square = 3.54, df = 3, p-value = 0.315).
For white wines the LDA exhibited 88.9% of recognition ability and 87.0% of prediction ability, based on 10 folds cross validation (prediction abilities by groups: 80.3% for MW, 88.9% for TW and 100%
for CW). We carried out the KNN method based on the same three elements, and we tested it for values of k equal to 3, 5 and 7. We obtained the best results when k was equal to 3. In this case, the overall error rate given by the 10 folds cross-validation was of 16.2%. LDA and KNN gave 100% efficiency in both recognition and prediction of the groups for red wines.
On the other hand, the differentiation of the vine regions under study using multivariate analysis was efficient based on the elements (e.g. Mg, Sr, Fe) which originated mainly from the soil, revealing that the regional characteristics are mirrored in the elemental composition of these wines. These elements were also identified as efficient discriminators of wines by other researchers (Paneque et al., 2010;
Pérez-Álvarez et al., 2019; Šelih et al., 2014; Sperková and Suchánek, 2005). High efficiency of the KNN method was also reported in the analysis of Spanish wines (Rebolo, 2000).
Table 4. Results of the LDA and KNN supervised methods (the prediction ability was tested with 10 folds cross-validation)
White wines (n = 45)
LDA Elements: Fe, Mn, Sr
KNN (k = 3)
Elements: Fe, Mn, Sr Red wines (n=16)
LDA and KNN Elements: Mg, Sr Recognition
ability (%)
Prediction ability (%)
Recognition ability (%)
Prediction ability (%)
Recognition ability (%)
Prediction ability (%)
CW 100 100 100 100 CR 100 100
MW 78.6 80.3 85.7 72.7 MR 100 100
TW 92.3 88.9 88.5 87.6
Overall
error +rate 11.1 13.0 11.1 16.2 0 0
(a) (b)
(c)
Fig. 2. PCA analysis. Score plots of 61 wine samples (points) and the loadings of the variables (lines) in the plane of the paired PCs. The ellipses represent the 95% confidence intervals of the data by vine regions (CR – red wines of Crișana, CW – white wines of Crișana, MR – red wines of Maramureș, MW – white wines of Maramureș, TW – white wines of Transylvania): (a)
represent the PC1-PC2 plane, (b) represent the PC1-PC3 plane, (c) represent the PC2-PC3 plane 4. Conclusions
The assessment of the elemental profile of the traditional wines from three Romanian wine regions revealed that the wines produced for non-commercial consumption by the local rural communities in general differ from the commercial wines, mainly in the lower content of Cr, Cu, Ni, Pb and in the higher concentration of Fe and Mn. Furthermore, relying on the regulation given by the International Organisation of Vine and Wine, negative human impact was not detectable at the mineral level showing that the traditional, non-commercial wines are of good quality and can be safely consumed by the local communities.
We highlight the need for creating a reference database for chemical monitoring of the traditional, non-commercial wines in developing countries such as Romania from Eastern Europe. This is more important as the social-ecological systems are undergoing sharp changes, which will likely affect the soil chemistry and thus the wine quality in the future.
Nevertheless, we are confident that our method will allow the detection of possible changes in the
chemical composition of wines in these changing traditional rural regions of Eastern Europe.
References
Arvanitoyannis I.S., Katsota M.N., Psarra E.P., Soufleros E.H., Kallithraka S., (1999), Application of quality control methods for assessing wine authenticity: Use of multivariate analysis (chemometrics), Trends in Food Science & Technology, 10, 321-336.
Capron X., Smeyers-Verbeke J., Massart D.L., (2007), Multivariate determination of the geographical origin of wines from four different countries, Food Chemistry, 101, 1585-1597.
Castineira Gomez M.D.M., Brabdt R., Jakubowsky N., Andersson J.T., (2004), Changes of the metal composition in German white wines through the winemaking process. A study of 63 elements by Inductively Coupled Plasma-Mass Spectrometry, Journal of Agricultural and Food Chemistry, 52, 2953- 2961.
Dougherty P.E., (2012), The Geography of Wines. Regions, Terroir and Technique, Springer, Dordrecht, Heidelberg, London, New York.
Fabani M.P., Arrúa R.C., Vázquez F., Diaz M.P., Baroni M.V., Wunderlin D.A., (2010), Evaluation of elemental
profile coupled to chemometrics to assess the geographical origin of Argentinean wines, Food Chemistry, 119, 372-379.
Fang B., (2016), Sources and pathways of heavy metals in fruits and the countermeasures, Environmental Engineering and Management Journal, 15, 339-347.
FAO-UNESCO, (1981), Soil Map of the World 1:5 000 000, Unesco, Paris, On line at:
http://www.fao.org/fileadmin/user_upload/soils/docs/S oil_map_FAOUNESCO/new_maps/V_II_petit.jpg.
Fischer J., Hartel T., Kuemmerle T., (2012), Conservation policy in traditional farminglandscapes, Conservation Letters, 5, 167-175.
Forina M., Oliveri P., Jager H., Römisch U., Smeyers- Verbeke J., (2009), Class modelling techniques in the control of the geographical origin of wines, Chemometrics and Intelligent Laboratory Systems, 99, 127-137.
Frías S., Conde J.E., Rodríguez-Bencomo J.J., García- Montelongo F., Pérez-Truillo J.P., (2003), Classification of commercial wines from the Canary Islands (Spain) by chemometric techniques using metallic contents, Talanta, 59, 335-344.
Geana I., Iordache A., Ionete R., Marinescu A., Ranca A., Culea M., (2013), Geographical origin identification of Romanian wines by ICP-MS elemental analysis, Food Chemistry, 138, 1125-1134.
Gomes T.M., Toaldo I.M., Haas I.C. Da S., Burin V.M., Caliari V., Luna A.S., Bordignon-Luiz M.T., (2019), Differential contribution of grape peel, pulp, and seed to bioaccessibility of micronutrients and major polyphenolic compounds of red and white grapes through simulated human digestion, Journal of Functional Foods, 52, 699–708.
Geana I., Marinescu A., Iordache A. M., Sandru C., Ionete R.E., Bala C., (2014), Differentiation of Romanian wines on geographical origin and wine variety by elemental composition and phenolic components, Food Analytical Methods, 7, 2064-2074.
Hartel T., Fischer J., Câmpeanu C., Milcu A.I., Hanspach J., Fazey I., (2014), The importance of ecosystem services for rural inhabitants in a changing cultural landscape in Romania, Ecology and Society, 19, 42-50.
Kment P., Mihaljevič M., Ettler V., Šebek O., Strand L., Rohlová L., (2005), Differentiation of Czech wines using multielement composition – A comparison with vineyard soil, Food Chemistry, 91, 157-165.
Kruzlikova D., Fiket Z., Kniewald G., (2013), Classification of Croatian wine varieties using multivariate analysis of data obtained by high resolution ICP-MS analysis, Food Research International, 54, 621-626.
Lara R., Cerutti S., Salonia J.A., Olsina R.A., Martinez L.D., (2005), Trace element determination of Argentine wines using ETAAS and USN-ICP-OES, Food and Chemical Toxicology, 43, 293-297.
Muntean E., Mihaiescu T.C., (2016), Groundwater quality studies in two Transylvanian rural communities using parallel ion chromatography, Environmental Engineering and Management Journal, 15, 2703-2708.
Nascimbene J., Zottini M., Ivan D., Casagrande V., Marini L., (2016), Do vineyards in contrasting landscapes contribute to conserve plant species of dry calcareous grasslands?, Science of the Total Environment, 545-546, 244-249.
OIV, (2019a), Statistical report on world vitiviniculture 2019, Organisation Internationale de la Vigne et du Vin,
Paris, On line at: http://www.oiv.int/en/oiv-life/oiv- 2019-report-on-the-world-vitivinicultural-situation.
OIV, (2019b), International Code of Oenological Practices.
Issue 01 2019, Organisation Internationale de la Vigne et du Vin, Paris, On line at:
http://www.oiv.int/public/medias/6558/code-2019- en.pdf.
Oșlobeanu M., Macici M., Georgescu M., Stoian V., (1991), Zoning of Vine Varieties in Romania (In Romanian), Ceres Press, Bucharest, Romania.
Paneque P., Álvarez-Sotomayor M.T., Clavijo A., Gómez I.
A., (2010), Metal content in southern Spain wines and their classification according to origin and ageing, Microchemical Journal, 94, 75-179.
Pérez-Álvarez E.P., Garci R., Barrulas P., Dias C., Cabrita M.J., Garde-Cerdán T., (2019), Classification of wines according to several factors by ICP-MS multi-element analysis, Food Chemistry, 270, 273-280.
Pohl P., (2007), What do metals tell us about wine?, TrAC Trends in Analytical Chemistry, 26, 941-949.
Rebolo S., Pena R.M., Latorre M.J., García S., Botana A.M., Herrero C., (2000), Characterisation of Galician (NW Spain) Ribeira Sacra wines using pattern recognition analysis, Analytica Chimica Acta, 417, 211-220.
Rodrigues S.S., Otero M., Alves A.A., Coimbra J., Coimbra M.A., Pereira E., Duarte A.C., (2011), Elemental analysis for categorization of wines and authentication of their certified brand of origin, Journal of Food Composition and Analysis, 24, 548-562.
Römisch U., Jager H., Capron X., Lanteri S., Forina M., Smeyers-Verbeke J., (2009), Characterization and determination of the geographical origin of wines. Part III: multivariate discrimination and classification methods, European Food Research and Technology, 230, 31-45.
Šelih V.S., Šala M., Drgan V., (2014), Multi-elemental analysis of wines by ICP-MS and ICP-OES and their classification according to geographical origin in Slovenia, Food Chemistry, 153, 414-423.
Smeyers-Verbeke J., Jager H., Lanteri S., Brereton P., Jamin E., Fauhl-Hassek C., Forina M., Römisch U., (2009), Characterization and determination of the geographical origin of wines, Part II: descriptive and inductive univariate statistics, European Food Research and Technology, 230, 15-29.
Sperková J., Suchánek M., (2005), Multivariate classification of wines from different Bohemian regions (Czech Republic), Food Chemistry, 93, 659-663.
Szentmihályi K., Csiktusnádi-Kiss G.A., Keszler Á., Kótai L., Candeaias M., Bronze M.R., Boas L.V., Spauger I., Forgács E., (2000), Method development for measurement of elements in Hungarian red wines by inductively coupled plasma optical emission spectrometry (ICP-OES), Acta Alimentaria, 29, 105- 121.
Trujillo J.P.P., Conde J.E., Pérez-Pont M.L., Câmara J., Marques J.C., (2011), Content in metallic ions of wines from the Madeira and Azores archipelagos Food Chemistry, 124, 533-537.
Versari A., Laurie V.F., Ricci A., Laghi L., Parpinello G.P., (2014), Progress in authentication, typification and traceability of grapes and wines by chemometric approaches, Food Research International, 60, 2-18.
Viers J.H., Williams J.N., Nicholas K.A., Barbosa O., Kotzé I., Spence L., Webb L.B., Merenlender A., Reynolds M., (2013), Vinecology: pairing wine with nature, Conservation Letters, 6, 287-299.