TiPSE
The Territorial Dimension of Poverty and Social Exclusion in Europe
Applied Research 2013/1/24 Final Report
Annex 4 | Appendix 8 Case Study Report
BANSKÁ BYSTRICA, SLOVAKIA
Katalin Kovács, Gyöngyi Schwarcz, Gergely Tagai With inputs from Péter Krasztev
Institute of Economics Hungarian Academy of Sciences, Budapest
February 2014
ii
This report is one of the delivera- bles of the TiPSE project. This Applied Research Project is con- ducted w ithin the framew ork of the ESPON 2013 Programme, partly financed by the European Regional Development Fund.
The partnership behind the ES- PON Programme consists of the EU Commission and the Member States of the EU27, plus Iceland, Liechtenstein, Norw ay and Sw it- zerland. Each partner is repre- sented in the ESPON Monitoring Committee.
This report does not necessarily reflect the opinion of the mem- bers of the Monitoring Commit- tee.
Information on the ESPON Pro- gramme and projects can be found on www.espon.eu
The w eb site provides the possi- bility to dow nload and examine the most recent documents pro- duced by finalised and ongoing ESPON projects.
ISBN number – 987-2-919777-42-6
© ESPON &KRTK HAS, 2014.
Printing, reproduction or quota- tion is authorised provided the source is acknow ledged and a copy is forwarded to the ESPON Coordination Unit in Luxembourg.
The ESPON TiPSE Project:
The TiPSE project has been commissioned by the European Observation Network for Territorial Development and Cohesion (ESPON) programme. It is concerned with the issue of poverty, and processes of social exclusion in Europe.
One of the key challenges for the EU, in its pursuit of social, economic and territorial cohesion, is to address regional or local concentrations of poverty and social exclu- sion. In terms of practical governance, this remains a national responsibility within the context of EU strategic guidance. In practice, regional or local administrations are often in ‘the front line’; implementing national policies to ameliorate deprivation and exclusion. At a higher level, the EU defines its role as identifying best practices and promoting mutual learning.
Poverty and social exclusion are essentially relative concepts, arguably only mean- ingful within a specified geographical context. This underlines the essential roles to be played by observation, measurement, and careful data analysis, as preparations for intervention. The TIPSE project aims to support policy, both by enhancing the evidence base and by identifying existing good practice.
A central objective of the TiPSE project is to establish macro and micro-scale pat- terns of poverty and social exclusion across the ESPON space. This will be achieved by compiling a regional database, and associated maps, of poverty and social exclu- sion indicators. Such quantitative analysis of geographical patterns is considered a fundamental part of the evidence base for policy.
In addition, in order to better understand the various social and institutional process- es which are the context of these patterns, a set of ten case studies are to be carried out. These will be more qualitative in approach, in order to convey holistic portraits of different kinds of poverty and social exclusion as experienced in a wide variety of European territorial contexts. The principal goal for these investigations will be to bring forward clear illustrations of the social, economic, institutional and spatial pro- cesses which lead to poverty and social exclusion in particular geographic contexts.
The selection of case study areas has been carried out with careful regard to the wide variety of geographic, cultural and policy contexts which characterise Europe.
The ten case studies are also intended to highlight a range of different ‘drivers’ of poverty and social exclusion, including labour market conditions, educational disad- vantage, ethnicity, poor access to services and urban segregation processes. A sec- ond objective of the case studies will be to identify policy approaches which can ef- fectively tackle exclusion, and thus strengthen territorial cohesion.
The TiPSE research team comprises 6 partners from 5 EU Member States:
No. Partner MS Principal Researchers
LP Nordregio - Nordic Centre for Spatial Development SE Petri Kahila
2 UHI Millennium Institute UK Philomena de Lima
3 Newcastle University UK Mark Shucksmith
4 Institute of Economics Hungarian Academy of Sciences HU Katalin Kovács 5 ILS - Research Institute for Regional and Urban Development DE Sabine Weck 6 EKKE - National Centre for Social Research EL Thomas Maloutas
7 The James Hutton Institute UK Andrew Copus
LIST OF ABBREVIATIONS
EE-NMS – East European New Member States of the European Union ESPON CU – ESPON Coordination Unit
EU27 – The 27 member states of the European Union FRA – European Union Agency for Fundamental Rights GDP – Gross Domestic Product
GVA – Gross Value Added
NACE Rev. 2 – European Classification of Economic Activities (2nd revision) NUTS – Nomenclature of Territorial Units for Statistics
NGO – Non Governmental Organisation OSI – Open Society Institute
UNDP – United Nations Development Program
WB – World Bank
CONTENTS
Executive summary... vii
1 The regional context...1
2 Characteristics of social exclusion and poverty: Patterns and processes ...10
2.1 Enriching the general picture on poverty and social exclusion in Slovakia and its regions ...10
2.1.1 At risk of poverty in age groups, households and in the regions...10
2.2 Regional disparities in light of unemployment and ethnicity ...14
2.2.1 Territorial patterns of unemployment...14
2.2.2 Mapping territorial patterns of disadvantages ...16
2.2.3 Roma and Hungarian minorities ...17
2.3 The 2011 Roma survey and its results ...20
2.3.1 The situation of Roma in Slovakia in comparison to Eastern European countries ...20
2.3.2 The situation of Roma as compared with non-Roma: segregated people and outside people ...20
2.4 Residential and educational segregation in Southern Slovakia ...25
2.4.1 Residential segregation: Roma Atlas report...25
2.5 Field report: the field sites, the methods and the research tools ...26
2.5.1 A demising village of Rimavská Seč...28
2.5.2 The people of Dolinka in Klenovec ...30
2.5.3 An urban ghetto in Rimavská Sobota ...30
2.5.4 Examples of school segregation...37
3 Analysis of underlying processes and trends ...41
3.1 Policy measures ...41
3.1.1 Social and educational policies ...42
3.2 Relevant policies in retrospect ...43
3.2.1 The pre-accession period (-2003) ...43
3.2.2 Post accession developments ...44
vi
3.3 International support for solving the “Roma issue”...45
3.4 Prospects for the future...46
4 Validity of European-wide data analysis from a local perspective ...47
5 Transferability of results ...49
6 Conclusions for policy development and monitoring ...51
7 Literature ...54
Annex 2: The national education system in Slovakia 2012/13 ...66
Annex 3: List of interviewed experts ...67
Annex 4: Ten basic pillars of the Government Plenipotentiary ...70
Annex 5: Physical barriers as a spreading tool to separate Roma (Walls) ...70
vii
TABLES
Table 1: Different ESPON CU typologies of Banská Bystrica, 2009 3 Table 2: Demographic and labour market characteristics 5
Table 3: GDP indicators, 2009 6
Table 4: Economic activity by sector (%), 2009 7
Table 5: Gross value added by sector and per head, 2009 8
Table 6: Different poverty measures, 2011 9
Table 7: At-risk-of poverty rate after social transfers by age-groups before and after
social transfers 2011 (in %) 13
Table 8: Regional disparities in Slovakia expressed in poverty measurements, 2012 14 Table 9: Average proportion of jobseekers by duration of registration per month in
2012 15
Table 10: Figures of (un-)employment and activity 21
Table 11: Figures of educational attainment 24
Table 12: The number and rate of municipalities with Roma inhabitants 2013 26
Table 13: Estimated rate of Romany population 36
Table 14: Estimated rate of Romany population with Hungarian identity 63
Table 15: Access to various goods and amenities 63
Table 16: Migration intentions, attitudes and awareness of Slovakian Roma of segregated neighbourhoods and their non-Roma proximity 64 Table 17: Roma and non-Roma by occupation and industry 65
FIGURES
Figure 1: Portion of the population neither at risk of poverty, nor deprived severely, nor living in a household with low work intensity, 2011 11 Figure 2: Portion of population at risk of poverty, severely materially deprived and
living in a household with low work intensity, 2011 12
Figure 3: The distribution of long term job seekers (registered for longer than three
years) by NUTS3 regions 15
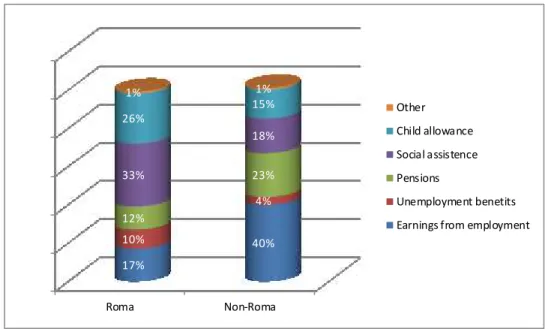
viii Figure 4: Sources of income in Roma and non-Roma households 22 Figure 5: Roma and non Roma employment in segregated neighbourhoods and its
proximity 23
Figure 6: Roma settlements and their inhabitants in 2013 26 Figure 7: Welfare spending of post socialist countries, 2010 41 Figure 8: Economic dependency rate of inhabitants by districts 47
MAPS
Map 1: Banská Bystrica in the context of the ESPON space 1 Map 2: Corine land cover typology of Banská Bystrica, 2006 3 Map 3: Ratio of Hungarians and Roma by self-declared nationality, 2011 57 Map 4: Ratio of Hungarians by self-declared nationality, 2011 58
Map 5: Ratio of secondary school students, 2011 58
Map 6: Unemployment rate, 2011 59
Map 7: Ratio of Hungarians by self-declared nationality, 2011 59 Map 8: Ratio of Romas by self-declared nationality, 2011 60 Map 9: Percentage share of the Roma in the districts of Slovakia 60
Map 10: Ratio of secondary school students, 2011 61
Map 11: Unemployment rate, 2011 61
ix
Executive summary
The present case study provides a broad picture on the state of poverty and social exclusion in the Slovak Republic pointing to some of the causes and consequences that do influence the territorially divergent appearance of these phenomena. Banská Bystrica, one of the southern NUTS3 regions of Central Slovakia represented the spatial focus of the investigation, more closely the district of Rimavská Sobota and two villages subsumed under this LAU1 unit, whilst residential and educational seg- regation of Romany people represented the thematic focus of the study.
Statistics and survey data suggest a relatively high level of wealth in Slovakia as compared to fellow post-socialist countries, evidenced by the rate of the population that managed to avoid poverty or social exclusion. The rate of neither poor nor ex- cluded members of the population in the Slovak Republic (79.4%) is higher than the EU average (75.9%), well above the EU-12 (69.6%) and almost reaches the two most developed post-socialist countries, Slovenia and the Czech Republic, which have somewhat better rates (80.7% and 84.7% respectively). Compared to 2005, Slovakia got ahead of its main competitors, Estonia and Hungary, two countries that have been hit harder by the 2008-2009 crisis.However, poverty and social exclusion do exist in Slovakia to a significant extent, but with specificities, namely, in a geo- graphically and socially (ethnically) concentrated (multiplied) manner. A solid struc- tural crisis has been prevailing in Slovakia impacting mainly the southern regions from Nitra via Banská Bystrica towards Prešov and Košice: 80% of those who have been job seekers for longer than 3 years were registered in these four NUTS3 re- gions in 2012. The highest rate of very longterm job seekers was measured in the researched NUTS3 region of Banská Bystrica (31%) whilst this rate was 27% in the regions of Prešov and Košice. This solid structural crisis has been the main cause of spreading poverty and social exclusion hitting Romany people the most.
Data on educational attainment also show some Slovakian specificity. The first issue that needs to be highlighted is the extremely low rate of preschool enrolment of Ro- ma children and non-Roma alike, but especially Roma: only one quarter of Roma children from segregated neighbourhoods were enrolled into preschools in 2011.
According to our field research findings, this has to do with several factors, such as fees (though removed recently in the case of children of age five), lacking preschool capacities and finally, the location of the segregated Roma settlements: according to the recent Atlas of Roma, only a quarter of the population of the Roma neighbour- hoods live inside the administrative boundaries of villages/towns, the majority live at the edge (44%) or outside municipality boundaries at 0.9 to 7 km distance (32%). If public transportation is available, it is costly, and if it is not available, it is simply im- possible for most of the families to carry a child (or more children) to the kindergar- ten.
According to the survey data, 90% of Roma who live in segregated neighbourhoods suffer from material deprivation, 80% from severe material deprivation and 87% of
x them fell under the poverty threshold in 2011. The gap between Roma and non- Roma was significant; the rate of deprived or poor was almost two times higher in the ranks of the Roma, one third of those wholacked access to secure housing and the majority of whom (91%) lived in financial insecurity. Like in Hungary, the majority of Roma would prefer living dispersed among non-Roma (72%), but their wish is re- fused completely by the latter group.
In the empirical phase of the research thirty semi-structured interviews were con- ducted with village officials, parents, representatives of NGOs engaged in developing projects, preschool leaders, principals of ordinary and special schools in two villages (one Hungarian and one Slovak) and a Roma only school in the district centre of Ri- mavská Sobota. Principals of secondary schools were interviewed in Rimavská Sobota Tornaľa and Hnúšťa and representatives of town officials working in the are- as of social services and education. Three semi-structured interviews were conduct- ed with experts of Roma issues at national level to unfold policy measures affecting education and social integration.
Severe disadvantages of Roma children were identified in each primary school. Cir- cumstances were obviously the best in the school of Klenovec, as the rate of Roma- ny children was below 50% and most of them had consolidated family background.
Pupils living in the segregated Roma settlement of Klenovec were as problematic as their counterparts in the Village of Rimavská Seč and at the ghetto school of the (ur- ban) segregated neighbourhood of Rimanská Sobota. Low motivation of children as a rule, declining performance in upper grades, low number of pupils who continue in secondary education and even fewer who graduate; these are the common traits of accounts. At secondary level, vocational schools perform high dropout rates, espe- cially in case of girls. Contrarily, Roma children in gymnasiums work hard and man- age to graduate; however, their number is significantly lower than in vocational schools. Free breakfast is not available among benefits, therefore hungry child and poor clothing is an everyday experience in these schools, especially in lower classes.
Disadvantages are rarely mitigated by preschool and afternoon school attendance:
though they have to pay half price (2 Euros in 2013), the most vulnerable households with seven to eight children cannot afford paying this fee. Usually half of the children cannot pass the readiness test, thus they start their school tenure in grade zero and they continue in special class or special school ending up at best in special second- ary schools. Special schools were available in each researched settlement and packed exclusively with Roma students. In ordinary classes, only few children are motivated at home and if they are, not for long enough. Most of them have difficulties with maths as well as with comprehending texts: they progress much slower than their fellow pupils of non-Roma background. Teaching languages is also a mistake in Roma-only schools of Hungarian teaching: these pupils are challenged and overbur- dened by the seven Hungarian and five Slovakian classes each week (in the 3rd and 4th grades). Therefore, most of them underperform and, from the ghetto school of Rimavská Sobota, only an average of five to six children can continue to an ordinary school once they finish the 4th grade there, while the rest continue to the special school located in the town or special classes in of one of the primary schools.
xi There are important and effective social policy tools against the consequences of poverty (free meals and free equipment for the needy) and segregation like teacher assistants at school and field social workers at segregated neighbourhoods: the lat- ter, field social worker as a thin path between segregated settlements and the out- side world is not so common in the region, therefore experiences could be shared among social policy experts and practitioners. An area based so called “Comprehen- sive Approach” Program aiming communities with significant Roma population was also launched first in 2002, then in 2007, but for a number of reasons it practically failed.
Desegregation policies drafted in the Strategy for Integration of Roma (2012) do ad- dress the participation rate of Roma children at preschool and the parallel system of education but nothing yet come to force until 2013.What is more, worrisome new language and new tone appeared in the declaration of the current Plenipotentiary of the Slovakian Government for Roma Communities called Ten Basic Pillars. Although there are overlaps between the two chief documents, the Strategy for Integration of Roma, on the one hand, and the declaration of the Plenipotentiary, on the other hand, the conformity of the latter to EU principles / laws is highly questionable (see Annex 4)
1
1 The regional context
Banskobystický kray (hereinafter Banská Bystrica) is situated in Stredné Slovensko (hereinafter Central Slovakia) next to the Hungarian border of the country. Since the reform of territorial administration in 1996 the NUTS3 unit also forms a government unit named “kraj” (region), which is the highest-level administrative unit in the Slovak Republic. Banská Bystrica and its north neighbour Žilinský kraj (hereinafter Žilina) together constitute Central Slovakia NUTS2 statistical region. As a result of its central position within Slovakia Banská Bystrica has several neighbours. Beside Žilina it is contiguous to Trenčiansky kraj, (hereinafter Trenčín) Nitransky kray (hereinafter Ni- tra), Prešovský kraj (hereinafter Prešov) and Košický kraj (hereinafter Košice). Origi- nally Banská Bystricawas only established in 1923; however, the traditional economic profile and history of the area still have their influence on the present social and eco- nomic conditions of the region.
Map 1: Banská Bystrica in the context of the ESPON space
2 The economic profile of Banská Bystrica has always been determined by primary and extractive industries such as forestry and logging, mining or manufacturing non- metallic mineral products (cement etc.). In the socialist era Slovakia came close to the economic development level of Czech Republic (within the common state, Czechoslovakia) due to the great investments of the socialist industry. However, it could not become the lasting mover of the economy as heavy and modern industry was lacking in strong roots in the area, causing structural disproportions with their negative effects. After the political change of regime and with the socio-economic transition of the early nineties Banská Bystrica – along with several other regions of Slovakia – got into a deep structural crisis. Traditional economic branches in the area like mining and agriculture lost importance while branches of socialist industry col- lapsed, causing the high rise of unemployment. Banská Bystrica nowadays is still one of the Slovak regions affected by unemployment and the southern part of the region (Rimavská Sobota and its surroundings) is said to be one of the poorest areas of the country.
The position of the region, its geographical characteristics and the potential connec- tions with other areas also influence the socio-economic factors of Banská Bystrica. It can be demonstrated through the presentation of some ESPON CU regional typolo- gies. As being situated in the middle of the continental Europe Banská Bystrica is not covered by the classification of the coastal or the island typology. Similarly to all other regions of Slovakia Banská Bystrica is also contiguous to other countries. The Slo- vakian-Hungarian border is an internal border of the EU and as other borders, it can be traversed without limitations. At the same time the potential connections between these contiguous parts of Slovakia and Hungary are under-utilized, with the excep- tions of the vicinity of the largest urban centres The“border-effect” yet seems to gen- erate here more disadvantages than advantages. However, in addition to border- effect, two other characteristics of the region might generate relative detriments: on the one hand, Banská Bystrica is situated quite far from the biggest economic cen- tres of the country (Bratislava in the west, Košice and Prešov in the east), while ten- sions stemming from the high rate of inhabitants belonging to the Hungarian or Roma minority, on the other. The latter, as well as that of the closeness of the border could be exploited for mutual benefits of both sides, that happens time-to-time in a number of fields, but large infrastructural investments, particularly in relation to development of road and rail networks as well as industrial regeneration are yet to be brought about.
3 Table 1: Different ESPON CU typologies of Banská Bystrica, 2009
Coastal typology Area not covered by classification Island typology Not an island region
Metropolitan typology Not a metropolitan region Border typology Internal border region
Mountain typology Predominantly mountaionus region, close to a city Industrial transition typology Region with industrial branches losing importance Urban-rural typology Predominantly rural region, close to a city
Source: ESPON CU
The accessibility of Banská Bystrica, the settlement structure and many factors of economic activity of the region are highly influenced by its geographical characteris- tics. The region is a predominantly mountainous area. There are several mountain ranges in Banská Bystrica such as the Low Tatras in the north, Kremnica Mountains, Vtáčnik and Štiavnica Mountains in the west and the Slovak Ore Mountains which are situated in the central and eastern part of the region. The mountains of Banská Bystrica were once the main sources of European gold and other rare metal ores and later e.g. in the 19th century mining was still a traditional and dominant economic ac- tivity in the area, but now the formerly prospering mining towns are in decay.
Map 2: Corine land cover typology of Banská Bystrica, 2006
4 Beside materials for mining, mountains can provide various natural resources for economic activities, so Banská Bystrica is an ideal land for forestry. The wood cover- age in Slovakia is above 40%, and as the central regions of the country are prevail- ingly mountainous, this ratio is even higher in Banská Bystrica. The most elevated mountains in the north are rising to 2000 metres and they are covered with conifer- ous forests,while the lower mountains in the other parts of the region are mainly cov- ered with mixed and broad-leaved forests. Beside this type of vegetation the more intensive forms of agricultural activity(arable land for stock-raising and plant growing) are only possible on lower reliefs like wider river valleys (Hron, Ipeľ or Rimava) and basins (Southern Slovak Basin). These areas are also the locations of bigger settle- ments with continuous urban fabric.
Banská Bystrica is not a metropolitan region according to ESPON typologies. Its population is above 650 thousand inhabitants which is average among the regions of Slovakia, but the area is a predominantly rural region, though close to a city. The most populated settlement in the area is Banská Bystrica, the seat of the region, which is the 6th biggest town in Slovakia with its population of 80 thousand inhabit- ants. Other notable towns are Zvolen (43 thousand inhabitants), Lučenec (28 thou- sand inhabitants), Rimavská Sobota (24 thousand inhabitants) and Brezno (22 thou- sand inhabitants). With the loosing importance of traditional (logging, mining) and socialist industrial branches these settlements nowadays are mostly administrative and service centres, which – due to their rich cultural heritage (especially Banská Bystrica and Zvolen) – are also frequented targets of tourism. The mountainous character of the region provides good possibilities for mountain tourism too: the most frequented Slovakian ski resorts are also located in Banská Bystrica (or closeby).
One of the unfavourable consequences of mountainous character of Banská Bystrica is the bad accessibility of the region. However the area is situated geographically in the middle part of Slovakia, simultaneously it is a remote region in relation to other parts of the country. The (mountainous) physical relief limits the access of the re- gion;only some river valleys provide enough space for main routes traversing higher mountains which separates Banská Bystrica from the neighbouring regions. That also limits intraregional circulation possibilities as – depending on the characteristics of geographical relief –longitudinal or transversal route connections can be lacking.
The main routes in the region cross each other in Zvolen: the one from south to north is an important linkage between South and North Slovakia (and also constitutes the most direct connection between Hungary and Poland); the other from west to east is the part of main transversal route between the western and the eastern parts of the country (and also between the two big cities, Bratislava and Košice).This latter trans- versal route in Slovakia is otherwise less significant than the other (northern) trans- versal one, situated between the Low and the High Tatras. The only motorway of the region links Banská Bystrica and Zvolen and it is continued towards the western part of Slovakia, making the linkage between Banská Bystrica and Bratislava, the capital city of the country. The accessibility situation of the region is potentially improvable because there is an airport with international flights in the area, in Sliač (between Banská Bystrica and Zvolen).
The area of Banská Bystrica (9,500 km2) is far the biggest among the Slovak regions, while it is moderately populated due to (among others) the mountainous character of
5 the NUTS3 unit. Therefore, the population density of the region is the lowest within the country. Despite its unfavourable economic characteristics, the region has not had to face with significant outmigration and population loss in the past decades. Its population is constantly above 650 thousand inhabitants and the major towns hold the number of their inhabitants for years. Only the seat of the region, Banská Bystrica has suffered notable population loss in the past ten years (~5,000 persons); however this phenomenon is related more to suburbanization rather than to outmigration or natural population loss.
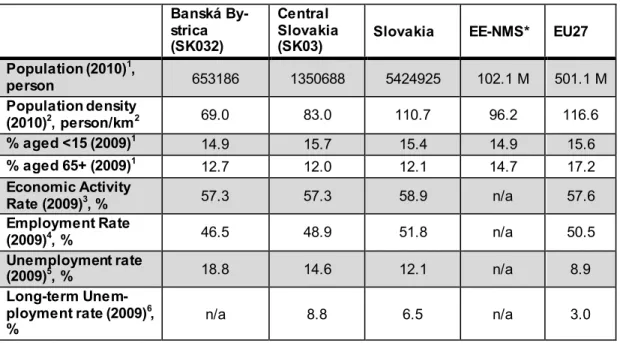
Table 2: Demographic and labour market characteristics Banská By-
strica (SK032)
Central Slovakia
(SK03) Slovakia EE-NMS* EU27 Population (2010)1,
person 653186 1350688 5424925 102.1 M 501.1 M
Population density
(2010)2, person/km2 69.0 83.0 110.7 96.2 116.6
% aged <15 (2009)1 14.9 15.7 15.4 14.9 15.6
% aged 65+ (2009)1 12.7 12.0 12.1 14.7 17.2
Economic Activity
Rate (2009)3, % 57.3 57.3 58.9 n/a 57.6
Employment Rate
(2009)4, % 46.5 48.9 51.8 n/a 50.5
Unemployment rate
(2009)5, % 18.8 14.6 12.1 n/a 8.9
Long-term Unem- ployment rate (2009)6,
% n/a 8.8 6.5 n/a 3.0
Sources:
1. Eurostat Database, Regional Statistics (Reg) Table [demo_r_pjanaggr3]
2. Eurostat Database, Regional Statistics (Reg) Table [demo_r_d3dens]
3. Eurostat Database, Regional Statistics (Reg) Table [lfst_r_lfp3pop]; SO SR, Regional Statistics Database 4. Eurostat Database, Regional Statistics (Reg) Table [lfst_r_lfp3pop, lfst_r_lfu3pers]; SO SR, Regional Statistics
Database
5. Eurostat Database, Regional Statistics (Reg) Table [lfst_r_lfu3pers]; SO SR, Regional Statistics Database 6. Eurostat Database, Regional Statistics (Reg) Table [lfst_r_lfu2ltu]
* East European New Member States of the European Union (Estonia, Latvia, Lithuania, Poland, Czech republic, Slovakia, Hungary, Slovenia, Romania, Bulgaria)
Moreover, the number of live birth increases again year by year in the region and the actual value of it is close to that of mid-nineties. Despite this tendency the demo- graphic structure of Banská Bystrica is quite unbalanced. The ratio of young age groups (aged <15) is lower than the Slovakian average and it is significantly lower than that of the Žilina. At the same time the ratio of elderly people (aged 65+) in the area is quite high as compared to other Slovakian regions. Consequently, the propor- tion of the actual and the potential working age groups is relatively low underpinning some unfavourable labour market characteristics in the region.
Beside these demographical characteristics labour market conditions of Banská By- strica compose another factor of the generally unfavourable social situation in the region. Activity rates of the area can be described as average in rural Slovakia: the higher country average of regional activity rates is pushed by Bratislava and West Slovakia. The labour market disorders, however, can be better illustrated by em-
6 ployment and unemployment rates of the area. The employment rate is notably lower both in Banská Bystrica and the Central Slovakian NUTS2 unit than in Slovakia itself, not reaching even 50%, and much lower in case of the former one. Unemployment figures show that nowadays Banská Bystrica is among the most badly affected re- gions in Slovakia where – in contrast with the similarly disadvantaged East Slovakian regions no significant decrease of unemployment rates has been taken place recent- ly. Long-term unemployment rates are quite high in the wider region (Central Slo- vakia) that also underpins the labour market problems of structural origin in the area.
The economic performance of Banská Bystrica is the lowest (beside that of Prešov) among the NUTS3 units in Slovakia. The total GDP volume of the region does not reach the 10% of Slovakian GDP, while its share of population is above 12%. It also means that the 8500 € per capita GDP of Banská Bystrica reaching only the 75% of the country average is the second lowest followed by Prešov (6,800 € per inhabitant).
However, these figures are not so bad in international comparison. It is true that the GDP per inhabitant value of the region in percentage of the EU average is only 36%, but it is higher than the average relative economic performance of the East European new member states of the European Union. Thus the per capita GDP of Banská By- stricais well ahead of the disadvantaged regions of Bulgaria, Romania, Poland or Hungary.
Table 3: GDP indicators, 2009 Banská Bystrica (SK032)
Central Slovakia
(SK03) Slovakia EE-NMS EU27
Millions of euro 5540 12529 62794 853588 11751419
Euro per inhabitant 8500 9300 11600 8350 23500
Euro per inhabitant in percentage of the
EU average 36.0 39.0 49.0 35.5 100
Source: Eurostat Database, Regional Statistics (Reg) Table [nama_r_e3gdp]
Considering the long-term development of economic performance of the Slovakian (NUTS3) regions, Banská Bystricais among the stagnating or the lagging ones. The economic development and the catching up (e.g. to the European average GDP per inhabitant value) of Slovakian regions were almost continuous in the past decades, but in this process the growth rate of Banská Bystrica lagged behind several others.
Some regions in Slovakia had originally better positions for economic development, like Bratislava with its great economic weight and functional diversity or Trnava which is close both to the capital city of Slovakia and the western borders of the country.
However, many others (Nitra, Žilina Trenčín, Košice)with previously similar starting positions in relative economic performance than Banská Bystrica, have managed to catch up to the ranks of prosperous regions in the last two decades due to (for ex- ample) their successful industrial transition.
7 Table 4: Economic activity by sector (%), 2009
NACE Rev. 2 Category
Banská Bystrica (SK032)
Central Slovakia (SK03)
Slovakia EE-NMS EU27 A Agriculture, forestry
and fishing 5.2 3.7 3.4 14.6 3.4
B- E
Industry (excl. con-
struction) 22.6 25.3 24.0 22.7 24.0
C Manufacturing 20.3 23.1 21.7 19.7 21.7
F Construction 7.7 9.6 8.5 8.2 8.5
G-I Wholesale, retail, transport, accomm.,
food services 27.0 26.9 27.1 22.8 27.1
J Information and com-
munication 1.8 1.8 2.3 2.0 2.3
K Financial and insurance 1.4 1.3 1.9 1.9 1.9
L Real estate 0.7 0.6 1.0 1.0 1.0
M- N
Professional, scientific,
admin. and support 6.6 6.1 8.6 5.9 8.6
O- Q
Public admin., defence, education, health and
social work 24.2 22.1 20.5 17.9 20.5
R- U
Arts, entertainment,
recreation 2.7 2.6 2.6 3.1 2.6
Source: Eurostat Database, Regional Statistics (Reg) Table [nama_r_e3em95r2]
Regarding the sectorial distribution of economic activity industry (manufacturing) (NACE B-E), wholesale, retail, transport, accommodation etc. services (NACE G-I) and public administration, education, health etc. (NACE O-Q) dominate in Banská Bystrica. However, it is almost the same situation in other regions in East Europe. It is more expressive to see the deviance of sectorial employment ratios considering Banská Bystrica, Slovakia and the EU27. The share of agriculture and forestry is yet rather high in the region due to the exploitation of the extended forests in the area, whilst the role of public services (administration, health, education etc.) in employ- ment is much higher than the country or the European Union average. In contrast, the share of industrial sectors as well as that of the creative sectors (information, communication, finance, real estate, and science etc. – NACE J-N) are relatively low in Banská Bystrica, whilst the role of personal services in employment reaches the same level as of Slovakia or the EU27.
8 Table 5: Gross value added by sector and per head, 2009
Banská Bystrica (SK032)
Central Slovakia (SK03)
SK Banská Bystrica (SK032)
Central Slovakia (SK03)
SK
NACE Rev. 2 Category GVA per head of working age
population (thousand €) Share of GVA by sector (%) A Agriculture, forest-
ry and fishing 31.7 27.5 25.4 7.6 4.6 3.4
B- E
Industry (excl.
construction) 19.7 20.8 26.4 20.7 23.5 24.
5
C Manufacturing 18.8 18.9 21.3 17.7 19.5 17.
8
F Construction 26.7 30.2 30.1 9.5 12.9 9.9
G-I Wholesale, retail, transport, ac- comm., food ser- vices
17.6 17.6 21.1 22.0 21.1 22.
0 J Information and
communication 61.1 59.5 53.5 5.1 4.8 4.8
K Financial and in-
surance 50.4 57.6 53.3 3.3 3.3 3.8
L Real estate 182.6 213.4 175.7 6.2 5.8 6.6
M- N
Professional, sci- entific, admin. and
support 24.3 25.4 23.0 7.5 7.0 7.6
O- Q
Public admin., de- fence, education, health and social work
13.9 14.4 17.9 15.6 14.2 14.
2 R-
U
Arts, entertain-
ment, recreation 20.0 24.6 31.0 2.5 2.9 3.2
Total - All NACE
activities 21.6 22.4 25.9 100 100 10
0 Source: Eurostat Database, Regional Statistics (Reg) Table [nama_r_e3vab95r2]
The figures of economic activity by sectors confirm the assertion about the economic structural problems of Banská Bystrica. The weight of those sectors which have the highest share in employment is also the biggest in the gross value added of econom- ic production but unfortunately these are also the least productive sectors. GVA per head of working age population is quite low in the sectors of public and personal ser- vices in the region and it is even lower regarding industry – in comparison with the national average. The productivity of the agricultural activity (mainly forestry) and creative sectors is at average in country comparison or higher, these industries con- tribute much more to the economic production of the region than their share in secto- rial employment ratios.
9 Table 6: Different poverty measures, 2011
Banskobys -trický kraj (SK032)
Stredné Slovensko
(SK03) Slovakia EU27
At-risk-of-poverty rate, %1 15.3 13.1 13.0 -
People living in households with
very low work intensity, %2 - 7.5 7.6 10.2
Severe material deprivation rate,
%2 - 10.7 10.6 8.8
Average disposable equivalised
household income, € per month1 558.4 582.9 581.6 - Source:
1. Statistical Office of the Slovak Republic, Regional Statistics Database
2. Data from Eurostat Database, Income and Living Conditions (ilc) Table [ilc_lvhl11, ilc_mddd11]
The above mentioned economic profile, demographic and labour force trends all indi- cate and also explain why Banská Bystricais lagging behind and usually ranked as the second poorest region of the country. Poverty measurements of course indicate similar territorial imbalances. Measurements, like people living in households with very low work intensity or severe material deprivation rate only provide information on NUTS2 level ofCentral Slovakia where the value of these indicators reaches the country average. However, NUTS2 level figures obscure the inner inequalities, namely, the more prosperous Žilina ‘compensates’ for Banská Bystrica’s unfavoura- ble positions. The average disposable income of households is the fourth lowest in Slovakia at Banská Bystrica after Nitriansky, Prešovský and Košices and that of at- risk-of-poverty rate is the second highest (after Prešov) in Slovakia. Notwithstanding that these values are not outstanding in European comparison; the severity of the problem is unquestionable due to the high spatial concentration of the phenomenon.
Comparing to other areas of the country the spatial concentration of impoverished municipalities and districts is extremely high in Banská Bystrica, particularly at the southern part of the region bordering Hungary in the town of Rimavská Sobota and its surroundings.
10
2 Characteristics of social exclusion and poverty: Patterns and processes
2.1 Enriching the general picture on poverty and social exclusion in Slovakia and its regions
2.1.1 At risk of poverty in age groups, households and in the regions To make further use of Eurostat and Slovak statistics and try to gain a clearer picture of poverty and social exclusion in Slovakia, a European comparison and a compari- son to the block of post-socialist countries will be provided first. As it was pointed out above, most indicators of poverty are not outstanding as compared to either group of countries, thanks to Slovakia’s relative success in attracting investments during the course of the first decade of the 21th century This helped the country overcome the economic difficulties of the 1990s having stemmed from the collapse of the socialist industries and also managed to prevent to some extent the full impact of the crisis.
The relatively high level of wealth reached by Slovakia as compared to fellow post- socialist countries, evidenced by the rate of the population that managed to avoid poverty or social exclusion, is indicated by the graph below. The graph shows that the rate of neither poor nor excluded members of the population in the Slovak repub- lic (79.4%) is higher than the EU average (75.9%), well above the EU-12 (69.6%) and almost reaches the two most developed post-socialist countries, Slovenia and the Czech Republic, which have somewhat better rates (80.7% and 84.7% respec- tively). Compared to 2005, Slovakia got ahead of its main competitors, Estonia and Hungary, two countries that have been hit harder by the 2008-2009 crisis.
11 Figure 1: Portion of the population neither at risk of poverty, nor deprived se- verely, nor living in a household with low work intensity, 2011
Source: Eurostat database, Social participation statistics, Material deprivation and low w ork intensity statistics, Inter- sections of Europe 2020 Poverty Target Indicators by income quintile [ilc_pees03]
However, poverty and social exclusion do exist in Slovakia to a significant extent, but with specificities, namely, in a geographically and socially (ethnically) concentrated (multiplied) manner. If we reverse our point of investigation and consider the rate of those who were hit by poverty, i.e. severe material deprivation as well as social ex- clusion, the position of the Slovak Republic is by far the worst compared to Slovenia or the Czech Republic, though still much better than Bulgaria, the poor countries of the Baltic states, Hungary and Croatia.
0 10 20 30 40 50 60 70 80 90
Rate of population neither at risk of poverty nor severely materially deprived nor living in a household with low work
intensity
2005 2011
12 Figure 2: Portion of population at risk of poverty, severely materially deprived and living in a household with low work intensity, 2011
Source: Eurostat database, Social participation statistics, Material deprivation and low w ork intensity statistics, Inter- sections of Europe 2020 Poverty Target Indicators by income quintile [ilc_pees03]
The identified components of poverty generating material deprivation and social ex- clusion that do overlap – in line with EU tendencies – are as follows:
Unemployment, especially long-term unemployment, resulting in low work in- tensity rate or no work at all.
Age structure.
Household composition: being single, especially with children (lone parents), households with more than 3 children.
The quoted volume relies on the EU SILC survey, which identified the highly signifi- cant impact of unemployment on the level of poverty risk: while as little as 6.2% of working people over 18 years of age (excepting students 18 to 24) fell under the 60%
of the equalised median income, almost half of the unemployed (44.6%) fell to the group of the relatively poor. (Vlačuha – Kováčová 2013, p. 10)
The role of household structures is also significant. The rate of the risk of poverty after social transfers was almost two times higher in 2012 than the country average (13.2%) in households of single adults less than 65 years of age (24.1%), whilst the rate was more than twice the country average in households of adult single parents and peaked at 35.1% in the case of households with three or more children. (Source:
Vlačuha – Kováčová, 2013, p. 9) 0,0
1,0 2,0 3,0 4,0 5,0 6,0
Luxembourg Iceland Switzerland Sweden Denmark Cyprus Norway Netherlands Finland Spain Malta Austria Slovenia United Kingdom Czech Republic France Portugal European Union (15 countries) Poland European Union (27 countries) Italy Romania Germany (including former… New Member States (12… Belgium Estonia Slovakia Greece Lithuania Croatia Hungary Latvia Bulgaria
Population at risk of poverty, severely materially deprived and living in a household with low work intensity, 2011
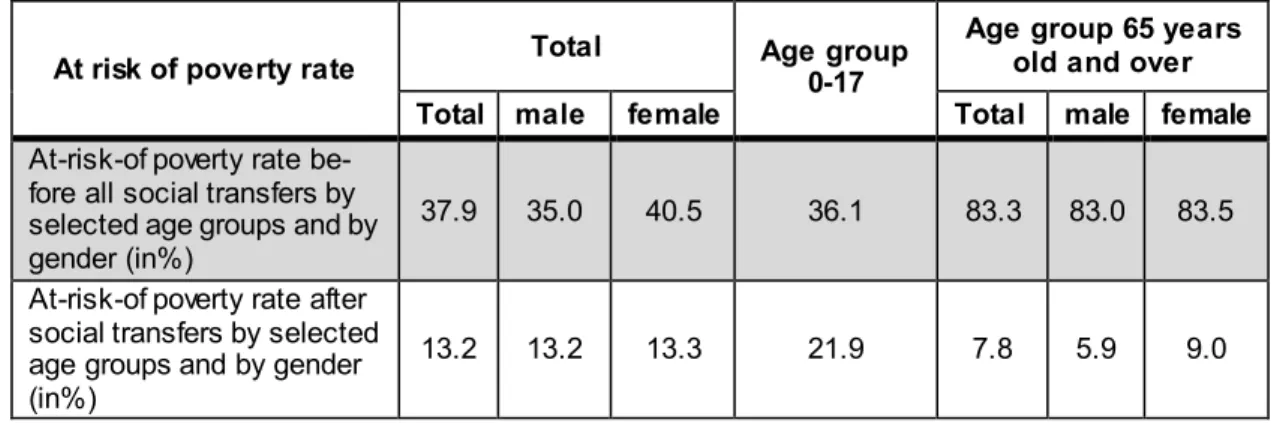
13 The above mentioned figures reflected poverty rates after social transfers. Age, how- ever, illustrates the extremely high equalising effects of social transfers in the case of certain age groups, notably the portion of the population over 65 years of age.
“…at-risk-of-poverty rate before all social transfers in this group of the popula- tion … [was] more than eight times higher than it was in the case of the same age group of the population after taking into account old age and survivor´s benefits in equalised disposable income” (Vlačuha – Kováčová, 2013, p. 22) The risk of a rise by the poverty rate (cut-off point: 60%) before and after social trans- fers is illustrated in the table below. Data clearly demonstrate that without the efficient equalising effect of old age and survivors’ benefits, the risk of poverty for the elderly would be 2.2 times higher than that of children. Without social transfers, the average poverty rate would increase to almost three times higher.
Table 7: At-risk-of poverty rate after social transfers by age-groups before and after social transfers 2011 (in %)
At risk of poverty rate Total Age group 0-17
Age group 65 years old and over Total male female Total male female At-risk-of poverty rate be-
fore all social transfers by selected age groups and by gender (in%)
37.9 35.0 40.5 36.1 83.3 83.0 83.5 At-risk-of poverty rate after
social transfers by selected age groups and by gender (in%)
13.2 13.2 13.3 21.9 7.8 5.9 9.0
Source: Compiled from Vlačuha – Kováčová, 2013, p. 21
Last but not least, regional disparities at NUTS3 level are also discussed in the vol- ume. Although low work intensity rate of households is not available on NUTS3 level at EUROSTAT, Slovak statisticians calculated such variables and some others are indicated in the following table:
14 Table 8: Regional disparities in Slovakia expressed in poverty measurements, 2012
Regions
At-risk-of pov- erty rate after social transfers (in%)
Low work in- tensity rate of households (18-59, except students 18-24)
Inequality of income distri- bution S80/S20 income quintile share ratio by regions
Inequality of income distri- bution: Gini coefficient by regions
Total (Slovakia) 13.2 7.2 2.7 25.3
Bratislava 6.3 2.6 3.7 25
Trnava 10.6 5.3 3.3 23.4
Trenčín 8.3 5.1 3.2 22.5
Nitra 15.9 10.2 3.9 25.7
Žilina 12.7 4.5 3.6 24.8
Banská Bystrica 15.6 11.1 3.8 25.6
Prešov 19.9 9.0 4.4 26.7
Košice 13.5 8.5 3.5 23.9
Source: Compiled from Vlačuha – Kováčová, 2013
The table indicates that according to the 2012 EU SILC data, Prešov (North-East) was the poorest NUTS3 region in Slovakia, followed by Banská Bystrica (South- Central) and Nitra (South-West) reflecting West-East as well as North-South divi- sions. It is worth mentioning that the highest inequality was measured in Prešov also, regardless of the measurement (Gini coefficient or income quintile share ratio) which points to the correlation between poverty and inequality. The rate of households characterised by less than 20% work intensity is the highest in the neighbouring southern NUTS3 regions of Banská Bystrica and Nitra. The region of Košice as a whole looks rather consolidated, most probably thanks to its seat, Košice, the second largest city of Slovakia (240688 inhabitants). Košice provides a typical example for a developed and populous urban centre obscuring poor neighbourhoods, either within the city boundaries or in the more distant areas of the region.
2.2 Regional disparities in light of unemployment and ethnicity
This sub chapters bellow are meant to illustrate that poverty and social exclusion appear in Slovakia in a geographically and socially (ethnically) concentrated (multi- plied) manner.
2.2.1 Territorial patterns of unemployment
When regional disparities are mentioned in the Slovak context, the scale is rarely considered. In light of data on long-term unemployment published in an annual report of the Ministry of Labour, Social Affairs and Family in 2013, the territorial predisposi- tion of unemployment, both regarding the number of the unemployed and the dura- tion of unemployment, can clearly be verified.
15 The table below depicts the length of job seeking by NUTS3 regions of Slovakia whilst the graph illustrates the distribution of the very long-term unemployed (being out of employment for more than three years):
Table 9: Average proportion of jobseekers by duration of registration per month in 2012
Length of job seeking (in months)
Brati- slava
Trnav a
Trenčí
n Nitra Žilina
Bansk á By- strica
Prešo v
Košic e
Slo- vakia
up to 3
months 29% 25% 24% 21% 23% 15% 16% 16% 19%
4-6 21% 18% 17% 15% 17% 12% 13% 12% 14%
7-9 13% 11% 11% 10% 11% 8% 9% 9% 10%
10-12 9% 8% 8% 8% 8% 7% 7% 7% 8%
13-18 11% 11% 11% 11% 11% 10% 11% 11% 11%
19-24 6% 7% 7% 7% 7% 6% 7% 7% 7%
25-30 4% 5% 5% 5% 5% 5% 6% 6% 5%
31-36 3% 4% 4% 4% 4% 5% 5% 5% 4%
37-42 2% 3% 4% 4% 3% 5% 5% 5% 4%
43-48 1% 2% 2% 3% 2% 4% 4% 4% 3%
Above
48 2% 5% 6% 10% 8% 22% 18% 19% 14%
Slovakia 100% 100% 100% 100% 100% 100% 100% 100% 100%
Source: Ow n calculation from Table 2.14., Report on … 2013, p. 29
Figure 3: The distribution of long term job seekers (registered for longer than three years) by NUTS3 regions
Source: Ow n calculation from Table 2.14., Report on … 2013, p. 29 0,0%
20,0%
40,0%
60,0%
80,0%
100,0%
120,0%
10,2% 6,9%
24,2%
25,6%
23,5%
Košice Prešov
Banská Bystrica Žilina
Nitra Trenčín Trnava Bratislava
16 The data of Table 9 and the illustration suggest that a solid structural crisis has been prevailing in Slovakia, mainly impacting the southern regions from Nitra via Banská Bystrica towards Prešov and Košice. These four NUTS3 regions are responsible for 80% of extremely long unemployment (longer than 3 years). The highest rate of very long-term jobseekers was measured in Banská Bystrica (31%) whilst this rate was 27% in the regions of Prešov and Košice. This solid structural crisis has been the main cause of spreading poverty and social exclusion (see also Map 11).
Regional disparities in Slovakia are rooted in socialist industrialisation policies creat- ing mono-segment industries in certain regions, thus generating a high level of de- pendency on one or a few industries. This led to social and economic troubles in the 1990s (European Social Watch Report 2010). In the researched district of Rimaská Sobota as well as in the neighbouring districts of Southern Slovakia, agriculture and the food industry dominated local economy; given the favourable environment, the fertile plains and the river valleys, these areas were claimed as the ‘breadbasket’ of Czechoslovakia, as the slogan went. This vertical integration collapsed in the 1990s, and new investments have not occurred, or at least not enough. Interviewees men- tioned one single assembly plant employing a significant number of people (approx.
one thousand employees, a South Korean investment in Rimaská Sobota). Lacking highways were also blamed by local people for the scarce interest of foreign direct capital and for the massive lack of jobs – especially jobs for the unskilled. Slovakia is the very country where the unemployment rate among low-qualified persons was the highest among member states in 2012, 45.5%, almost three times higher than the EU-27 average (16.8%). (Report on … 2013, Table 2 of Appendix to Chapter 5).
Moreover, the Roma population is concentrated in these (southern and eastern) re- gions, which further aggravates problems (see next chapter).
Migration for work would be a logical choice by long-term job seekers; Roma and non-Roma alike do migrate but not yet in large quantities. According to the official figures, 120.7 thousand Slovakian citizens were working abroad in 2012; the 11.2 thousand from Banská Bystrica (9.3% of migrants) is a lower rate than the represen- tation of workers in the region (278.6 thousand annual average, 12.0% of workers in Slovakia). Illegal migration must be much higher; according to a BBC report (aired in December 2013), approximately 200 thousand Roma migrants lived in the UK (BBC 2013), many of them with Slovakian citizenship.1
2.2.2 Mapping territorial patterns of disadvantages
The north-south divide and territorial disparities are clearly indicated by Map 3 - Map 11. Two series of maps were produced, one at LAU1 (district) level and the other at LAU2 level (restricted to the researched LAU1 unit of Rimavská Sobota). Both series show a considerable north-south divide also emphasised by the local experts: in the southern (and eastern) districts, the unemployment rate is much higher than in the
1By chance, migrant Roma f rom Southern Slovakia incurred media attention in Page Hall, Sheffield in November 2013, w here an estimated number of 1,500 Roma migrants live. ”Three buses run by Interbus make the 30-hour journey overland from Slovakia to Sheffield each w eek but just tw o go back in the other direction.”
http://w w w .theguardian.com/uk-new s/2013/nov/15/sheffield-page-hall-roma-slovakia-immigration (retrieved in February 15th 2014)