Use of spatial analogy in analysis and valuation of climate scenarios
PhD theses
Horváth, Levente
Supervisor:
Dr. Harnos, Zsolt , MHAS, Professor
BCE, Faculty of Horticultural Sciences, Dpt. of Matehmatics and Informatics
Corvinus university of Budapest Faculty of Horticultural Sciences Department of Mathematics and Informatics
2008.
PhD School/Program
Name: Landscape Architecture and Decision Support System PhD School of Multidisciplinary Agricultural Science Field: Multidisciplinary Agricultural Science
Head: Dr. Harnos, Zsolt, MHAS, Professor
CORVINUS UNIVERSITY OF BUDAPEST
Supervisor: Dr. Harnos, Zsolt, MHAS, Professor
CORVINUS UNIVERSITY OF BUDAPEST
Consultant: Dr. Hufnagel, Levente, PhD,
CORVINUS UNIVERSITY OF BUDAPEST
Dr. Gaál, Márta. PhD.
CORVINUS UNIVERSITY OF BUDAPEST
The applicant met the requirement of the PhD regulations of the Corvinus University of Budapest and the thesis is accepted for the defence process.
Head of PhD School Supervisor
Introductions and aims
Custom run of our weather in a specific place and time -what can be defined by the averages of climatic parameters- we can call the climate of that area. The climate of a specific area significantly define the ecology, potential vegetation, flora and fauna, soil type and it’s quality of that called area. Also define (with the previous ones) the human activity. The adaptation technics to climate of the society can define the human activities on a called area. The human activities depends from the actual climate, but the climate sensitivity is different by type-to-type. The most sensitive areas are the followings:
1. agriculture, 2. sylviculture, 3. water management, 4. enviroment conservation, 5. human- animalhealth.
These climate sensitive areas also define the area’s land use types, which influences the natural and social activities. Of course there are some other factor, the geographic and social custom which also can influence the land use. It’s clear that the changes of the climate of a specific area can change the ecological, social and natural processes, hence the magnitude of that research of that area is needed. Optimalization of human activiteis and encroachment to the adaptation of the human-influented ecosystems to climate change is today is an unsolvable problem.
Behind the question of climate change, across the human carbon emission, in cause an effect there are ecological questions, because to influence the climate change, we can only reduce our carbon emission or control ecological processes.
It is interesting that we are know a lot about the effect of the climate change we can read many of the publications, we working in huge projects, but we only know a few things about these ecological processes.
From the IPCC reports, the scope of the EU7 projects and the VAHAVA project we can see, that we should hastily and accurately answer the following questions:
1. By the most approved climate scenarios what kind of consequences are waited about the the change of natural vegetation, agriculture and land use?
2. What kind of consequences are waited about the biodiversity change?
3. What is the infulence of the landuse change to the biodiversity?
4. Behind these questions, what are the considerations about the adaptation?
The effect of changing climate on bigger regions and complex processes can be characterizied by the spatial analogy. With the spatial analogy we can search for regions which present climate is similar to our study area’s in the future. With this method it is possible to analyze the future image of our study area by the most possible climate scenario, and to utilize their adaptation strategies. There are three main direction to utilize the method of spatial analogy.
1. By the GIS representing the different climate scenarios can be visualizing, compareing and grouping. And showing the amplitude of the changes by different scenarios
2. By collecting all of data about the crops, land use natural vegetation from the analogue regions we can build a possible picture of our study area. With that we can make hipotheses to build adaptation strategies.
3. The other way is also important, we can define analogue regions which climate in the future will be similar to our in the present. From that we can get information about where we can sell our knowledge about vegetation, cropping systems adaptation technics etc. (for example where open new markets for our product technologies, where needed our expert knowledge)
It’s more important to know, that the analogue reguions are analogue only by the used parameters. By the changing in weather system the daily temperature and precipitation will change, but the length of the daytime the radiations won’t change. Important to define, that with the spatial analogy we didn’t count with the changing of the CO2 level, because we are compareing present climates. The social questions can be also problem, because of the traditions used crops, agricultural systems and financial conditions
The defined the research topics are the followings:
1. Synthesis of the national and international literature about the spatial analogy methods and the effect of climate change.
2. To develop the methodology of spatial analogy.
3. Characterizing the analogue regions by the most used climate scenarios. And visualize them by GIS.
4. The define the regions which climate will be similar to ours and also visualizing them.
5. To collect and compare all data (crops, land use, natural vegetation) of analogue regions and our study area.
Materials and methods Basic climatic data
By the recommendation of World Meteorological Organization (WMO) for the base period we chosse the time table from 1961 to 1990. The mounthly temperature and precipitation data comes from the OMSZ for Debrecen, and for whole Europe it comes from the CRU TYN CL 2.0 database, which has a 10 minutes spatial resolution.
Climatie scenarios
The scenario is a script, which is showing a possible image of our climate in the future. Not a forecasting, only the picture of the future. The differecnes between the scenarios can be seen in the differences of climate scenarios. Fort he future climate we analyze the following models and databeses
UK Met Office (UKMO) Hadley Centre’ climate database:
• TYN SC 1.0
• UKTR (1992):
Geophysical Fluid Dynamics Laboratory’s (USA) climate database:
• GFDL2534 (1991)
• GFDL5564 (1991).
From the TYN SC 1.0 database we used three timetable the 2011-2040, 2041-2070 and the 2071-2100 30 years averages.
Satistical data of European regions
In 1970 the EUROSTAT was building the NUTS system, to make easier the datacollections from regions. That system has 3 levels, from the country level to county level by the size and the population of the regions. From the EUROSTAT database we collect the averages of the 1997-2006 time table for the land use and the crops. Fort he natural vegetation we used the CORINE 2000 database.
1. Land use data (1000 ha)
(agricultural area, cropfield, forest, pasture, olive field, orchard, vineyard) 2. Field of different crops (1000 ha) and the yield (t/ha)
(wheat, maize, sunflower, rye, rape, sugarbeet, potato, cotton, flax, rice, soya, pulse, tobacco, olive, orchards, grape)
Methodology of spatial analogy
The scope of the method, is to find the analogue regins. The analogue regions are which climate is most similar to our study area’s in the future, or the opposite way, which regins future climate will be similar to our’ in the present.
Climex method
With the CLIMEX method, we can compare to climatic datasets, and the method is the following::
∑
=
−
⋅
=
12
12 1
1
i
i ji
dj TEMP T
T
∑
= + ⋅ +
−
⋅
=
12
11 ( )
12 1
i ji i
i ji
dj a PREC P
P P PREC
dj TT k
Tj e
I = −λ⋅ ⋅
dj P P k
Pj e
I = −(1−λ)⋅ ⋅
Pj Tj
j I I
CMI = ⋅
Ahol
• j: number of the gridpoint (j=1-31143)
• i: number of the month (i=1-12)
• TEMPji: the temperature of the grid j in the month i
• Ti: the temperature of the scenario in month i
• PRECji: the precipitation of the grid j in the month i
• Pi: the precipitation of the scenario in month i
• Tdj: the absolute differences of temperature
• Pdj: the differences of temperature
• a: we can count only the differences of precipitation, because the differences for small precipitation is more important than for the high ones. Fort he calculation we used a=0,05
• ITj: the similarity of the grid j by the temperature to the scenario (value: 0-1, if the temperature is the same, than ITj=1)
• IPj: the similarity of the grid j by the precipitation to the scenario (value: 0-1, if the precipitation is the same, than IPj=1)
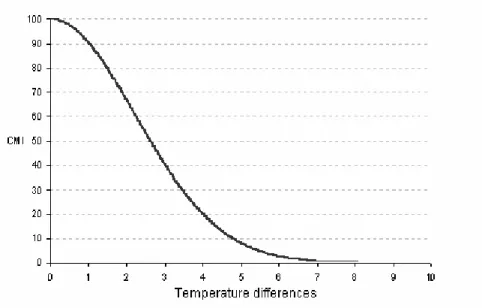
• kT: can be set by the user, if kT=0,1 than for 1oC differences the similarity is ITj=90%, az to define the analogue regions, we used teh value (Figure 1)
• kP: can be set by the user, we choose the kP=0,1
• CMIj: „Composite Match Index”, the similarity between the gridpoint and the scenario, for the exact similarity the value is CMI=1
Figure 1. Value of CMI for temperature
The user can set the similarity indicies, from which value he os she can call the regins analogue. We choose the similarity for 90% because for that value the temperature differences is 1
oC.
Results
Development of Climex method
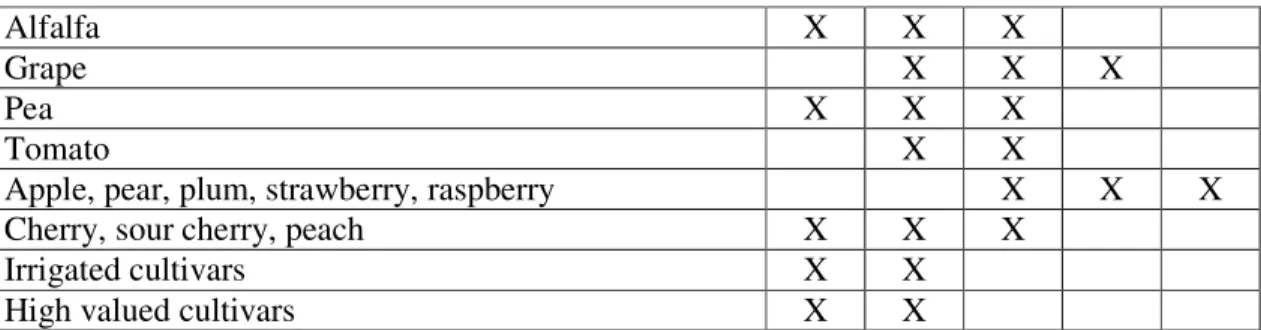
With the Climex method we can only use the temperature and the precipitation in same weight. To calculate the similarity for only for the temperature or for the precipitation we should have alter the calculation of CMI. We started to use a new λ parameter tp weightening the temperature and the precipitation. If we choose the λ=1 we get the similarity only by the temperature if we choose λ=0 than only for the precipitation. For different λ we can set the weight of the parameters as which is more important to us. It is asked to collect the experts knowledge to choose the right λ, because in the different phenophases the crops need from the one than the other parameter, and this is also can changed to month to month. We collect some recommandation for differetn crops in Table 1.
Because dat the calculations can be make very fast and easy, we recommend the calculate for more λ value. From previous resarch we can say, that for different λ we kept different regions, but some of the had the same for only the temperature and for the precipitation, but there was some, which had high similarity by the temperaure and low for teh precipitation vice versa.
Because ther wasn’t big differences between the regions for different λ we recommend to use the λ=0,5 value with the same weight for the temperature and precipitation.
Table 1. Set of λ parameter for different crops
λ
Crops 1 0,75 0,5 0,25 0
Winter wheat X X X
Autumn barley X X
Spring barley X X X
Rye X X X
Maize X X X
Sugar beet X X X
Sunflower X X X
Potato X X X
Alfalfa X X X
Grape X X X
Pea X X X
Tomato X X
Apple, pear, plum, strawberry, raspberry X X X
Cherry, sour cherry, peach X X X
Irrigated cultivars X X
High valued cultivars X X
Our study area was Debrecen’s region. From the results we can say that the the analogue regions for the timetable 2011–2040 is to south, for 2041-2070 the shifting is more but the similarity is also high. Fort he end of the century 20712100 we didn1t find analogue region.
Analogue region for that timetable are in North-Africa. We only work on the 2011-2040 and the 2041-2070 timetable because for that period have high similarity regions in Europe.
Define analogue regions
We characterizing analogur regions, for which NUTS2 regions are the analogues for Debrecen. (Figure 2.) and needed the define the opposite analogue regions, which climate in the future is the similar to ours int he present. We also used the climex method, but we used the scenarios as a base period (for 2011-2040 and 2041-2070) with the λ=0,5 value.
Figure 2. Analogue NUTS2 regions
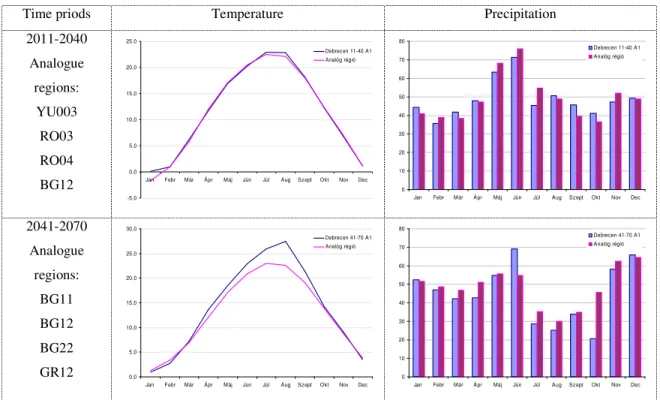
To see that the analogue region has the same climate as for the scenario for Debrecen, we should have analyze the climate of the regions. (Figure 3.) From the diagrams we can see, that for 2011-2040 the temperature and the precipitation are very similar, small differences can be seen for the 2041-2070 period in the summer temperature and in the precipitation is June and October.
Time priods Temperature Precipitation 2011-2040
Analogue regions:
YU003 RO03 RO04 BG12
-5,0 0,0 5,0 10,0 15,0 20,0 25,0
Jan Febr Már Ápr Máj Jún Júl Aug Szept Okt Nov Dec
Debrecen 11-40 A1 Analóg régió
0 10 20 30 40 50 60 70 80
Jan Febr Már Ápr Máj Jún Júl Aug Szept Okt Nov Dec
Debrecen 11-40 A1 Analóg régió
2041-2070 Analogue
regions:
BG11 BG12 BG22
GR12 0,0
5,0 10,0 15,0 20,0 25,0 30,0
Jan Febr Már Ápr Máj Jún Júl Aug Szept Okt Nov Dec
Debrecen 41-70 A1 Analóg régió
0 10 20 30 40 50 60 70 80
Jan Febr Már Ápr Máj Jún Júl Aug Szept Okt Nov Dec
Debrecen 41-70 A1 Analóg régió
Figure 3. Climate of analogue regions
We can state that the changing climate in time shows more shifting to the south in analogue regions. Fort he nest decades this shifting is about 250-450kms, for the middle of the century is 450-650 kms. To the south direction for the analogue region of Debrecen and to the north in the opposite way.
We compare these analogue region by the data of EUROSTAT and by the natural vegetation data from the CORINE database.
Debrecen’s analogue regins are for the next decades are in Vojvodina, South Romania and North-Bulgaria, for the middle of the century are in middle Bulgaris and North Greece. For the opposite way the analogue regions are in Poland.
Characterization of the land use data of analogue regions
We analyze the analogue regions by the relative area of landuse types with the Non Metric Distance Scaling based on euclidean method. (Figure 4.). We can say that Hungary is in the middle of the regions by the similarity patterns, so the possible changes are not leads to the same directions. It can be seen that the closest regions are the RO03 and the YU003, and in farest time the analogue regions are far away. In the directions we can see some orientations of the regions, they are leed one-to-one by geographic locations. Close are the YU and the RO regins further the BG and the GR.
Figure 4. Similarity of analogues regions by land use
The couse behind this similarity is the arable land usage, because the ratio of this land use type is higher in YU003 and RO03 and in BG and GR are lower than in Hungary. The ratio of forests are different because geographic conditions, it seen from the ratio of flat plains in the regions. About the usage of arable lands we can get more later.
It is more important the declare, that in the analogue rergions the ratio of paisture is higher than in Hungary, and the forst use is significant. Increasing the ratio of these extensive landuse type should be followed in Hungary, because the save of natural vegetations and natural resources.
Interesting to see the ratio of the vineyards, with a small changes in climate we shift in to the good climatic conditions for grape, with more shifting we decreased to the present level.
Diversity of natural and humaninfluenced vegetation is very important in adaptation strategies for the changing climate. The more diverse vegetation is decreasing the risk of climate change, and lead to higher diversity in natural vegetation, which is general environmental question. This is interesting that the decreasing the financial risk and the save of the environment facet o same deriction.
In 2011-2040 the diversity of the analogue regions by land use are lower than in Hungary and higher in 2041-2070. Behind the lower diversity not the number of assortments stand but the equable distribution of the same assortments.
Analysis of cropsfields of analogue regions
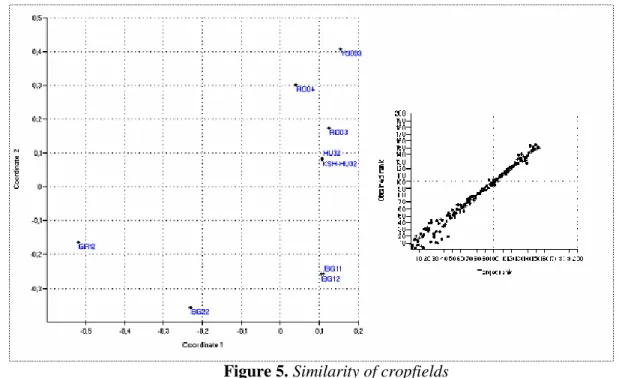
The ratio of cropfields to the arable land also was analyze by NMDS based on euclidean method (Figure 5.). This analysis is good for deeper understand the differences in landuse types.
The result of NMDS shows that the regions are distincting and leading to one row. Can be seen that Hungary also in the middle of the RO and YU regions and BG GR regions.
Figure 5. Similarity of cropfields
From the relative values seems that the YU003 and RO03 regions are the closest ones the BG and GR regions are far and different. From topographic conditions the souther regions the BG is closer than the GR. The closest regions are in the other directions than the farest ones, but all regions are on one line. Behind the differences and the similarity stands the use of maizefield. Can be seen the cornbelt, because the climatic conditions of the souther regions are better than in Hungary, for the farest regions are worther. Same by the wheat in the Duna basin, the ratio of that wheat is higher than in Hungary also by the sunflower. But behind the differences in the ratio of sunflower stands some social behavior, in the south they prefer the olive oil instead of sunfloweroil.
A smaller climate change leads to the shift into the cornbelt to the YU and RO03 region with higher ratio of maize, higher changes will an over shifting on the cornbelt leads to lower ration.
By the analyzie of the relative data the basic similarity can be defined.
1. The ratio of the maize is increasing for the next decades and decreasing for the middle of the centura, as the move into the cornbelt and after overshifting.
2. The ratio of wheat increasing.
3. The barley is opposite to the maize, first decreasing after increasing.
4. The use of rice is important only at the souther regions if we have ehough water. This will be a main question in the souther regions.
5. Potato needs lower temperature, so as we waited the ratio is lower in the south regions.
6. The use of sunflower is decreasing only in GR regions, thie because the social behaviour, they using tha olive oil instead of sunfloweroil.
As at the landuse the calculating of the diversity also neede at the ratio of cropfields. At the ratio of cropfield we can say the same as at the diversity of landuse. The diversity is higher than in the Debrecen region, which leads to decreasing the risk of climate change. This is only truth by the diversity of the dominant crops. The diversity is lower when we entering the cornbelt and higher when we left it.
Interesting if we check the yield of the crops in the analogue regions. The yield as usual opposite than the ratuio of the crops. Tha maize have smaller yield in the cornbelt, than outside of that. The yield of wheat and the sunflower is also lower to the south.
This couses trace back to three reason.
Where the climatic conditions are better the farmers try to use these crops on worther soil conditions, what is lead to lower yield.
As the maize and the wheat are very important foodcrops so if the yields is lower they using it on bigger fields.
When the climatic condition are better, financially is better to save money on the agricultural technics instead of higher yield.
Analysis of polish analogue regions by land use and cropfields
As in the previous resarch, we make the same analysisesm for the polish regions. About the landuse we used also the NMDS, we find that the regions are in the same derictions as far as they are in time. So the seen differences as the south regions can’t be find but the ratio of the forest are much more higher than Hungary.
For further analysis we calculate the diversity of the landus types and the ratio of the cropfields. We can see differences from the side of environment only in the use of forest.
By the crops, as at the landuse, all polish region in one direction. The main differences are in the use of maize and the sunflower they ration are lower than in Hungary. Correspondently the ratio of rye, barley and potato are much higher. With the ckimate change, the ration of maize and sunflower can be much higher. For the yield data we can say the sam a sin the previous, the lower ratio leads to higher yield in every crop. This previously discussed.
Analysis of analogue regions by natural vegetation
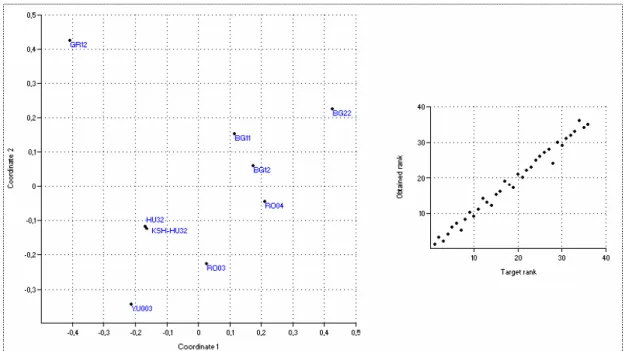
With the use of the NMDS (Figure 6.), can be seen that as we waited the geographically close regions are close by the vegetation. On the y axis we can see the south-north directions. At the polish regions the coniferous woods in the south regions the deciduous wood and the shclerophil vegetation is the dominant, the hungarian and serb regions are transitional. In these regions the ratio of the natural vegetation are the smallest, this because of the geographical condition (they are flat plains) and the use of arable lands.
P L11
P L43
P L41 P L61
P L12 P L31
HU32 YU03
RO03
RO04 B G11
B G12
B G22 GR12
-0,2 -0,1 0 0,1 0,2 0,3 0,4 0,5 0,6
C o o rdinate 1 -0,2
-0,1 0 0,1 0,2 0,3
Coordinate 2
. Figure 6. Similarity of analogue regions by natural vegetation
In the similarity pattern we also can see the differences of the vegetation types as we waited. But we can consider, that the feasible area of the natural vegetation always bigger than the real area because the human activities. There are some differences in the regions about the forest type, but the greek regions differ more by floristic and phisiognomical consition.
We can find more information if we using the EEA classification, by the ecological and biogeographical regions. The ecological flavour of the hungarian region is as an island- as the Carpathian basin- stand in Europe’s map. Our status is differ to the others. Because of that, a small changing in climate will change radically the natural system. This call the attention to more on environment, safe of biodiversity and build adaptration strategies.
It can bee state the our natural resources are in only small places, they will suffer from a climate change.
Theses
1. We developed the new method by generalizing the climex method with a new λ parameter.
We this new method we can weight the temperature and the precipitation, so the method can be cropspecific. We also developed a new method, with that we can search for regions which climate in the future will be similar to ours in the present.
2. We state, that the analogue regions to debreceni n the next decades will be 250-450 kms south to Hungary, for the middle of the century this shifting is 450-650 kms. This regiond are in Serbia, South-Romania, North-Bulgaria (YU003, RO03, RO04, BG11, BG12). For 2041–2070 period the analogue regions are in Middle-Bulgaria and Greece (BG22, GR12).
For the 2071–2100 period there are no analogue regions in Europe, only in North-Africa.
3. We state that the north analogue regions are in Poland. For the 2011–2040 period the regions are the PL11, PL41, PL43, for the 2041–2070 period are the PL61, PL12, PL31 regions. The analogue regions are differ to the different scenarios and for different periods.
Fort he closest peroods the scenarios are mostly shows the same regions, the differences between them are more significant in later periods.
4. From the land use of different analogues regions we can say that the forest and the paisture is more important. The diversity of the regions are the same or higher than in Hungary. The ratio of maize and wheat is higher than in Hungary in 2011-2040, and lower in 2041-2070.
We can say that the yields are higher in the lower used crops. The comparison of analogue regions are good only for state general statements, for further analisys we need more resarch. We can’t eliminate the social behaviour of the analogue regions because they determine the landus e and the cropuse.
5. Analysing the natural vegetation, we can say, that coverages of the natural vegetation is higher in the analogue regions than in Hungary. To the north the coniferous woods to the south is the dfeciduous woods are the dominant. Only in the greek regions the schlerophill vegetation is teh dominant. The biogeographical zonality shows that Hungary in a worth position, because all the other region are in a different biogeographical zone, so for a small changes we ru out of our region.
Discussion
We developed a new method for spatial analogy witk generalizing it with a λ parameter, with that we can weight the remperature and the precipitation. With different weight w eget different areas, they not differ very much, but we can get areas which are similar by the temperature and not by the precipitation and vice versa. To find the analogue regions we should use the limiting parameters and their weights, but we should say that there are soma climatic and not climatic parameter which won’t change (radiation, daytime, geographic, soiltypes etc.) To weight the parameters we need some recommendation from experts.
We start the new face of analogy, we can search for regions which climate will be similar to our study area in the present. With this method we cancarachterizing regins where we can sell our knowledge, where needed our experts.
For further researh we can develop the method, by using more parameter minimum maximum temperature cloud coverage and some non climatic parameter as soil types or soil conditions. If we using more parameters the analogue regions are restricted.
Higher diversity of a regions leads to less risk in climate change and less financial risk, so different climatic condition, differnet crops and agricultiral technics has a potential to adapt to changing climate or extreme weather events. It is needed to keep the diversity on high level.
To develop adaptation technics we should learn from our neighbourhood, analys thie landuse and cropping technics.
For the next decades we should change some of our crops and try to use more diverse landuse (new forests, better water management, emission reduction). For the middle of the century we should change drastically, we should change the crop patterns, we should use new technincs, active environment conversation. After 2071 we can’t say anything the changes more drasticly and extreme, build adaptation strategis for that perod is impossoble.
The results of this research are usable in agriculture, spatial planing, environment and conservation, and open a new window to analise the effect of climate change
The conclusion about agriculture leads to find adaptation strategies, opening the landuse possibilities, which can support mitigation. The adaptation means to change crop patterns support systems crops or crop spieces and decreasing the ratio of intensive agrocultural fields. All of the results shows tha we need to change our behaviour about environment and conservation. Instead on conserv the environment we shoul help tp keep the biodiversity on higher level. For this we shoul reduct the carbon emission and with active help on the natural processes. But it is very hard to import these technics because the ecology of Hungary differ more from the analogue regions. In our case we should open new emergency ways to our vegetation and develop the eco-engineering systems, mostly to Poland. This has to job, to help to intriduce new ecosystems, and to help to adapt to older ones. The aim is to reduce the harmful effects and help to settelment new spieces, but its not enough. With the spatial analogy we can look for the possible newcoming spieces which are adaspted to their climate, possibly they can move northward. The other job is to conserv the spieces how can’t adapt to changing climate, we should look for areas which climate will be sam as ours now (these regions are in Poland). Also needed -becouse the previuos- to cooperate within the national environmentprotectio agencies, to help to open the emergeny ways.
It has also financial questions about the conservation and environment protection, but the involved sectors are sometimes on the opposite site. To solve these problem the ecological economy can help to determine the changes in monetary ways. The most important research was by Constanza in 1997, how to calculate the value of the biosphere and biosphereservices. It impressed other scientist to develop the method and other to criticise. The othres are afraid of the the biosphere can be bought. But that’s not true. We used the price as a general unit and we use it to compare different habitats by their services. This comparison can be a base of a new agricultural support system which is using climatic environmental protection aspects and control the economy.
As at the emission markets we can develop new methods in adaptation and mitigation to climate
change. With that we can support environment protection projects, decrease the ratio of the intensive agricultural fields or ecofriendly agriculture. The exact cost–benefit analysis of the environment protection part of the national adaptation strategy can’t be imagine. But without that it’s weak.
For all of the previous questions and to solve these problems or just help to solve them the method of spatial analogy can be an excellent solution.
Publications
1. Horváth, L. - Hufnagel, L. - Révész A. - Gaál M. - Ladányi M. - Erdélyi É. (2002):
Agroökoszisztémák modellezése "Stabilitás és intézményrendszere az agrárgazdaságban"
tudományos konferencia kiadvány (Keszthely, 2002. szept. 26-27.), pp.45.
2. Horváth L.-Gaál M.-Hufnagel L.: Modelling of spatio-temporal patterns of ecosystem in agricultural field. EFITA 2003, Debrecen, Hungary.pp. 876-889
3. M. Ladányi, M. Gaál, L. Horváth, L. Hufnagel, A. Révész and É Erdélyi: An agro-ecosystem simulation model for precision agriculture. ECPA-ECPLF conference, Berlin, Germany. pp 469- 470
4. Ladányi, M., Horváth, L., Gaál, M., Hufnagel, L. (2003) An agro-ecological simulation model system – Applied Ecology and Environmental Research, 1(1-2): 47-74
5. Horváth, L., Kocsis, M. (2003) Ökológiai alkalmazkodás mérésének új lehetőségei LOV tudományos ülésszak 2003. november 6-7 Agrárinformatika és modellezés szekció Budapest pp 36-37
6. Horváth, L., Kocsis, M. (2005) A fenntarható fejlődés kérdései VII. Magyar Biometriai és Biomatematikai Konferencia 2005. július 5-6., Budapest p13
7. Horváth, L., Hufnagel, L., Gaál, M., Petrányi, G. (2006): Klíma és mezőgazdaság – VAHAVA zárókonferencia (poszterek összefoglalói)
8. Eva Erdelyi, Levente Horvath, Daniella Boksai, Antal Ferenczy (2006): How climate change influences the field crop production –yield variability of maize IV International Eco-Conference on Safe Food - Novi Sad 2006. p1-6
9. Levente Horvath, Eva Erdelyi (2006): How climate change influences the field crop production –use of spatial analogy IV International Eco-Conference on Safe Food - Novi Sad 2006. p7-12
10. Erdélyi, Éva- Horváth, Levente (2006) Climate Change and Precipitation Needs of Winter Wheat Summer University on IT in Ag. and Rural Development 2006 Debrecen p33-41
11. Horváth, Levente - Gaál, Márta - Erdélyi, Éva (2006): Use of the Spatial Analogy in Climate Change Research Summer University on IT in Ag. and Rural Development 2006 Debrecen p48-55 12. Salga, Péter - Horváth, Levente (2006):Modelling Climate Change Using Neural Network Summer University on IT in Ag. and Rural Development 2006 Debrecen
13. Levente Horváth, Márta Gaál (2006): Spatial analogies in service of climate change analysis
6th Annual Meeting of the EMS / 6th ECAC 4 - 8 September 2006 Ljubljana, Slovenia abstract cd-rom ISSN 1812-7053
14. Márta Gaál, Levente Horváth (2006) Geographical analogies in climate change research ESF Workshop, Volos, Greece, 20 - 23 September 2006
15. Péter Salga, Marianna Medveczki, Levente Horvath (2006) Modeling climate change using Neural Networks ESF Workshop, Volos, Greece, 20 - 23 September 2006
16. N. Solymosi, Á. Maróti-Agóts, L. Ózsvári, L. Könyves, L. Horváth and A. Kern. (2007) Region specific heat stress forecastfor cattleproduction based on climatechange. GISVET'07, Coppenhagen, 22-24 August 2007
17. L. Horváth, M. Gaál, N. Solymosi (2007) Spatial analogues in climate change research EFITA/WCCA 2 – 5 July 2007, Glasgow, Scotland, Paper CD-ROM p22
18. K. Szenteleki, M. Ladányi, É. Szabó, L. Horváth, L. Hufnagel and A. Révész (2007) A climate research database management software EFITA/WCCA 2 – 5 July 2007, Glasgow, Scotland, Paper CD.ROM p53
19. Horváth L., Gaál M., Solymosi N. (2007): Use of the spatial analogy to understand the effects of climate change. 9th Int. Symposium Interdisciplinary Regional Research, Novi Sad, Serbia p23 20. Horváth Levente (2007): Földrajzi analógia meghatározásának néhány módszere és alkalmazási lehetősége KLIMA 21 Füzetek p54-62
21. Petrányi Gergely, Hufnagel Levente, Horváth Levente (2007): A klímaváltozás és a biodiverzitás kapcsolata – Földrajzi analógiai esettanulmány az európai lepkefaunára „KLIMA 21” Füzetek p62-70
22. Szenteleki K., Ladányi M., Erdélyi É., Horváth L., Hufnagel L., Révész A. (2007):A KKT Klímakutatás adatbáziskezelő szoftver, XLIX. Georgikon Napok, Keszthely, 2007. szeptember 20- 21., p. 116.
23. Norbert Solymosi, Anikó Kern, Levente Horváth, Ákos Maróti-Agócs, Károly Erdélyi (2008): TETYN: An easy to use tool for extracting climatic parameters from Tyndall datasets, Environmental Modelling and Software 23. pp 948-949 IF:1,992
24. Levente Horvath, Marta Gaal, Norbert Solymosi (2008): Use of the spatial analogy to understand the effects of climate change, in Environmental And Social Issues Of The Southeast Pannonian Region: Multidisciplinary Approaches, The Scientific World, 2008.
25. Levente Horvath (2008): Use of the spatial analogy method to analyse to possible landuse change in Hungary Agricultural Information and IT Edited by Takashi Nagatsuka and Seishi Ninomiya August 24 – 27, 2008 at Tokyo University of Agriculture Proceedings of IAALD AFITA WCCA2008 (ISBN 978-4-931250-02-4) pp 209-214
26. Karoly Szenteleki, Levente Horvath and Márta Ladányi (2008): Climate Analogies and Risk Analysis of Hungarian Viticulture pp Agricultural Information and IT Edited by Takashi Nagatsuka and Seishi Ninomiya August 24 – 27, 2008 at Tokyo University of Agriculture Proceedings of IAALD AFITA WCCA2008 (ISBN 978-4-931250-02-4) pp389-396
27. Levente Horvath, Norbert Solymosi, Aniko Kern, Ákos Maróti-Ágocs, Károly Erdélyi (2008): TETYN: An Easy to Use Tool for Extracting Climatic Parameters from Tyndall Data Sets Agricultural Information and IT Edited by Takashi Nagatsuka and Seishi Ninomiya August 24 – 27, 2008 at Tokyo University of Agriculture Proceedings of IAALD AFITA WCCA2008 (ISBN 978-4-931250-02-4) pp1053-1058
28. Márta Gaál and Levente Horváth (2008): Climate change effects on the maize growing season Agricultural Information and IT Edited by Takashi Nagatsuka and Seishi Ninomiya August 24 – 27, 2008 at Tokyo University of Agriculture Proceedings of IAALD AFITA WCCA2008 (ISBN 978-4-931250-02-4) pp107-112