Eötvös Loránd Tudományegyetem
MTA doktori értekezés
Szövetszerkezet kialakulásának kristálytani aspektusai polikristályos Al rendszerekben
Írta Prof. Dr. SIDOR Jurij Informatikai Kar Savaria Műszaki Intézet
Szombathely, 2020
Eötvös Loránd University
Doctoral Dissertation
for gaining the degree of Doctor of the Hungarian Academy of Sciences
Crystallographic aspects of microstructure evolution in polycrystalline Al systems
Prof. Dr. Jurij SIDOR
Faculty of Informatics
Savaria Institute of Technology
Table of Contents
1. Introduction 1
2. Importance and major goals of the research 2
3. Materials, experimental procedures, computational methods and texture description
4 3.1 Materials, experimental and computational procedures 4 3.2 Brief review on texture in metals with face centered cubic crystal
structure
6 4. Texture development during deformation: experimental evidences and
numerical approaches
13 4.1 Concise description of modeling approaches employed in simulation of
deformation textures
13
4.1.1 Crystal plasticity models 16
4.1.2 Modeling the material’s flow by continuum mechanics-based approaches
19 4.2 Symmetric rolling: experimental evidences and simulation procedures 36 4.2.1 Crystallographic aspect of microstructure evolution in Al alloys during
symmetric rolling
36 4.2.2 Modeling the averaged through-thickness textures 40 4.2.3 Modeling the texture heterogeneities across the thickness 48
4.2.4 Remarks on texture modeling 49
4.3 Asymmetric rolling 53
4.4 Accumulative roll bonding 62
4.5 Severely deformed sheets by conventional rolling 65
5. Recrystallization 75
5.1 Diversity of annealing textures in Al alloys: theoretical background and experimentally observed evidences
75
5.2 Recrystallization texture modeling 83
6. Plastic anisotropy: experiment and modeling 89
7. Summary 96
8. New Scientific Results, Theses 98
References 100
Dedicated to my beloved ones: daughters Krisztina and Anna as well as my wife Andriana.
Acknowledgement
This work would not have been possible without the support of my wife Andriana, brother József and sister in law Mila as well as my dear parents Magdolna and József.
Special thanks to my friends and former colleagues: Roumen Petrov, Leo Kestens, Alexis Miroux, Tricia Bennett, Orlando Leon, Maria Santofimia, Tuan Nguyen, Victor Carretero, Alexandar Davidkov, Vitaliy Blyznyuk, Hadi Pirgazi, Edgar Gomes, Elisabete Pinto, Koen Decroos and Linsey Lapeire, with whom I spent nine wonderful years in Delft and Ghent.
Jaroslav Kish is gratefully acknowledged for his friendship and numerous consultations on C++ programming.
Paul van Houtte, Ricardo Lebensohn, Qingge Xie and Anand Kanjarla are gratefully acknowledged for collaboration, making available crystal plasticity codes and many fruitful discussions.
List of abbreviations
Alamel – advanced Lamel (model);
ARB – Accumulative roll bonding;
ASR – asymmetric rolling;
BCC – body centered cubic (crystal structure);
CP – crystal plasticity;
DC – Direct Chill (casting);
EBSD – electron back scattering diffraction;
FCC – face centered cubic (crystal structure);
FCT – full constraints Taylor model;
FEM – finite element model;
FLM – flow line model;
GPT – Growth potential textures;
HAGB – high angle grain boundaries;
HEM – homogeneous effective medium;
HSZ – highly strained zones;
ID – texture index difference;
IDN – normalized texture index difference;
IPF – inverse pole figure;
ND – normal direction;
ODF – orientation distribution function;
PADZ – particle affected deformation zone;
PF – pole figure;
PSC – plane strain compression;
PSN – particle stimulated nucleation;
RD – rolling direction;
RVE – representative volume element;
RX – recrystallization;
SFE – stacking fault energy;
SGM – simple geometric model;
SIBM – strain induced boundary migration;
SPD – severe plastic deformation;
TD – transverse direction;
TF – Taylor factor;
TI – texture index;
TMP – thermomechanical processes;
VPSC – visco plastic self-consistent (model).
1. Introduction
Before reaching the final shape, metals are subjected to an intricate sequence of thermomechanical processes (TMP). In case of flat rolled products, the TMP comprises series of rolling and heat treatment steps, as it is revealed in Fig. 1.1. In commercial technological chain, the production of Al alloys starts with Direct Chill (DC)-casting to large ingots, which are subjected to homogenization annealing at 480-580 °C [1, 2s]*. Both the intercellular segregations and the soluble phases are dissolved in the course of homogenization treatment.
Afterward, the ingot is transferred to the breakdown rolling mill (which could be either unidirectional or reversible) at elevated temperature. This technological step is followed by a high-speed multi-stand tandem hot rolling. The hot bands are coiled and cooled to room temperature before it is cold rolled to its final thickness, typically in the range of 0.6–1.2 mm.
In some exceptional instances, materials are subjected to intermediate annealing. Subsequent to cold rolling, the deformed sheet is recrystallized in an annealing treatment, which is most commonly carried out on a continuous processing line. First the material is reheated to the recrystallization temperature to dissolve the hardening phases and then quenched to retain the alloying elements in solid solution. The cold rolled sheet tends to recrystallize during the reheating stage. After annealing, the age hardenable Al alloys are pre-aged for stabilization and improvement of age hardening response before being supplied for further stamping or other deformation operations.
Fig. 1.1. Schematic illustration of TMP of flat Al products [2s].
This work summarizes scientific activities in the field of microstructure and texture control in Al alloys described in great detail in Refs. [2s-35s] and focuses on the microstructural transformations involved in the last two steps of TMP chain, i.e. cold rolling and recrystallization annealing. The research activities, presented in this scientific contribution, cover the area of both conventional and innovative processing technologies. The last are as yet far away from industrial implementation, however, they may allow exploring the limits of material’s performance. In conventionally produced materials, a particular property can be improved at the expense of others, while the aim of non-conventional processing is to enhance a spectrum of specific properties. The research program is mainly focused on the TMP of polycrystalline systems, which undergo various microstructural transformations (from nano to mm scale) and lead to the presence of preferred crystal orientations, called crystallographic texture. It is shown that particular “genetic” crystallographic correlations could be found on macro, micro and nanoscale lengths in the metallic materials. Furthermore, a spectrum of properties could be varied during the TMP without changing the chemical composition in a material. By way of contrast to conventional processing, the innovative technologies are capable of providing entirely new nano, micro and crystallographic features in polycrystalline aggregates and thus a spectrum of mechanical properties could be enhanced.
2. Importance and major goals of the research
The combined generic and applied aspects of the innovative technologies might explore new approaches in conventional technological processing of materials, which will allow improving existing and developing entirely new processes, capable of supplying materials with significantly improved qualities. For instance, both the yield stress and ultimate strength can be increased relatively easily in conventionally produced Al-alloys, however, the deep drawing quality of these materials drops due to crystallographic texture evolved. A solution to this problem can be found in non-conventional processing [18s, 20s, 36-49].
A material subjected to thermomechanical processing undergoes various solid-state transformations, which may lead to the presence of preferred crystal orientations and hence will induce a specific texture that is characteristic for the particular process in the TMP chain. The evolution of preferred crystallographic orientations in the rolled materials accounts for plastic anisotropy that conditions the practical application of materials, especially in deep-drawing
compared to FCC (face centered cubic crystal structure) materials [50, 51]. The main reason for this difference is the diverse types of crystallographic textures developed during the processing chain. The conventional measure of anisotropy is the Lankford value (r-value or normal anisotropy) measured in a tensile test at various angles with respect to the rolling direction (RD) and averaged by a trapezoidal rule. The normal anisotropy is defined as the ratio of the logarithmic strain in the sheet transverse direction to the logarithmic strain in the sheet normal direction (ND). The planar anisotropy is evaluated based on the r-value profile in the plane of a rolled sheet. In order to ensure a minimum level of deep-drawability, the material should exceed a normal anisotropy of 1 while the in-plane anisotropy should be minimized in the ideal case to 0.
During thermomechanical processing, the evolution of texture starts with the hot rolling process. Depending on the hot rolling conditions, the hot band texture is dominated by deformation or recrystallization (RX) texture components (texture is discussed in detail in the following section) or a combination of both. BCC metals like ferritic steels are usually characterized by the -fibre texture which is favorable for drawability. This texture naturally appears in BCC materials after conventional rolling and subsequent annealing. The -fibre texture ensures a high normal anisotropy of ~2 or even higher. However, in conventional rolling of FCC materials like aluminum alloys, the so-called -fibre characterizes the deformation texture. The evolution of the crystallographic texture during recrystallization annealing is determined by a variety of process parameters and the precise chemical composition of the alloy. The -type rolling texture is retained during continuous recrystallization, whereas discontinuous recrystallization accounts for an annealing texture dominated by the fibres and components different from the deformation counterparts.
Many efforts have been made to obtain a favorable deep drawing texture in Al alloys by means of conventional thermomechanical processing, but no satisfactory result has been obtained so far. Hence, the manufacturing process should be modified so as to strengthen the shear-type texture in the final product via modified conventional and non-conventional techniques. The non-conventional methods extend the possibilities for microstructure and properties control in rolled sheet and hence deserve a special attention from the research community.
In view of the above, the following aims were defined:
1. Clarifying the evolution of deformation textures in FCC metals during conventional and innovative processing methods by means of experimental evidences and numerical approaches.
2. Introducing effective modeling strategies for simulation of deformation textures by combining basic principles of crystal plasticity theories.
3. Developing and employing computationally efficient and accurate numerical approaches, which are capable of predicting the deformation flow of metals and can ensure quantitatively reasonable texture simulation in combination with the well-established crystal plasticity models.
4. Resolving the diversity of annealing textures in Al alloys by experimental observations and modeling approaches.
5. Comparing the crystallographic features of conventionally and non-conventionally processed Al alloys.
6. Explaining the microstructural heterogeneities, which tend to emerge during both deformation and recrystallization.
7. Analyzing the major sources of plastic anisotropy in Al alloys and employing efficient computational approaches for simulation of both normal and planar anisotropy.
8. Assessment of plastic strain ratio in terms of microstructural features and definition of the representative volume element for successful simulation of Lankford profile.
3. Materials, experimental procedures, computational methods, and texture description 3.1 Materials, experimental and computational procedures
In the current work, the evolution of crystallographic texture was studied in Al alloys from 3xxx, 5xxx, and 6xxx series: 6016 (Al-(0.25-06)Mg-(1-1.5)Si), 5182 (Al–2.8Mg–0.21Mn–
0.14Si) and 3003 (Al-1.1Mn-0.4Fe-0.2Cu). It should be mentioned here that both the exact sample preparation procedure and corresponding investigation methodology are presented in detail in references [2s-35s]. The investigated materials for symmetric and asymmetric rolling were selected after casting, hot rolling or cold rolling followed by recrystallization annealing.
technique. The orientation data were collected and analyzed by the commercial OIM-TSL®
software.
Sample preparation for orientation imaging microscopy (OIM) was performed according to the standard procedure, which comprises mechanical grinding and polishing as well as electrolytic polishing. The mechanical polishing procedure was finished with the DiaDuo-2 Struers®-type 1 m diamond paste. The electrolytic polishing, as a final step of sample preparation for EBSD, was conducted for ~1 min at a voltage ranging between 18V and 30V with A2 Struers®
electrolyte, cooled to temperatures between -5 and 0°C.
The Hikari-type EBSD detector was attached to a scanning electron microscope (SEM). The OIM data of the investigated material with fully recrystallized microstructure were collected at the acceleration voltage of 20kV, whereas, in the cold rolled sample, to avoid overlapping of acquired pattern with ones originating from the deeper layers, the acquisition was performed at a comparatively low acceleration voltage of SEM. Application of 15kV guaranteed appropriate OIM data acquisition. During OIM measurements, the sample was 70° tilted with respect to the EBSD detector. The EBSD mapping was performed on a hexagonal scan grid in the plane perpendicular to the sample transverse direction (TD-plane) extending over the entire thickness of the investigated sample.
In some instances, cold rolling textures were determined by measuring X-ray pole figures in the back-reflection mode. From a set of four pole figures ({111}, {200}, {220}, {311}) the orientation distribution functions were calculated using the conventional series expansion method. The XRD texture was measured in the surface and sub-surface regions both from the top and the bottom sides and also in the mid-thickness section of the sheets. The through- thickness texture was calculated by integrating all the sub-layer textures into one average texture. The orientation data were post-processed with the MTM-FHM software developed by Paul Van Houtte ©.
To enable the simulations of texture evolution by the Taylor-type homogenization crystal plasticity (CP) approaches employed, the deformation history in a form of strain velocity gradients should be provided to the given CP model. Both two-dimensional finite element method (FEM) (Deform 2D®) and recently developed flow-line model (FLM) [12s], as well as simple geometric model (SGM) [4s], were employed in the calculation of deformation flow.
These approximations are capable of capturing strain heterogeneities across the thickness of a cold rolled sheet. In the FLM and FEM simulations, the material subjected to rolling was considered as plastic and isotropic. In FEM, the strain hardening phenomenon was described
with the stress-strain curve fitted by piecewise linear segments, whereas the rolls were considered as fully rigid objects. Contrarily to FEM, the FLM employed neglects the strain hardening effect. The extracted outputs were used as an input for CP calculations. Results obtained by FEM-CP, SGM-CP and FLM-CP simulations were compared to each other and likewise with the experimentally measured counterparts.
3.2 Brief review on texture in metals with a face-centered cubic crystal structure
The evolution of crystallographic orientations during the thermomechanical processing chain is not of random nature and strongly influences the final properties of polycrystalline systems.
More specifically the crystallographic texture is a major source of planar anisotropy of numerous mechanical and physical properties. In general, it can be said that material properties that are anisotropic in the single crystal are texture dependent in the polycrystalline aggregate.
There are many ways to describe the crystallographic texture in materials. In metals, pole figures (PF) and orientation distribution function (ODF) are the most frequently used methods to reveal the crystallographic nature of these polycrystalline systems [50-52]. However, it should be underlined, that texture representation by pole figures is not fully complete, since the PF reveals the distribution of a single direction of crystallographic lattice plane normal and, therefore, it is not possible to gain complete information on orientation of individual grains. In view of this, it is more reasonable to analyze the texture in terms of ODF. The crystallographic orientation of particular volume element with orientation (hkl)[uvw] (hkl and uvw are Miller indices, which refer to plane and direction) can be described in terms of three Euler angles (1,
and 2). The relation between Miller indices and Euler angles is defined by the following equations [52]:
h =sin sin2 (3.1)
k =sin cos2 (3.2)
l = cos (3.3)
u = cos1 cos2 - sin1 sin2 cos (3.4) v = -cos1 sin2 - sin1 cos2 cos (3.5)
w = sin1 sin (3.6)
k/l = cos2 tan (3.7)
h/k = tan2 (3.8)
The ODF method was developed originally for flat materials with cubic crystal structures. The orientation distribution function is defined as a probability density function of given orientations. In the most general case, the ranges of the Euler angles are: 01, 2360° and 0180°; whereas for rolled materials with cubic crystal structure: 01, 2,90°. It should be underlined here that if the orthotropic sample symmetry is broken (a typical example is asymmetric rolling), then the texture should be visualized in the following range: 01360°
while 02, 90°. Results of measurements, such as electron backscattering diffraction (EBSD), comprise data in discrete form and, hence, this dataset (see Fig. 3.1) needs to be transformed into a continuous function. Generally, this is done by employing spherical harmonic functions. The detailed mathematical algorithm, necessary to construct the ODF, is described by Bunge [52]. The interpretation of ODF, presented in 3D Euler space, is complicated and therefore the texture is usually shown as a series of sections in the form of contour maps taken through the 3D ODF space at 2 ranging from 0 to 90° (see Fig. 3.2).
During metal processing, a specific texture evolves during both hot and cold rolling of flat- rolled plates and sheets [17s, 51, 53-62]. The crystallographic changes involved in rolling are the consequence of the deformation mechanisms such as slip or twining. In turn, the dominant deformation mechanism depends on the stacking fault energy (SFE) of a material. In metals of medium and high SFE [51] (SFE > 0.25mJm-2), dislocation glide is dominant and the pre-rolling texture tends to rotate towards the (110||ND) and fibres (see Figs. 3.3-3.5). The -fiber is usually dominated by the Goss ({110}001) and Brass ({110}112-B) orientations. The and Fig. 3.1. Discrete dataset and continuous ODF in Euler space.
1
2
Discrete Continuous
-fibre textures are also known as pure metal textures. In metals of low SFE [51]
(SFE<0.25mJ/m2) such as Cu-Zn alloys (e.g. brass), the rolling texture is usually characterized by a strong {110}112 orientation and the -fibre (111||ND) texture components. This type of texture is also called the alloy-type texture since the alloying elements tend to reduce the SFE in metals.
The appearance of the -fibre (100||ND) orientations such as cube ({100}001) and the 45°
rotated cube component ({100}011) in rolled material of high SFE is associated with the stability of the {100}001 orientation during rolling (due to the high symmetry of the cube orientation) and the occurrence of surface shear deformation, respectively [51]. A low-stacking fault energy austenitic Fe–Mn–C alloy (SFE ~ 20 to 40 mJ/m2) exhibit both and -fibre orientations [58]. Similarly to brass, in the Fe–Mn–C alloy the intensity of orientations close to the {112}111 component (C or copper component) tends to fade. However, in brass the {112}111 is replaced by -fibre orientations whereas the Fe–Mn–C alloy reveals a consistent tube of orientations which extends from the C component towards the inverse brass component ({112}110) [58]. The appearance of a {110}112 dominated texture in low SFE materials is Fig. 3.2. Continuous orientation distribution function in Euler space (a); and corresponding contour maps of the ODF (b).
(a) (b)
Generally, the -fibre is defined by a continuous orientation path in Euler space connecting a fibre of maximum intensity. Only a limited number of components along this fibre are described with low-index Miller indices [51-57, 62-68]. Different research groups have defined diverse stable orientations associated with deformation textures in FCC materials [51, 64, 65]. Hirsch and Lücke unified the deformation texture components into a fibre which connects the maxima in Euler space within a certain orientation spread [53]. Fig. 3.5 shows the position of these maxima along the -fibre (running from the C to the B orientation in the first sub-space) observed in different materials [53-56]. It is obvious that the crystallographic position of the skeleton line varies from one material to another, depending on the SFE and the deformation mechanism. Significant differences are observed in the position of maxima between 70:30 brass (SFE ~20 mJ/m2 [51]) and materials of higher SFE with a Cu-type texture. In brass, a consistent decrease in intensity is observed from {110}112 towards {123}634 (S), whereas the -fibre tends to weaken or even totally vanishes in the vicinity of the {112}111 orientation [53].
Though the reported -fibre textures, observed in both FCC and BCC structured metals, are described as an orientation tube or a skeleton line connecting the orientations {112}111 and {110}112 through the component {123}634 [51-57, 64-68], this description is far from complete as it leaves the precise position of the fibre skeleton subject to scatter of numerous experimental observations. A precise crystallographic description of the fibres is required in order to enable the analysis of the deformation textures. The planes and axes of the deformation fibres (, , and ) shown in Fig.3.4 are well defined, whereas the same cannot be said about Fig. 3.3. Continuous orientation path (-fibre) connecting the {112}111 and {101}121
orientations in Euler space.
the -fibre. The proposed analytical description of the -fibre by Sidor and Kestens [13s]
reveals that copper and brass orientations are connected in the Euler space via the number of precisely defined components:
, 1, 1
( 1), 2 ( 1), 2 23 / 4 1/ 2 3 / 4 1/ 2
h h h h h h
h h
h h h h
+ +
+ +
− − − − (3.10)
-fibre
2=45°
Fig. 3.4. Main orientations and fibres which tend to appear in materials with FCC crystal structure [2s, 13s, 18s].
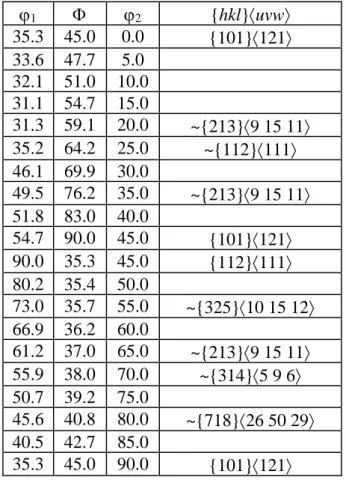
Formula 3.10 characterizes the following orientations along the -fibre: h=1 - {112}111, h=1.5 - {325}10 15 12, h=2 - {213}9 15 11, h=3 - {314}5 9 6, h=7 - {718}26 50 29 etc and when h→∞ the formula reproduces the brass component {101}121. This analytical approximation of the -fibre allows analyzing a deviation of specific texture components along this fibre with respect to its exact position (see Table 3.1 for details).
Table 3.1. The coordinates of -fibre components in Euler space as predicted by formula 3.10.
Control of the deformed state is of key importance since it determines the initial structure for the subsequent recrystallization treatment. This is particularly true for texture as there is ample evidence that the cold rolling texture is of major importance for the ensuing recrystallization texture. Various combinations of the and deformation fibres produce a vast variety of recrystallization textures that strongly differ both qualitatively and quantitatively even though the metals under consideration have comparable values of SFE [1, 2s, 51, 54, 58]. For instance, although the deformation induced crystallographic patterns are qualitatively similar after diverse rolling reductions in various Al alloys (SFE≤162 mJ/m2 [49]), the corresponding recrystallization textures, emerging after annealing, might show substantial differences [1, 54].
Generally, the ODF of conventionally cold rolled and recrystallized Al-Mg-Si alloys is typically
1 2 {hkl}uvw
35.3 45.0 0.0 {101}121
33.6 47.7 5.0 32.1 51.0 10.0 31.1 54.7 15.0
31.3 59.1 20.0 ~{213}9 15 11
35.2 64.2 25.0 ~{112}111
46.1 69.9 30.0
49.5 76.2 35.0 ~{213}9 15 11
51.8 83.0 40.0
54.7 90.0 45.0 {101}121
90.0 35.3 45.0 {112}111
80.2 35.4 50.0
73.0 35.7 55.0 ~{325}10 15 12
66.9 36.2 60.0
61.2 37.0 65.0 ~{213}9 15 11
55.9 38.0 70.0 ~{314}5 9 6
50.7 39.2 75.0
45.6 40.8 80.0 ~{718}26 50 29
40.5 42.7 85.0
35.3 45.0 90.0 {101}121
characterized by the P, Goss and orientations scattered along the -fibre, while TMP of commercially pure Al triggers evolution of a single strong component from the -fibre, i.e. cube orientation [1, 2s]. Additionally, the qualitatively similar rolling textures, evolved in Al-Mg alloy after different straining levels, give rise to development of orientations characterized by different degrees of rotation along the -fibre [17s]. The differences in RX textures are attributed to various mechanisms of recrystallization [51, 62] which are affected by the deformed state, i.e. the deformed microstructure and associated deformation texture. In the most general case, it can be said that during discontinuous recrystallization, occurring at elevated temperatures, the deformation fibres of Al alloys transforms to the components located mainly along the -fibre mixed with the weaker , and -fibre orientations (see Fig.3.4).
Fig. 3.5. Main fibres observed in rolled fcc materials [13s]. The points indicate maxima of orientations observed along the -fibre in different materials: ( ) 70:30 brass after 75%
rolling reduction [53]; ( ) commercial purity Al (AA1145) after 95% cold rolling. [54] ( ) - Ni-5%W alloy after 95% cold rolling [55]; ( )- Ni-3%Al alloy after 80% thickness reduction [56].
4. Texture development during deformation: experimental evidences and numerical approaches
4.1 Concise description of modeling approaches employed in simulation of deformation textures
Metals are polycrystalline aggregates composed of numerous grains, which can be considered as perfect crystals if the material is fully recrystallized. In order to predict the behavior of polycrystalline materials subjected to macroscopic load, the relationship between microstructure and properties should be known, and therefore, the physically-based modeling is of key importance. The understanding of microstructural changes is particularly important in setting-up the thermomechanical processing route. In TMP, the as-cast microstructure is subjected to continuous microstructural transformation. In the case of flat-rolled products, this transformation is conditioned by both deformation and recrystallization phenomena, since after casting the material is subjected to hot rolling which is followed by cold rolling and finally the sheet is recrystallized during the final annealing process.
Various modeling approaches, which employ diverse length scales (Fig. 4.1), have been developed to reveal the behavior of materials during TMP [69]. It is a common practice to employ phenomenological models for the optimization of properties in a group of metals, which do not reveal substantial varieties in chemical composition [69, 70]. This strategy likewise works for tailoring a certain metal grade for a particular application. The main disadvantage of the phenomenological approximations is that the model parameters need to be re-calibrated in the case of a metal grade change or if the TMP quantitative indicators are varied in a wider range of processing window. In more advanced numerical formulations such as finite element models, materials are considered as continua, and thus, the mesoscopic phenomena, occurring on the grain levels, are not accounted for in this engineering length scale (Fig. 4.1).
Nevertheless, FEM is successfully employed in many fields, especially when there is a need to simulate the response of a system, subjected to mechanical load. On the other end of the length- scale spectrum, the macroscopic properties are derived from the interatomic potentials and by engaging basic principles of molecular thermodynamics, which ensures generic information about relationships between the atomic arrangements and macroscopic properties, however, this formulation is applicable only for ideal systems. Application of atomistic length scale simulations to metals is restricted due to limitations in computational resources and also because of the fact that polycrystalline structures contain too many crystal defects even in the fully recrystallized state (typically 108 m-2).
Fig. 4.1. Variety of length scales involved in modeling the microstructure-properties relationship [3s].
Since the 1 mm thick metallic sheet of A4 size (21cm29.7cm) contains approximately 4 billion grains of various crystal orientations, assuming that the average grain size is 25 m, it becomes clear that neither engineering (continuum) nor atomistic scales are not capable of revealing the true nature of mesoscopic transformation involved in TMP. To capture the essence of microstructural changes in industrially produced materials, both mean-field and full-field crystal plasticity models are employed [11s, 69, 71-76]. Either approach implements a certain homogenization scheme inasmuch as performing calculations for the above-mentioned 4 billion crystals, consisting of even smaller entities, would require enormous computational power. In CP, homogenization implies to the characteristic length scale (mesoscopic) represented by grains of polycrystalline aggregate, and these entities are treated as perfect crystals (the in-grain heterogeneities are usually not taken into account). The mesoscopic scale tends to fall between two ends of the characteristic length spectrum, and this level of order is important from a practical perspective as many of the known properties are controlled by the grain size and crystallographic texture. CP approaches treat the polycrystalline material as a continuum at the level of crystal because the grain size is the order of magnitudes larger compared to the size of molecular domains.
From mesoscopic perspective, the external work applied macroscopically to a material is transmitted to the individual grains, generating corresponding stresses-strain state in each grain of polycrystalline aggregate. This complex process can be captured by the full-field models [69, 71, 72], which allow analyzing not only the microscopic and macroscopic responses of material
information on the deformation flow on the meso and macro length scales, their practical implementation is limited because of extensive computational time. By way of contrast, the mean-field models are more computationally efficient, but they have fewer degrees of freedom, compared to the full-field methods. For instance, in the mean-field approximations [11s, 73- 76], each grain interacts with the neighboring one in a way defined by the homogenization scheme, the misorientation in the grain developed during deformation cannot be captured, and so on. Even though some microstructural features are ignored in the Taylor-type homogenization CP formulations such as visco plastic self-consistent (VPSC) [75], advanced Lamel (Alamel) [73, 74], Cluster V [11s] etc., simulations on mesoscopic scale are still capable of providing generic knowledge on the relationship between the structure, properties and performance of a polycrystalline aggregate. The main advantage of the mean-field approaches is that texture simulations can be completed within a time-frame of several minutes on a personal computer, while crystal plasticity full-field computation for the same straining level requires a couple of days on the far more powerful computer [23s]. The polycrystal models were successfully employed for simulating the evolution of texture in metals, subjected to diverse strain modes, calculating the plastic strain ratio as well as predicting the cup-earing [2s, 7s, 11s, 20s-22s, 73-76].
In order to make the application of crystal plasticity modeling practically attainable, the CP should be accoupled with the computationally effective approach, which is capable of accurate prediction of deformation flow in a material. When it comes to rolling, the simplest approximation is the plane strain compression, which disregards many aspects of the process.
Because of its simplicity, this strain mode is often used in simulations and tends to provide a reasonable estimate of overall (bulk) texture evolution [11s, 20s, 73, 74, 77]. In FEM, the effect of many technological parameters on the deformation flow can be taken into account while the displacement history is accurately calculated for various materials at diverse temperatures, however, the model set-up and the calculation procedure are time-consuming. In view of this, deformation is often approximated by analytical solutions [12s, 78-83] such as flow-line models, which are capable of capturing many aspects of the process, however, the practical implementations of these computationally effective approaches are limited by fitting parameters, which have to be derived from the experimental data for each particular case.
Modeling the evolution of deformation texture in Al alloys, by combining basic principles of CP theories and models which are capable of predicting deformation flow, is vital since many crystallographic features evolved in deformation are directly linked to the evolution of
recrystallization texture. The last determines the plastic anisotropy and limits the forming characteristics of a material.
There are many aspects of texture evolution during cold deformation, which are still not explained by existing models. In this view, this chapter describes the computationally efficient and accurate numerical approaches which can ensure quantitatively reasonable texture simulation. The well-established CP models were accoupled with various continuum mechanics-based models, enabling the simulation of material’s flow during deformation.
4.1.1 Crystal plasticity models
Advances in crystal plasticity modeling have created a solid platform for understanding the texture evolution during processing [11s, 69, 71-76] and allowed a structure properties paradigm to be established. Development of crystallographic texture in polycrystalline materials, subjected to an arbitrary strain mode, is generally simulated by means of various CP approaches: the full constraints Taylor model (FCT) [73], the visco-plastic self-consistent (VPSC) model [75], the Alamel model [73, 74] and Cluster-V model [11s]. The common feature of CP models employed is that each particular grain is considered as a single crystal.
However, these four approaches employ diverse grain interaction phenomena.
A reference theory of plastic strain in metals proposed by Taylor [73] became a platform for various crystal plasticity approaches, enabling to trace the crystallographic changes during deformation. The Taylor model enforces strain compatibility in a way that each particular grain/crystal experiences the same deformation as the sample. In this approach, the macroscopic strain velocity field Lij and the microscopic strain velocity field of each crystal of the polycrystalline aggregate lij are identical. This approach is called a full constraints Taylor model as it maximizes the influence of geometrical constraints. In the FCT model, the deformation in each particular grain is accomplished by activation of five independent slip systems chosen by minimizing the dissipation energy P associated with this deformation. Apart from the FC approach, a short-range (Alamel) [73, 74], an intermediate-range (Cluster V) [11s] and a long- range (VPSC) [75] interaction models are employed for crystal plasticity calculations.
In multi-grain Taylor type interaction models such as Alamel or Cluster V the local interaction is assumed between a couple of grains or block of grains. In the multi-grain approaches, the global average of the strain rate tensors of the grains considered by the model is equal to the
mean value of the prescribed strain rate of the polycrystal. However, the local strain rate of the individual crystal could deviate from the mean strain rate of the polycrystalline aggregate.
In the mean-field approach such as Alamel, the grain assembly is subdivided into a number of clusters (see Fig. 4.2), consisting of two grains, whereas the interaction inside the cluster is governed by the randomly chosen grain boundary orientation. Similarly to the above-mentioned Taylor-type models [11s, 73-75], the grain pair is subjected to a strain mode identical to the macroscopic one. The two grains in Fig. 4.2 represent the crystal orientations of two boundary layers at both sides of a segment of a grain boundary. The orientations of the grain boundary segments observed in the microstructure of materials are characterized by the grain boundary segments orientation distribution function. In this way, the model takes into account the microstructural features of the material subjected to deformation. The Alamel model is based on the following principles [73, 74]: (i) the local velocity gradient field lij is not uniform through a grain; as a result, the slip rates are not uniformly distributed either; (ii) stress equilibrium between regions 1 and 2 along the considered grain boundary segment must be satisfied; (iii) the average deformation along the considered grain boundary segment must be equal to the macroscopic deformation L; (iv) the set of crystallographic orientations which develop in various regions close to the grain boundaries can be considered as the contribution of the grain to the overall deformation texture of the polycrystal; (v) in the simulation, not all grain boundary segments are considered, but only a few thousand, selected randomly. The fact that the nature of relaxations is not related to the geometry of prescribed deformation makes the Alamel model applicable for any strain mode. It means that for instance in the case of rolling, the shear plane of two considered relaxations is not necessarily parallel to the rolling plane.
The visco-plastic self-consistent crystal plasticity models are much more complex than Taylor- type models. The formal theory and a comprehensive derivation of the algebraic and tensorial equations of the visco-plastic self-consistent formalism are explained in detail elsewhere [75].
This type of approach could be classified as generalized Relaxed Constraints (RC) models, in which the relaxations are determined on the basis of interaction between one particular grain and its surroundings (see Fig. 4.2). The VPSC model [75] assumes that the interaction of a grain with the surrounding matrix can be approximated by the interaction between the grain and a hypothetical homogeneous effective medium (HEM) which is characterized by an average constitutive behavior of the entire polycrystal aggregate. The VPSC deals with the ellipsoidal domain since the stress and strain rate are uniform within the inhomogeneous domain of ellipsoidal shape. In the model, the stress applied to the outer boundary of the HEM induces
local deviations of strain rates in its vicinity. This problem is solved analytically by using the Eshelby inclusion formalism [75] which enables the calculation of the state of the considered grain without solving the local field outside the inclusion. The deviation of the strain rate in the grain with respect to the macroscopic average one is characterized by means of the interaction parameter neff in the constitutive low. Assumption of neff =0 accounts for a uniform strain-rate state in a polycrystalline aggregate that is known as Taylor or upper-bound approximation.
Obviously, the secant formulation with neff = 1 is fairly stiff and resembles many features of the full constraints model. By way of contrast, the tangent approximation with neff = 20 leads to a relatively uniform stress state and when neff → ∞ a stress deviation is zero (Sachs model) and therefore a lower-bound approximation is maintained. It is evident that the choice of a linearization scheme will affect the results of texture simulation. In this work, neff is considered to be 10, corresponding to an intermediate interaction between the secant and tangent confinements.
In the cluster V model [11s], the polycrystalline aggregate is subdivided into a number of clusters consisting of 5 grains, whereas each particular grain assembly is exposed to the Taylor type deformation. The grain interaction inside individual clusters is approximated by the VPSC linearization scheme with neff =10.
Fig. 4.2. Schematic representation of CP models.
The above-described models employ the rate-dependent and rigid-plastic Voce-type law for work hardening [84] in which the evolution of the threshold stress a is correlated to the accumulated shear strain :
𝜏𝑎 = 𝜏0+ (𝜏1+ 𝜃1)(1 − exp (− 𝜃0/𝜏1)) (4.1) where τ0, θ0, θ1, and (τ0 + τ1) are: the initial threshold stress, the initial hardening rate, the
It should be underlined here that preceding results of texture simulations [20s] with the mentioned work hardening framework, performed for 6xxx Al alloy, reveal that varying the values of strain hardening parameters has a negligible effect on the quality of texture prediction.
However, it should be noted that this is not a case for polycrystals, which tend to deform by two various modes such as sleep and twinning. In these materials, first, the deformation is governed by one mechanism whereas exceeding a certain straining level induces another mechanism of deformation, and therefore, here the choice of right hardening parameters is of crucial importance. Material’s behavior during deformation could be accurately captured with the strain-gradient formulations [85], multi-scale hierarchical approaches [86] or CP formulations based on fast Fourier transforms [72], however these modeling techniques are computationally intensive and not discussed in the frame of present work.
In the crystal plasticity formulations, the evolution of texture in FCC metals during cold deformation is related to the crystallographic slip on octahedral slip systems {111}<110>, whereas the macroscopic strain mode is approximated by various continuum mechanics-based full-field approaches.
4.1.2 Modeling the material’s flow by continuum mechanics-based approaches Geometrical Approaches
This section provides a summary of approaches described in [2s-4s, 12s]. The flow behavior of a material subjected to rolling can be described by various approaches with a diverse degree of accuracy. In many instances, rolling is considered as the plane strain compression (PSC) deformation, since this abstraction enables fast estimation of strain. PSC is the simplest geometrical approach, which is often used in approximating the rolling process. This analysis enables revealing the effect of an important technological parameter such as a normal strain on the change of material’s shape. PSC is justified to a large extent due to the fact that the ratio between the compressive component of the strain velocity gradient tensor (L) and shear components Lij (ij) is large. In the case of PSC, the L tensor gains the following form:
𝐿 = [
𝐿11 0 0
0 0 0
0 0 𝐿33] (4.2)
In this two-dimensional analysis, where L12=L21=L23=L32=L13=L31=L22=0 (direction 1 is || to rolling direction, direction 2 is || to TD and direction 3 is || to ND), the L11 component might be approximated by the following formula:
𝐿11 = 𝜀̇11≈𝛥𝑡1 𝑙𝑛 (ℎℎ𝑖
𝑓) (4.3)
here hi and hf are the initial and final sheet thickness, whereas t is the time increment. This simple geometric approach accounts for a constant strain rate, which affects the results of simulations if the CP model is rate-dependent. In PSC the resulting strain rates are: 𝜀̇11
11
=- 𝜀̇33=L11=-L33.
It should be underlined that equation 4.2 excludes the effect of (i) roll gap geometry (L31), (ii) friction-induced shear component L13, and (iii) strain heterogeneities, evolved across the thickness of a rolled sheet, whereas, the balance between the factors (i) and (ii) determines the evolution of the aspect (iii).
As rolling is not possible without friction, analyzing the effect of shear is of crucial importance.
It was shown that the shear component, evolving due to the roll gap geometry, can be approximated by [88]:
𝛾̇ =𝛥𝑡(𝑅𝛥ℎ−(0.5𝛥ℎ)𝛥ℎ 2)0.5 (4.4) where R is a roll radius and h = (hi - hf).
Both experimental and computational evidences [12s, 77, 88] claim that the L13 shear component is of positive sense at the entry of the rolling mill and becomes negative at the exit of the mill, while the roll gap geometry induced component L31 reveals an opposite tendency.
As it was pointed out by Engler et al. [77], it is reasonable to adopt that both L13 and L31 follow an idealized sine-shaped profile. In the current geometric approach, it is assumed that L13 and L31 counterparts likewise follow a sine-shaped profile, while the compressive component (L33=- L11) evolves according to the half of the sine-profile during the rolling. In this case, the strain velocity gradient tensor gains the following form [3s, 4s]:
𝐿 = [
0.5𝜋𝜀̇11𝑠𝑖𝑛( 𝜋𝜏) 0 𝑚−1𝜋𝛾̇ 𝑠𝑖𝑛( 2𝜋𝜏)
0 0 0
−𝑚𝜋𝛾̇ 𝑠𝑖𝑛( 2𝜋𝜏) 0 −0.5𝜋𝜀̇11𝑠𝑖𝑛( 𝜋𝜏)] (4.5)
Similarly to Eq. 4.3, the time increment is not explicit in this approximation and therefore the strain-rate dependent CP models will be sensitive to the choice of . In its simplest form, can be defined as a ratio of the instantaneous normal strain to its maximum value. The value of is ranging between 0 and 1, whereas m>0.
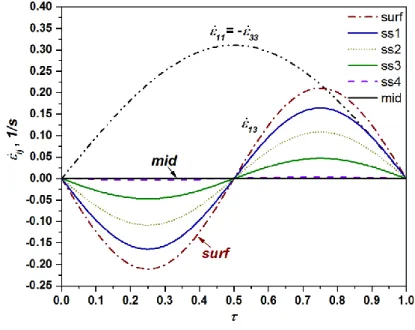
The m coefficient introduced in equation 4.5 ensures the balance between the friction-driven and geometry-induced shear components. The resulting shear 𝜀̇13, which is the symmetric part of the strain velocity gradient tensor and calculated with the following expression 𝜀̇13=𝜀̇31=0.5(L13+L31), depends on the value of m. As soon as m is larger than 1, the resulting shear 𝜀̇13 becomes tilted toward the geometrical shear component L31 (see Fig. 4.3), which corresponds to rolling with (i) low friction coefficient (well-lubricated surfaces of both sheet and rolls), (ii) small thickness reduction and (iii) rolls of relatively small diameter. By way of contrast, rolling with large rolls under dry conditions ( is relatively large) diminishes the effect of roll gap geometry and consequently the L13 component dominates over the L31, which can be accounted for by setting m<1. It is apparent from equation 4.5 that as soon as m=1, the resulting shear 𝜀̇13 is 0 since L13 and L31 cancel each other. By comparing strain rates of Fig. 4.3, computed for inversely proportional m values (m=0.25 and m=4), it appears that 𝜀̇13 profile calculated with m=4 tends to mirror the counterpart calculated for m=0.25. The same stands for L13 and L31 profiles, which mirror each other at inversely proportional values of m.
Independently of the choice of m, the integrated values of L13, L31 and 𝜀̇13 are equal to 0 because of the symmetry of sine-profiles, however, the instantaneous strain path strongly deviates from the plane strain compression.
A growing body of evidence claims that deformation across the thickness is inhomogeneous due to the unequal distribution of shear [12s, 77, 88-91]. Taking into consideration that shear strain is concentrated mainly within a thin sub-surface layer, it is reasonable to adopt an exponential character of shear distribution across the thickness:
𝛾̇𝑝 = 𝛾̇ 𝑒𝑥𝑝 (𝑠−1𝑠 ) (4.6)
here, the superscript p indicates the position of a given layer with respect to the surface of a rolled sheet. In the equation, s varies between 0 and 1: s=1 for the surface, whereas if s→0, the friction-induced component becomes negligibly small, which is characteristic for the mid- thickness plane.
Fig. 4.3. Change of both friction (L13) and roll gap geometry (L31) induced shear components with model parameter m, employed in the geometric approach of Eq.4.5. The resulting shear 𝜀̇13 and compressive 𝜀̇33 strain rate components are calculated for 18% thickness reduction of 1.125 mm initially thick sheet, by employing rolls with a diameter of 129 mm [4s].
Combining equations 4.3-4.6 enables calculation of strain velocity gradient tensor L for various thickness layers (simple geometric model, SGM) [4s]:
𝐿𝑝 = [ 0.5𝜋𝜀̇11𝑠𝑖𝑛( 𝜋𝜏) 0 𝑚−1𝜋𝛾̇𝑝𝑠𝑖𝑛( 2𝜋𝜏)
0 0 0
−𝑚𝜋𝛾̇𝑝𝑠𝑖𝑛( 2𝜋𝜏) 0 −0.5𝜋𝜀̇11𝑠𝑖𝑛( 𝜋𝜏)
] (4.7)
Inasmuch as laboratory rolling trials usually carried out with the small rolls under well- lubricated condition, it is rational to assume that m>1. Fig. 4.4 presents the evolution of stain rates for various through-thickness layers, calculated by equation 4.7 with m=5. Since in cold rolling the 𝜀̇11 component is dominating over the 𝜀̇13, the choice of m=5 is justified. As Fig. 4.4 reveals, the mid-thickness plane (s=0) experiences zero shear, while the amount of 𝜀̇13 tends to increase in the sub-surface layers when s→ 1.
Fig. 4.4 Evolution of strain rates across the thickness of a rolled sheet, calculated by geometric approach (equation 4.7) with m=5 for: roll diameter of 129 mm, 18% thickness reduction, and initial sheet thickness of 1.125mm. On the graph, surf corresponds to s=1 (see equation 4.6 for details); ss1: s=0.8; ss2: s=0.6; ss3: s=0.4; ss4: s=0.2; mid: s=0. The 𝜀̇33 is identical for all trough-thickness layers [4s].
Flow-line modeling approach
Numerous analytical approaches have been developed for accurate description of material’s behavior in deformation and the main advantage of these models [12s, 78-80, 92-94] over other numerical approaches, such as finite element model [69], is their efficiency and accuracy. Flow- line models [12s, 78-80, 92-94] are analytical approaches, which are capable of describing the deformation stream under given boundary conditions for a particular process. These formulations were intensively employed for rolling force and torque calculations, design of asymmetric and vertical rolling processes [78-80, 92-94]. In the FLM employed (Fig. 4.5), the detailed mathematical description of which is described elsewhere [12s], a kinematically admissible displacement velocity field fulfills the following boundary conditions: (a) the entrance and the exit velocities of a rolled sheet are even across the thickness, (b) the incompressibility condition is fulfilled at all points, (c) material’s flow occurs along the prescribed streamlines, (d) at the surface, the velocity field is conditioned by means of the model parameter , which guarantees a difference between velocities of surface and mid-thickness layers, (e) the variation of the velocity across the thickness is conditioned by the second model parameter n, f) the approximation does not allow any displacement in transverse direction.
Fig. 4.5. Schematic illustration of a sheet geometry in the roll gap with the parameters of the flow-line model employed [3s].
In the FLM employed [12s], the material’s flow occurs along the prescribed streamlines, determined by means of equation 4.8:
1 2.1
1
1 1 1
( , ) ( )
1 1
d
d d
s
d
s s L x
z x L
e e e L
z x z z x
z s x L
e e
−
−
+ + − −
= = =
+
(4.8)
with the projected contact length Ld:
Ld =Rsin() (4.9)
and
= cos-1([R+s-e]/R) (4.10)
where is a bite angle and R is a roll radius, e is the half-thickness of the sheet prior to rolling, s is the half-thickness of the sheet after rolling (see Fig. 4.5 for details), zs corresponds to the position of the flow-line ( 0zs1, zs=0 for the mid-thickness and zs=1 for the surface layer).
In this analytical approach, the value of was set to 100 with the aim to ensure a continuous first and second derivate of (x) function in equation 4.8 at x=0. In the model developed by Decroos et al. the exponent of 2.1 (see equation 4.8) guarantees: (i) the quasi-parabolic shape of (x) in the deformation zone and (ii) continuous first and second derivative of this function when x =Ld. Both and the exponent of 2.1 ensures various profiles for the streamlines zs, depending on the roll gap geometry. If zs=0, the deformation flow occurs along the straight streamline, while for zs=1 the flow is conditioned by the roll radius.
Both the entry and the exit velocities of a rolled sheet are even across the thickness, however, the shape of the output profile (see Fig. 4.5) is controlled by two model parameters ( and n), which supposed to be positive float numbers. Within a deformation zone, the model parameter
guarantees a difference between the x-component velocity vx of surface and mid-thickness layers. The variation of velocity across the thickness (z-component) is conditioned by the second model parameter n. As Fig. 4.6 reveals, for a given value of n, the vx is identical for all layers with various zs if =0, while the difference between the velocities along the flow-lines tends to rise when follows upwards trend. Increasing the value of n in the FLM model, while
remains constant, tends to significantly enhance the velocity vx of the sub-surface layers with respect to the mid-thickness planes. In the case when >0, the vx of all through-thickness layers
tends to converge to a single point at x corresponding to a neutral point N. From this point onward, the flow of the mid-layer is faster as compared to the top one. The position of the neutral point n in rolling can be computed by the following equations [70]:
tan 2
f f n
n
h h H
R R
= (4.11)
0
0.5 1ln i
n
f
H H h
h
= − (4.12)
1
0 2 tan i f
f f
h h H R
h h
− −
= (4.13)
LdN = Ld -Rn, (4.14)
where is a friction coefficient and LdN is the x component of a neutral point.
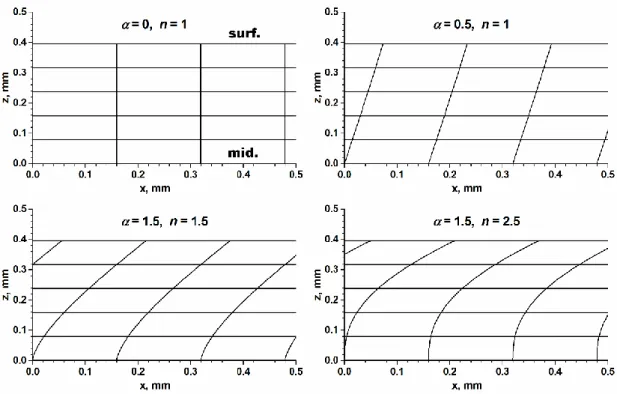
Although vx is identical for all zs when =0, the z-component of velocity (vz) reveals significant deviations, implying that surface layers experience higher straining levels compared to the mid- thickness plane (zs=0). It should be noted that even if =0, the strain path of a rolled sheet is different from the plane strain compression due to displacement heterogeneities caused by various vz across the thickness. For a given value of , the effect of n on vz seems to be negligibly small, however, the same cannot be said about the deformation patterns revealed in Fig. 4.7 (see cases for =1.5, n=1.5 and =1.5, n=2.5). It can be concluded from Figs. 4.6 and 4.7 that employing diverse and n parameters allows reproducing a wide spectrum of deformation patterns, obtained under different thermomechanical processing conditions.
This computationally efficient model enables fast calculation of deformation velocity gradients, evolved across the thickness of a rolled sheet. If the correlation between the technological parameters (such as degree of reduction, roll diameter, material’s initial thickness, and friction coefficient) and the model parameters will be determined, this two-dimensional FLM approach can enable efficient calculation of velocity gradient history, evolved across the thickness of a rolled sheet, which is needed for successful prediction of texture evolution performed by crystal plasticity models.
Fig. 4.6. Velocity components (vx and vz) calculated by the FLM employed for various model parameters along six flow-lines. The sheet of 1.125mm initial thickness was subjected to 29.6%
reduction with a roll of R=64.5mm. The sequence of streamlines: zs=1 (surface), zs =0.8 (sub- surface 1), zs =0.6 (sub-surface 2), zs =0.4 (sub-surface 3), zs =0.2 (sub-surface 4), zs =0 (mid- plane) [3s].
Fig. 4.7. Deformation patterns of the initially rectangular grid (half-thickness), emerged after 29.6% reduction (initial thickness = 1.125mm, R=64.5mm) as predicted by FLM for various model parameters. The sequence of streamlines: zs=1 (surface), zs =0.8 (sub-surface 1), zs =0.6 (sub-surface 2), zs =0.4 (sub-surface 3), zs =0.2 (sub-surface 4), zs =0 (mid-plane). In the FLM calculation, the position of a neutral point was identical for all cases, LdN=2.5mm [3s].
In order to define a link between the FLM fitting parameters ( and n) and processing quantitative indicators, a series of finite element simulations were performed. Since the FLM approach does not account for anisotropy of properties, the behavior of an isotropic material was studied by FEM. In the first instance, the effect of friction on the deformation flow across the thickness of a rolled Al sheet was studied. The minimum value of friction coefficient necessary for rolling (min) was approximated based on the roll gap geometry, as rolling of a material is not possible without an appropriate friction condition [95]:
min
1
ln 1 1 4
2 tan 1
i f
i f f
i f
h h
h
h R
h
R h
h
−
−
+
=
−
(4.15)
In the FEM, the rolling trials were simulated with a constant Coulomb friction coefficient , which exceeds the value of min in order to avoid both convergence problems and remeshing
![Fig. 3.4. Main orientations and fibres which tend to appear in materials with FCC crystal structure [2s, 13s, 18s]](https://thumb-eu.123doks.com/thumbv2/9dokorg/1241812.96195/16.892.156.777.200.917/fig-main-orientations-fibres-appear-materials-crystal-structure.webp)
![Fig. 3.5. Main fibres observed in rolled fcc materials [13s]. The points indicate maxima of orientations observed along the -fibre in different materials: ( ) 70:30 brass after 75%](https://thumb-eu.123doks.com/thumbv2/9dokorg/1241812.96195/18.892.206.707.476.747/fibres-observed-materials-indicate-orientations-observed-different-materials.webp)
![Fig. 4.1. Variety of length scales involved in modeling the microstructure-properties relationship [3s]](https://thumb-eu.123doks.com/thumbv2/9dokorg/1241812.96195/20.892.129.768.145.313/variety-length-scales-involved-modeling-microstructure-properties-relationship.webp)
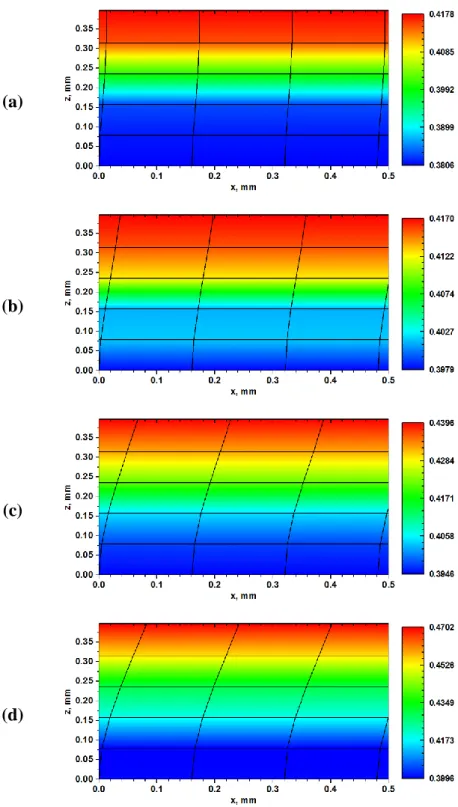
![Fig. 4.9. Deformation patterns and von Mises strain distribution across the thickness of a rolled Al sheet, subjected to 29.6% thickness reduction (initial thickness = 1.125mm, R=64.5mm), as predicted by flow-line model employed [12s]](https://thumb-eu.123doks.com/thumbv2/9dokorg/1241812.96195/37.892.211.676.133.945/deformation-distribution-thickness-subjected-thickness-reduction-thickness-predicted.webp)
![Fig. 4.10. Grid distortions predicted for various roll gap geometries [3s] by the FLM](https://thumb-eu.123doks.com/thumbv2/9dokorg/1241812.96195/40.892.167.727.109.1056/fig-grid-distortions-predicted-various-roll-geometries-flm.webp)
![Fig. 4.11. Deformation patterns predicted for identical rolling reductions and various initial thicknesses by the FLM [12s]: a) initial thickness =1.125 mm; b) initial thickness =4.0 mm [3s]](https://thumb-eu.123doks.com/thumbv2/9dokorg/1241812.96195/41.892.119.779.136.436/deformation-patterns-predicted-identical-reductions-thicknesses-thickness-thickness.webp)
