Article
Triterpenes and Phenolic Compounds from the Fungus
Fuscoporia torulosa: Isolation, Structure Determination and Biological Activity
Zoltán Béni1, Miklós Dékány1, András Sárközy2, Annamária Kincses3 , Gabriella Spengler3 , Viktor Papp4, Judit Hohmann2,5,* and Attila Ványolós2,6,*
Citation: Béni, Z.; Dékány, M.;
Sárközy, A.; Kincses, A.; Spengler, G.;
Papp, V.; Hohmann, J.; Ványolós, A.
Triterpenes and Phenolic Compounds from the FungusFuscoporia torulosa:
Isolation, Structure Determination and Biological Activity.Molecules 2021,26, 1657. https://doi.org/
10.3390/molecules26061657
Academic Editor: Owen M. McDougal
Received: 5 February 2021 Accepted: 15 March 2021 Published: 16 March 2021
Publisher’s Note:MDPI stays neutral with regard to jurisdictional claims in published maps and institutional affil- iations.
Copyright: © 2021 by the authors.
Licensee MDPI, Basel, Switzerland.
This article is an open access article distributed under the terms and conditions of the Creative Commons Attribution (CC BY) license (https://
creativecommons.org/licenses/by/
4.0/).
1 Spectroscopic Research, Gedeon Richter Plc., Gyömr˝oiút 19-21, H-1103 Budapest, Hungary;
z.beni@richter.hu (Z.B.); M.Dekany@richter.hu (M.D.)
2 Department of Pharmacognosy, University of Szeged, Eötvös u. 6, H-6720 Szeged, Hungary;
sarkozy@pharmacognosy.hu
3 Department of Medical Microbiology and Immunobiology, University of Szeged, Dóm Square 10, H-6720 Szeged, Hungary; kincses.annamaria@med.u-szeged.hu (A.K.);
spengler.gabriella@med.u-szeged.hu (G.S.)
4 Department of Botany, Hungarian University of Agriculture and Life Sciences, Villányiút 29-43, H-1118 Budapest, Hungary; papp.viktor@uni-mate.hu
5 Interdisciplinary Centre for Natural Products, University of Szeged, Eötvös u. 6, H-6720 Szeged, Hungary
6 Department of Pharmacognosy, Semmelweis University, Üll˝oi u. 26, H-1085 Budapest, Hungary
* Correspondence: hohmann.judit@szte.hu (J.H.); vanyolosa@pharmacognosy.hu (A.V.);
Tel.: +36-62-545 558 (J.H.)
Abstract:Investigation of the methanol extract of the poroid fungusFuscoporia torulosaresulted in the isolation of a novel triterpene, fuscoporic acid (1), together with inoscavin A and its previously undescribedZisomer (2and3), 3,4-dihydroxy-benzaldehide (4), osmundacetone (5), senexdiolic acid (6), natalic acid (7), and ergosta-7,22-diene-3-one (8). The structures of fungal compounds were deter- mined on the basis of NMR and MS spectroscopic analyses, as well as molecular modeling studies.
Compounds1,6–8were examined for their antibacterial properties on resistant clinical isolates, and cytotoxic activity on human colon adenocarcinoma cell lines. Compound8was effective against Colo 205 (IC5011.65±1.67µM), Colo 320 (IC508.43±1.1µM) and MRC-5 (IC507.92±1.42µM) cell lines.
Potentially synergistic relationship was investigated between8and doxorubicin, which revealed a synergism between the examined compounds with a combination index (CI) at the 50% growth inhibition dose (ED50) of 0.521±0.15. Several compounds (1and6–8) were tested for P-glycoprotein modulatory effect in Colo 320 resistant cancer cells, but none of the compounds proved to be effective in this assay. Fungal metabolites2–5were evaluated for their antioxidant activity using the oxygen radical absorbance capacity (ORAC) and DPPH assays. Compounds4and5were found to have a considerable antioxidant effect with EC500.25±0.01 (DPPH) and 12.20±0.92 mmol TE/g (ORAC).
The current article provides valuable information on both the chemical and pharmacological profiles ofFuscoporia torulosa, paving the way for future studies with this species.
Keywords: Fuscoporia torulosa; triterpenes; cytotoxic; antioxidant; synergism; antibacterial;
ORAC; DPPH
1. Introduction
The members of Hymenochaetaceae family (Phellinuss. lato) are considered to be an abundant source of diverse bioactive metabolites, and the pharmacological potential of wild species is intensely studied around the world [1–4]. The morphologically circumscribed Phellinuss. lato represents a phylogenetically polyphyletic assemblage that includes smaller and more natural genera [5]. Among these,FuscoporiaMurrill is one of the largest genera, distributed on all forested continents [6]. On the basis of recent taxonomic studies, the
Molecules2021,26, 1657. https://doi.org/10.3390/molecules26061657 https://www.mdpi.com/journal/molecules
genus is made up of 50 species, which are divided into six phylogenetic lineages [7,8]. The so-called “Fuscoporia torulosagroup” comprises 10 species, of which only two have been reported in Europe:Fuscoporia wahlbergii(Fr.) T. Wagner & M. Fisch. andF. torulosa(Pers.) T. Wagner & M. Fisch. [7]. The more commonF. torulosais widespread in Europe with a preference for southern areas, growing on various broad-leaved trees and occasionally on conifers [9]. The perennial woody basidiocarps ofF. torulosamainly develop on the base of living trees and are easily distinguished by their rusty-brown color with greenish sterile surfaces due to the presence of mosses and algae [10].
The first study to explore the chemistry ofF. torulosaappeared in the mid 1990s, which reported the isolation of nine compounds, among which were three novel lanosteroids, namely, albertic, natalic, and torulosic acids [11]. One and a half decades after the first study, Deveci et al. presented the results of an investigation onF. torulosasamples of Turkish origin: one new and nine known compounds were isolated. The fungal metabolites were examined for their potential cytotoxic, antioxidant, cholinesterase, and tyrosinase inhibitory activities [12]. Besides these mycochemical studies, several articles reported the antimicrobial, antioxidant, cytotoxic, and xanthine oxidase inhibitory capacities, and the antiacne activities and the phenolic profile ofF. torulosasamples prepared with solvents of different polarities [2,13–15].
The present study was performed with the aim of mapping the chemical profile and pharmacological potential ofF. torulosa,thus providing more information about the fungal metabolites responsible for these biological activities.
2. Results and Discussion
An in-depth chemical examination of the methanol extract obtained from fruiting bodies ofF. torulosaled to the identification of eight compounds (1–8) (Figure1). The concentrated methanol extract ofF. torulosawas subjected to solvent–solvent partition between aqueous MeOH andn-hexane, followed by extraction with chloroform and ethyl acetate. The obtained organic solvent extracts were separated using a combination of flash column chromatography and reversed-phase HPLC, to give compounds1–8.
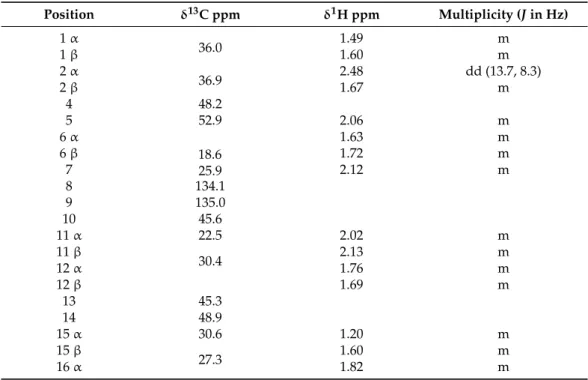
The1H- and13C-NMR spectra of compound1presented similar spectral features to those reported for gilvsin D [16] and obtained for natalic acid (7) [11]. Consecutive analysis of the COSY, HSQC, and HMBC spectra of1showed that it is a structural analogue of gilvsin D and natalic acid (7) and enabled the complete1H- and13C-NMR assignments listed in Table1. On the basis of the spectral data similarities, all three compounds share the same degraded lanosterol skeleton. Structural differences were found in the side chains attached to C-17. HSQC and HMBC data suggested that in the case of compound1,a 22-hydroxy-24-en side chain was present. 1D and 2D ROESY data were in accordance with the suggested structure and proved that the relative configurations of C-4, C-5, C-10, C-13, C-14, C-17, and C-20 were identical in compound1and gilvsin D as well as in natalic acid (7). In addition to this, on the basis of the findings of González and coworkers [17] the ca.
3.6 Hz coupling constant observed between H-21 and H-22 suggested anSconfiguration of the C-22 chirality center. Putting these pieces of information together, compound1was characterized as 22S-hydroxy-8,24-dien-3-norlanosta-28-oic acid, known as fuscoporic acid (Figure1).
Compounds2and3represent a mixture of inoscavin A and itsZisomer in a ca. 5 to 3 molar ratio. To the best of our knowledge thecisisomer (3) has not yet been reported in the literature. On the basis of the agreement of the obtained and published [18] NMR and HRMS data, the major component could be unambiguously assigned as inoscavin A. In accordance with the proposed structure, the minor component presented highly similar
1H and13C-NMR features, excepting those belonging to the hispidine moiety of inoscavin A. Thus, in the1H-NMR spectrum, instead of the two doublet resonances (δH 7.47 and 6.75 ppm) with 15.7 Hz coupling, two doublets atδH 6.87 and 6.11 ppm with a 12.7 Hz coupling constant were obtained for H-7 and H-6, respectively. This was in accordance with a C-6/C-7 double bond incisconfiguration in the minor component.13C-NMR, COSY,
HSQC, and HMBC data confirmed the proposed structures and enabled the complete1H and13C-NMR assignments of both components (Figures S7–S10). Homonuclear ROESY data were also in accordance with these structural conclusions (Figure S11).
Figure 1.Compounds isolated fromFuscoporia torulosa(2and3E-Zisomers).
Table 1.1H- and13C-NMR assignments of1.
Position δ13C ppm δ1H ppm Multiplicity (Jin Hz) 1α
36.0 1.49 m
1β 1.60 m
2α
36.9 2.48 dd (13.7, 8.3)
2β 1.67 m
4 48.2
5 52.9 2.06 m
6α 1.63 m
6β 18.6
25.9
1.72 m
7 2.12 m
8 134.1
9 135.0
10 45.6
11α 22.5 2.02 m
11β
30.4 2.13 m
12α 1.76 m
12β 1.69 m
13 45.3
14 48.9
15α 30.6 1.20 m
15β
27.3 1.60 m
16α 1.82 m
Table 1.Cont.
Position δ13C ppm δ1H ppm Multiplicity (Jin Hz) 16β
47.1 1.44 m
17 1.57 m
18 15.5 0.76 s
19 19.3 0.98 s
20 41.6 1.80 m
21 12.7 0.96 d (6.6)
22 73.4 3.68 m
23 29.1 2.05 m
24 121.3 5.19 m
25 135.2
26 26.0 1.75 s
27 18.0 1.66 s
28 185.3
29 21.3 1.24 s
30 24.4 0.89 s
The relative stereochemistry of the C-40 and C-50 stereogenic centers could not be determined on this basis. Although inoscavin A has been known for quite some time, no literature data were found that could allow the stereochemical assignment of these centers on a comparative basis. Unfortunately, the amount of sample did not enable us to collect the specific experimental data (e.g., heteronuclear NOE) that might have allowed us to distinguish between the possible diastereoisomers. In the absence of adequate experimental data, a molecular modeling study was undertaken to determine the relative stereochemistry.
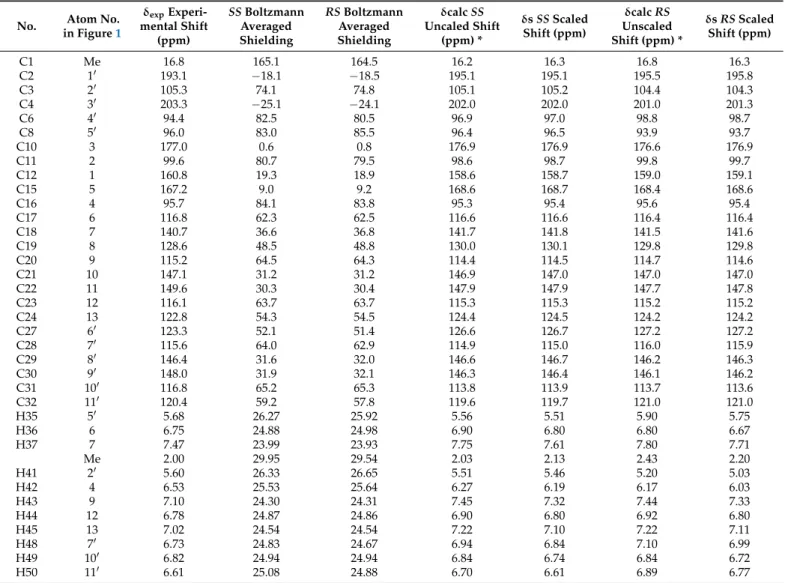
Following the method described in the Experimental Section, NMR shielding constants and chemical shift values were calculated for the (arbitrary chosen) 40R,50Sand 40S,50S epimers (Figure2) by averaging the appropriate values obtained for four representative conformers using the Boltzmann populations derived from the solution phase energies (SI). As is shown in Table2, the resulting unscaled chemical shifts (relative to TMS, using the default Jaguar procedure) are in very good agreement with the experimental data in both cases.
Figure 2.SS(top) andRS(bottom) epimers of inoscavin A (color scheme: grey: carbons, white: hydrogens, red: oxygens).
Table 2.Experimental and calculated chemical shifts and isotropic shielding values ofS,SandR,Sisomers.
No. Atom No.
in Figure1
δexpExperi- mental Shift
(ppm)
SSBoltzmann Averaged Shielding
RSBoltzmann Averaged Shielding
δcalcSS Uncaled Shift
(ppm) *
δsSSScaled Shift (ppm)
δcalcRS Unscaled Shift (ppm) *
δsRSScaled Shift (ppm)
C1 Me 16.8 165.1 164.5 16.2 16.3 16.8 16.3
C2 10 193.1 −18.1 −18.5 195.1 195.1 195.5 195.8
C3 20 105.3 74.1 74.8 105.1 105.2 104.4 104.3
C4 30 203.3 −25.1 −24.1 202.0 202.0 201.0 201.3
C6 40 94.4 82.5 80.5 96.9 97.0 98.8 98.7
C8 50 96.0 83.0 85.5 96.4 96.5 93.9 93.7
C10 3 177.0 0.6 0.8 176.9 176.9 176.6 176.9
C11 2 99.6 80.7 79.5 98.6 98.7 99.8 99.7
C12 1 160.8 19.3 18.9 158.6 158.7 159.0 159.1
C15 5 167.2 9.0 9.2 168.6 168.7 168.4 168.6
C16 4 95.7 84.1 83.8 95.3 95.4 95.6 95.4
C17 6 116.8 62.3 62.5 116.6 116.6 116.4 116.4
C18 7 140.7 36.6 36.8 141.7 141.8 141.5 141.6
C19 8 128.6 48.5 48.8 130.0 130.1 129.8 129.8
C20 9 115.2 64.5 64.3 114.4 114.5 114.7 114.6
C21 10 147.1 31.2 31.2 146.9 147.0 147.0 147.0
C22 11 149.6 30.3 30.4 147.9 147.9 147.7 147.8
C23 12 116.1 63.7 63.7 115.3 115.3 115.2 115.2
C24 13 122.8 54.3 54.5 124.4 124.5 124.2 124.2
C27 60 123.3 52.1 51.4 126.6 126.7 127.2 127.2
C28 70 115.6 64.0 62.9 114.9 115.0 116.0 115.9
C29 80 146.4 31.6 32.0 146.6 146.7 146.2 146.3
C30 90 148.0 31.9 32.1 146.3 146.4 146.1 146.2
C31 100 116.8 65.2 65.3 113.8 113.9 113.7 113.6
C32 110 120.4 59.2 57.8 119.6 119.7 121.0 121.0
H35 50 5.68 26.27 25.92 5.56 5.51 5.90 5.75
H36 6 6.75 24.88 24.98 6.90 6.80 6.80 6.67
H37 7 7.47 23.99 23.93 7.75 7.61 7.80 7.71
Me 2.00 29.95 29.54 2.03 2.13 2.43 2.20
H41 20 5.60 26.33 26.65 5.51 5.46 5.20 5.03
H42 4 6.53 25.53 25.64 6.27 6.19 6.17 6.03
H43 9 7.10 24.30 24.31 7.45 7.32 7.44 7.33
H44 12 6.78 24.87 24.86 6.90 6.80 6.92 6.80
H45 13 7.02 24.54 24.54 7.22 7.10 7.22 7.11
H48 70 6.73 24.83 24.67 6.94 6.84 7.10 6.99
H49 100 6.82 24.94 24.94 6.84 6.74 6.84 6.72
H50 110 6.61 25.08 24.88 6.70 6.61 6.89 6.77
*δcalcunscaled shift are calculated by Jaguar relative to TMS (based on a semiempirical linear regression against experimental data);
δsscaled shifts are calculated according toδs= (δcalc−b)/m, where b and m are the intercept and slope of a plot ofδcalcagainstδexp.
The mean absolute errors (MAE) calculated for13C/1H chemical shifts were 1.2/0.17 and 1.3/0.26 ppm for theSSandRSepimers, respectively. The scaled shifts [19,20] were in even better agreement with the experimental values with (corrected) MAE values of
13C/1H 1.2/0.12 and 1.3/0.21 ppm for theSS*andRS*isomers, respectively. Although only small differences were obtained, these consistently pointed towards the presence of theSS*isomer. Recently Grimblat et al. [21] showed that the extended and combined use of the DP4 probability function introduced by Smith et al. [22] could successfully help to solve structural questions where other methods failed. Applying their DP4+
methodology [21] on the calculated isotropic shielding values (shieldings are listed in Table2; DP4+ probabilities calculated by the template provided by the authors [21] are shown in Table3), in our case, theSSisomer was predicted as the most probable (with a 100% overall possibility) structural candidate. On the basis of these results, compound 2and3are described as the C-40S*, C-50S* isomers of inoscavin A and itscisanalogue, respectively. Considering the obtained optical rotation value of [α]25D = 0 (c, 0.05, MeOH), the sample is a racemate. The isolation of2and3as a racemic mixture is in accordance with the finding of Kim et al. [18] who isolated inoscavin A for the first time, as well as with the nonstereoselective biogenetic pathway proposed for insocavin A by Mo et. al. [23]. It should be noted, however, that the small negative optical rotation value reported (without
any discussion on the stereochemistry) for the close structural relative methylinoscavin A [24] “brings” some ambiguity to this question.
Table 3.DP4+ probabilities obtained forSSandRSisomers of2using the template from [21]; s and u refer to scaled and unscaled shifts.
SS RS
sDP4+ (H data) 99.87% 0.13%
sDP4+ (C data) 96.73% 4.27%
sDP4+ (all data) 100% 0%
uDP4+ (H data) 100% 0%
uDP4+ (C data) 79.89% 20.11%
uDP4+ (all data) 100% 0%
DP4+ (H data) 100% 0%
DP4+ (C data) 99.16% 0.84%
DP4+ (all data) 100% 0%
Compounds4–8reported here were structurally characterized on the basis of HRMS, and standard one- and two-dimensional NMR data in comparison to those reported in the literature. According to spectroscopical analysis, 4 and5 represent an equimolar mixture of 3,4-dihydroxy-benzaldehide and osmundacetone. The remaining constituents are triterpenes, namely, senexdiolic acid (6) [17,25], natalic acid (7), and ergosta-7,22-diene- 3-one (8) [26].
The identified fungal constituents were subjected to different pharmacological assays to determine their characteristic biological activities. In this way, the cytotoxic effect of1, 6–8was tested on sensitive and resistant Colo 205 and Colo 320 colon adenocarcinoma cell lines, respectively, and on the normal MRC-5 embryonal fibroblast cell line with doxorubicin as a standard. While compounds1,6,and7did not show any significant effect in the applied concentration, compound8was effective against both Colo 205 (IC50 11.65±1.67µM), Colo 320 (IC50 8.43±1.1µM), and MRC-5 (IC50 7.92±1.42µM) cell lines (Table4). These results are comparable to those of doxorubicin (IC502.46±0.26µM, 7.44±0.2µM and > 20µM, respectively).
Table 4.Cytotoxic activity of compounds1,6–8,and doxorubicin on the human colon adenocarci- noma cell lines (sensitive Colo 205 and resistant Colo 320 cells) and on the normal MRC-5 embryonal fibroblast cell line.
Samples IC50(µM)
Colo 205 Colo 320 MRC-5
1 >100 >100 >100
6 >100 >100 >100
7 >100 >100 >100
8 11.65±1.67 *** 8.43±1.1 7.92±1.42 **
Doxorubicin 2.46±0.26 7.44±0.2 > 20
**p< 0.01, ***p< 0.001.
After the promising results, a potentially synergistic relationship was investigated between8and doxorubicin (Figure S20). To this end, a checkerboard combination assay was utilized using the resistant Colo 320 cell line as a test subject. The results indicated that a 11.2:1 compound8: doxorubicin ratio was ideal for synergistic activity. At this rate, the combination index (CI) at the 50% growth inhibition dose (ED50) was 0.521±0.15, indicating a synergism between the examined compounds.
The effect of compounds1, and6–8on the modulation of P-glycoprotein (P-gp) efflux was evaluated by flow cytometry, measuring the rhodamine-123 accumulation in MDR Colo 320 human colon adenocarcinoma cells (Figure S21). Tariquidar (0.2µM), a well- known P-gp inhibitor, was used as positive control. The compounds were tested at 2
and 20µM, and a P-gp modulating effect was obtained at a concentration of 2µM with compound8, and at 20µM in the case of compounds1,6, and7. The fluorescence activity ratio (FAR) values were used to assess the P-gp modulating potential. Usually, compounds can be considered to be active when presenting FAR values higher than 2. The results presented in Table5show that FAR values are in the range of 0.828–1.139; therefore, the tested compounds are not effective P-gp modulators on the drug-resistant strain Colo 320.
Table 5.Effect of compounds1,6–8on the P-glycoprotein (P-gp)-mediated rhodamine-123 efflux on MDR human colon adenocarcinoma (Colo 320).
Samples conc. (µM) FSC SSC FL-1 FAR
Tariquidar 0.2 1945 837 64.100 5.533
1 20 2005 851 13.200 1.139
6 20 2074 861 11.900 1.027
7 20 2095 891 12.200 1.053
8 2 2099 857 10.100 0.872
DMSO 2.00% 2073 848 9.590 0.828
Colo 320 - 2052 841 8.870 -
Parameters evaluated from flow cytometric experiments were forward scatter count (FSC, provides information about cell size); side scatter count (SSC, proportional to cell granularity or internal complexity); FL-1 (mean fluorescence of the cells), and fluorescence activity ratio (FAR), which was calculated by the equation given in the Section3. The histograms were evaluated regarding the mean fluorescence intensity, the standard deviation of 20,000 individual cells belonging to the total, and the gated populations.
Fungal ergosterol derivatives, including glucosides, hydroxylated compounds, and peroxides, were demonstrated to have cytotoxic activity against human cancer cell lines other than those used in our assay. Furthermore, they exhibited strong inhibitory effects on cell proliferation in vitro, and apoptosis promoting and angiogenesis inhibitory activities in vivo [27–29]. Our results demonstrate for the first time that ergosta-7,22-diene-3-one (8) has potent anticancer activity against colon adenocarcinoma cells, which can be more effective in combination with the standard chemotherapeutic drug doxorubicin.
The antibacterial activity of the compounds was investigated using the broth dilution method. This method can provide precise numerical minimum inhibitory concentrations (MIC) data instead of the estimated antibacterial activity as is the case in the disk dif- fusion method. The antimicrobial effect of compounds1, and6–8were determined on Escherichia coliATCC 25922,Salmonella entericaserovar Typhimurium 14028s,Staphylococ- cus aureusATCC 25,923 andS. aureus27,213 (methicillin and ofloxacin resistant clinical isolate) strains; however, none of the compounds produced a significant antibacterial effect (MIC > 100µM).
The antioxidant capacity of compounds2+3and4+5was determined by DPPH and oxygen radical absorbance capacity (ORAC) assays. While both of the examined samples exhibited antioxidant effects in the two in vitro tests,4+5produced more promising results with 0.25±0.01µg/mL EC50 (DPPH) and 12.20±0.92 mmol TE/g (ORAC), comparable to that of the reference compound, ascorbic acid (Table6).
Table 6.Antioxidant activity of compounds2–5.
Compounds DPPH EC50(µg/mL) ORAC Activity (mmol TE/g)
2+3 0.72±0.05 2.70±0.03
4+5 0.25±0.01 12.20±0.92
Ascorbic acid 0.89±0.02 6.94±0.58
3. Materials and Methods
Optical rotations were measured with a Perkin-Elmer 341 polarimeter (PerkinElmer Life and Analytical Science, Shelton, CT, USA). The chemicals used in the experiments were supplied by Sigma-Aldrich, Hungary, and Molar Chemicals, Hungary. Flash chromatogra- phy was carried out on a CombiFlash®Rf+Lumen instrument with integrated UV, UV-Vis,
and ELS detection using RediSep Rf Gold Normal Phase Silica Flash columns (4, 12 and 60 g) (Teledyne Isco, Lincoln, USA). Reversed-phase HPLC (RP-HPLC) separations were performed on a Wufeng LC-100 Plus HPLC instrument equipped with a UV-Vis detector (Shanghai Wufeng Scientific Instruments Co., Ltd., Shanghai, China) at 254 nm, using a Zorbax ODS column (250×4 mm, 5µm; Agilent Technologies, Santa Clara, CA, USA).
HRMS and MS analyses were performed on a Thermo Velos Pro Orbitrap Elite and Thermo LTQ XL (Thermo Fisher Scientific) system (Bremen, Germany). The ionization method was ESI operated in positive (or negative) ion mode. The (de)protonated molecular ion peaks were fragmented by CID at a normalized collision energy of 35%. For the CID experiment, helium was used as the collision gas. The samples were dissolved in methanol. Data acquisition and analysis were accomplished with Xcalibur software version 4.0 (Thermo Fisher Scientific, Bremen, Germany). NMR data were acquired on a Bruker Avance III HD 800 or 500 MHz NMR spectrometer (Bruker, Rheinstetten, Germany) both equipped with a TCI cold probe. MeOD-d4or CDCl3were used as solvents. Chemical shifts are reported in the delta scale relative to the residual solvent signals (3.31/7.27 and 49.15/77.0 ppm for1H and13C in MeOD/CDCl3, respectively). Standard one- and two- dimensional NMR spectra were recorded in all cases using the pulse sequences available in the TopSpin 3.5 sequence library. Data analysis and interpretation were performed with ACD/Labs 2017.1.3 NMR Workbook Suite.
A molecular modeling study was performed within the Jaguar software package (Jaguar, version 10.4, Schrodinger, Inc., New York, NY, 2019) [30]. Firstly, a conformational search was performed at the molecular mechanics (MM) level using the default settings in MacroModel. After manual inspection of the resulted conformers, four representative con- formers of each diastereomers were chosen for QM level geometry optimization using the Jaguar software package (Jaguar, version 10.4, Schrodinger, Inc., New York, NY, 2019) [30].
The gas phase geometry optimizations were performed at the B3LYP-D3/6-31+G** level while NMR shielding constants were calculated on the resulted geometries using a B3LYP functional and 6-311+G** basis set and PCM solvent model of methanol. The resulted isotropic shielding values of the conformers were Boltzmann averaged based on the calcu- lated solution phase energies. Finally, DP4+ statistical analysis of these shieldings (with respect to the experimental chemical shifts) was carried out following the method and applying the template published by Grimblat, Zanardi, and Sarotti [21].
3.1. Mushroom Material
The mushroom samples were collected in March 2017 from Mt. Gerecse in the Central Transdanubia region, Hungary, and in April 2018 from the Botanical Garden of Buda. The former sample was found on Austrian oak, black locust, and small-leaved linden trees, the latter, however, was harvested from black locust unanimously. The fungal samples were combined for the chemical analysis. A voucher specimen was deposited in the mycological collection of Viktor Papp (PV1172).
3.2. Extraction and Isolation
The air-dried mushroom material (1.4 kg) was ground, then extracted with MeOH (20 L) at room temperature. After concentration, the MeOH extract (44.26 g) was dis- solved in 50% aqueous MeOH and subjected to solvent–solvent partition withn-hexane (5×300 mL), chloroform (6×300 mL), and ethyl acetate (6×300 mL). Then-hexane frac- tion (10.34 g) was subjected to flash chromatography on a silica gel column using a gradient system ofn-hexane and acetone (0%–40%;t= 55 min). Fractions with similar compositions were combined according to TLC monitoring (A1–A10). The combined fractions A2 and A3 (0.80 g) were purified by flash chromatography using a mixture ofn-hexane and acetone (0–25%;t= 50 min), with increasing polarity, to obtain compound7(2.9 mg). Fractions A4 and A5 (4.99 g) were further separated by multiple flash chromatography steps, ap- plyingn-hexane–acetone and H2O-MeOH solvent systems on normal and reversed phase
stationary phases, respectively, then a final purification was performed by RP-HPLC using a H2O-MeOH gradient system to give compounds1(14.4 mg) and6(9.6 mg).
The chloroform soluble phase (13.47 g) was subjected to flash chromatography in multiple steps on silica gel column using gradient system ofn-hexane–acetone. Fractions with similar compositions were combined according to TLC monitoring (B1-B13). Fractions B6-B8 (2.16 g) were further separated by combination of flash chromatography (n-hexane–
acetone 5% to 25%,t= 50 min) to obtain an equimolar mixture of3and4(62.3 mg) and5 (4.7 mg).
Finally, the ethyl acetate phase (10.60 g) was further separated in subsequent flash chromatography steps, then fractions with related compositions were combined according to TLC monitoring (B1-B9). The fractionation of C2-4 (0.62 g) by normal phase flash chromatography using a chloroform–MeOH system (0–40%,t= 50 min) led to the isolation of2(1.4 mg).
Fuscoporic acid (1): a white, amorphous solid; [α]25D + 28 (MeOH,c0.1),1H and13C- NMR data are shown in in Table1; HRMS: [M-H]−441.33698 (δ=−1.0 ppm; C29H45O3).
HR-ESI-MS-MS (CID = 45%; rel. int. %): 411(36); 371(100).
3.3. Cell Culture
The human colon adenocarcinoma cell lines, the Colo 205 (ATCC-CCL-222) doxorubicin- sensitive parent and Colo 320/MDR-LRP (ATCC-CCL-220.1) resistant to anticancer agents expressing ABCB1, were purchased from LGC Promochem (Teddington, UK). The cells were cultured in RPMI-1640 medium supplemented with 10% heat-inactivated fetal bovine serum (FBS), 2 mM L-glutamine, 1 mM Na-pyruvate, 100 mM Hepes, nystatin, and a penicillin–streptomycin mixture in concentrations of 100 U/L and 10 mg/L, respectively.
The MRC-5 (ATCC CCL-171) human embryonic lung fibroblast cell line (LGC Promochem) was cultured in EMEM medium, supplemented with 1% nonessential amino acid (NEAA) mixture, 10% heat-inactivated FBS, 2 mM L-glutamine, 1 mM Na-pyruvate, nystatin, and a penicillin–streptomycin mixture in concentrations of 100 U/L and 10 mg/L, respectively.
The cell lines were incubated in a humidified atmosphere (5% CO2, 95% air) at 37◦C.
3.4. Assay for Cytotoxic Effect
The effects of increasing concentrations of the compounds on cell growth were tested in 96-well flat-bottomed microtiter plates [31]. The two-fold serial dilutions of the tested compounds were made starting with 100µM. Then, 104of human colonic adenocarcinoma cells in 100µL of the medium (RPMI-1640) were added to each well, except for the medium control wells. The adherent human embryonic lung fibroblast cell line (104/well) was seeded in EMEM medium in 96-well flat-bottomed microtiter plates for 4 h before the assay. The serial dilutions of the compounds were made in a separate plate starting with 100µM, and then transferred to the plates containing the adherent corresponding cell line.
Culture plates were incubated at 37◦C for 24 h; at the end of the incubation period, 20µL of MTT (thiazolyl blue tetrazolium bromide) solution (from a 5 mg/mL stock solution) were added to each well. After incubation at 37◦C for 4 h, 100µL of sodium dodecyl sulfate (SDS) solution (10% SDS in 0.01 M HCl) were added to each well and the plates were further incubated at 37◦C overnight. Cell growth was determined by measuring the optical density (OD) at 540 nm (ref. 630 nm) with a Multiscan EX ELISA reader (Thermo Labsystems, Cheshire, WA, USA). Inhibition of cell growth was expressed as IC50values, defined as the inhibitory dose that reduces the growth of the cells exposed to the tested compounds by 50%. IC50values and the SD of triplicate experiments were calculated using GraphPad Prism software version 5.00 for Windows with nonlinear regression curve fit (GraphPad Software, San Diego, CA, USA; www.graphpad.com). The statistical analysis of data was performed using GraphPad Prism software version 5.00, applying the two-tailed t-test.
3.5. Checkerboard Combination Assay
A checkerboard microplate method [32] was applied to study the effect of drug interactions between the compound8and the chemotherapeutic drug doxorubicin. The assay was carried out on Colo 320 colon adenocarcinoma cell line. The final concentration of the compounds and doxorubicin used in the combination experiment was chosen in accordance with their cytotoxicity towards this cell line. The dilutions of doxorubicin were made in a horizontal direction for the 100µL volume, and the dilutions of the compounds were made vertically in the microtiter plate for the 50µL volume. Then, 6×10³of Colo 320 cells in 50µL of the medium were added to each well, except for the medium control wells. The plates were incubated for 72 h at 37◦C in 5% CO2atmosphere. The cell growth rate was determined after MTT staining. At the end of the incubation period, 20µL of MTT solution (from a stock solution of 5 mg/mL) were added to each well. After incubation at 37◦C for 4 h, 100µL of SDS solution (10% in 0.01 M HCI) were added to each well and the plates were further incubated at 37◦C overnight. OD was measured at 540 nm (ref.
630 nm) with a Multiscan EX ELISA reader. Combination index (CI) values at 50% of the growth inhibition dose (ED50) were determined using CompuSyn software (ComboSyn, Inc., Paramus, NJ, USA) to plot four to five data points at each ratio. CI values were calculated by means of the median-effect equation, according to the Chou–Talalay method, where CI < 1, CI = 1, and CI > 1 represent synergism, additive effect (or no interaction), and antagonism, respectively [33,34].
3.6. Rhodamine 123 Accumulation Assay
The cell numbers of the human colon adenocarcinoma cell lines were adjusted to 2×10⁶cells/mL, re-suspended in serum-free RPMI 1640 medium, and distributed in 0.5 mL aliquots into Eppendorf centrifuge tubes. The tested compounds were added at concentrations of 2 or 20µM, and the samples were incubated for 10 min at room temperature. Tariquidar was applied as positive control at 0.2µM. DMSO at 2%v/vwas used as solvent control. Next, 10µL (5.2µM final concentration) of the fluorochrome and ABCB1 substrate rhodamine 123 (Sigma) were added to the samples and the cells were incubated for a further 20 min at 37◦C, washed twice, and re-suspended in 1 mL PBS for analysis. The fluorescence of the cell population was measured with a PartecCyFlow®flow cytometer (Partec, Münster, Germany). The fluorescence activity ratio was calculated as the quotient between the FL-1 of the treated/untreated resistant Colo 320 cell line over the treated/untreated sensitive Colo 205 cell line according to the following equation [31]:
FAR = Colo320treated/Colo320control
Colo205treated/Colo205control (1)
3.7. Bacterial Strains
Escherichia coliATCC (American Type Culture Collection) 25922,Salmonella enterica serovar Typhimurium 14028s,Staphylococcus aureusATCC 25,923, and the methicillin and ofloxacin resistantS. aureus272,123 clinical isolates were used in the study.
3.8. Determination of Minimum Inhibitory Concentrations by Microdilution Method
The minimum inhibitory concentrations (MICs) of all tested compounds were de- termined according to the Clinical and Laboratory Standards Institute (CLSI) guidelines in three independent assays. The compounds were diluted in 100µL of Mueller–Hinton medium in 96-well flat-bottomed microtiter plates. The starting concentration was 100µM, and two-fold serial dilutions were prepared in the microplates before the addition of the bacterial culture. Then, a 10−4dilution of an overnight bacterial culture in 100µL of the medium was added to each well, with the exception of the medium control wells. The plates were further incubated at 37◦C for 18 h; at the end of the incubation period, MIC values of the tested compounds were determined by naked eye [35].
3.9. DPPH Assay
A method based on the description of Miser-Salihoglu E. et al. was applied [36].
The examination was performed on a FLUOstar Optima BMG Labtech plate-reader with 96-well microplates. The samples were measured in a DMSO environment with the volume of 150µL per sample resulting 1 mg/mL concentration. Every well contained 50 µL (100µM) of this base solution for the absorbance measurement (30 min; 550 nm). When samples showed no or minor activity, the concentration was doubled for a follow-up measurement. For the most active samples, half the maximal effective concentration (EC50) was determined using a dilution series beginning with a 100µM solution which was halved at every consecutive step. For data evaluation GraphPad Prism 6.0 software was utilized.
The DPPH (2,20-diphenyl-1-picrylhydrazyl) reagent necessary for the process was supplied by from Sigma-Aldrich Hungary [4].
3.10. ORAC Assay
A method based on the description of Mielnik et al. was applied [37]. In summary, 20µL of the samples were used in 0.01 mg/mL concentration with a 96-well black mi- croplate. In each well, 60µL of AAPH (12 mM final concentration) and 120µL of fluorescein solution (70 nM final concentration) were added. The fluorescence alteration of each sample was measured for 3 h with 1.5 min cycle intervals by a FLUOstar Optima BMG Labtech plate-reader. Trolox ((±)-6-hydroxy-2,5,7,8-tetramethyl-chromane-2-carboxylic acid) was used as a standard. Both Trolox and AAPH was supplied by Sigma-Aldrich, Hungary, while Fluorescein was provided by Fluka analytical, Japan. For data analysis, the GraphPad Prism 6.0 software was used. The results were expressed as mmol Trolox equivalent per g of dry material (mmloTE/g) [4].
4. Conclusions
The present report highlights the most important results acquired upon a detailed chemical analysis ofFuscoporia torulosa.These represent a valuable addition to the biologi- cal activity studies of this species. The combination of chromatographic methods led to the identification of six compounds including the novel fuscoporic acid (1) and Z- inoscavin A. Biological activity (cytotoxicity, synergistic, MDR reversal, antioxidant, and antibac- terial) assays were performed to explore the pharmacological potential of the chemical constituents of this fungus. The results obtained revealed that ergosta-7,22-diene-3-one (8) not only exhibits a considerable cytotoxic effect on human colon adenocarcinoma cell lines, but also exhibits synergism with the reference compound doxorubicin.In summary, this study provides notable evidence for the increased interest in the polyporeF. torulosaas a source of fungal metabolites with antioxidant and cytotoxic properties.
Supplementary Materials:The following are available online, Figure S1. 800 MHz1H NMR spec- trum of compound1, Figure S2. 200 MHz13C NMR spectrum of compound1. Figure S3. 800 MHz HSQC spectrum of compound1, Figure S4. 800 MHz HMBC spectrum of compound1, Figure S5.
800 MHz ROESY spectrum of compound1, Figure S6. Literature structure of compound2, Fig- ure S7. 800 MHz1H NMR spectrum of mixture of compounds2and3, Figure S8. 800 MHz13C NMR spectrum of mixture of compounds2and3, Figure S9. 800 MHz HMBC spectrum of mixture of compounds2and3, Figure S10. 800 MHz HSQC spectrum of mixture of compounds2and3, Figure S11. 800 MHz ROESY spectrum of mixture of compounds2and3, Figure S12. 200 MHz
13C NMR spectrum of mixture of compounds4and5, Figure S13. 800 MHz1H NMR spectrum mixture of compounds4and5, Figure S14. 800 MHz1H NMR spectrum of compound6, Figure S15.
200 MHz13C NMR spectrum of compound6, Figure S16. 500 MHz1H NMR spectrum of compound 7, Figure S17. 125 MHz13C NMR spectrum of compound7, Figure S18. 500 MHz1H NMR spectrum of compound8, Figure S19. 125 MHz13C NMR spectrum of compound8, Figure S20. Cytotoxicity dose-effect curve of compound8, doxorubicin and their combination on Colo 320 cell line, report of the combination assay of compound8, Figure S21. Histograms of modulation of P-gp efflux pump assay. Table S1. Isotropic shieldings and unscaled chemical shifts of the conformers ofSSisomer of2
and3, Table S2. Isotropic shieldings and unscaled chemical shifts of the conformers ofSRisomer of2 and3, Table S3. xyz coordinates of conformers of2and3.
Author Contributions:A.S. performed the extraction, isolation, and the antioxidant assays; Z.B. and M.D. performed the spectral analysis and structure determination; V.P. provided sample collection and identification, J.H. and A.V. conceived and designed the experiments; A.K. and G.S. performed the cytotoxicity, checkerboard combination and rhodamine accumulation assays and assay for antibacterial activity; Z.B., V.P. and A.V. wrote the paper. All authors have read and agreed to the published version of the manuscript.
Funding: Financial support for this research were provided by the Economic Development and Innovation Operative Program GINOP-2.3.2-15-2016-00012, and the National Research, Development and Innovation Office, Hungary (NKFIH; K135845).
Data Availability Statement:The data presented in this study are available in this article.
Conflicts of Interest:The authors declare no conflict of interest.
Sample Availability:Samples of the compounds1,3–7are available from the authors.
References
1. Dai, Y.-C. Hymenochaetaceae (Basidiomycota) in China.Fungal Divers.2010,45, 131–343. [CrossRef]
2. Kovács, B.; Zomborszki, Z.P.; Orbán-Gyapai, O.; Csupor-Löffler, B.; Liktor-Busa, E.; Lázár, A.; Papp, V.; Urbán, E.; Hohmann, J.;
Ványolos, A. Investigation of antimicrobial, antioxidant, and xanthine oxidase-inhibitory activities of Phellinus (Agaricomycetes) mushroom species native to Central Europe.Int. J. Med. Mushrooms2017,19, 387–394. [CrossRef] [PubMed]
3. Sridhar, K.R.; Deshmukh, S.K.Advances in Macrofungi; CRC Press: Boca Raton, FL, USA, 2019; pp. 277–303.
4. Sárközy, A.; Kúsz, N.; Zomborszki, Z.P.; Csorba, A.; Papp, V.; Hohmann, J.; Vanyolos, A. Isolation and characterization of chemical constituents from the poroid medicinal mushroomPorodaedalea chrysoloma(Agaricomycetes) and their antioxidant activity.Int. J. Med. Mushrooms2020,22, 125–131. [CrossRef]
5. Dai, Y.-C.; Zhou, L.-W.; Cui, B.-K.; Chen, Y.-Q.; Decock, C. Current advances inPhellinus sensu lato: Medicinal species, functions, metabolites and mechanisms.Appl. Microbiol. Biotechnol.2010,87, 1587–1593. [CrossRef] [PubMed]
6. He, M.-Q.; Zhao, R.-L.; Hyde, K.D.; Begerow, D.; Kemler, M.; Yurkov, A.; McKenzie, E.H.C.; Raspé, O.; Kakishima, M.; Sánchez- Ramírez, S. Notes, outline and divergence times of Basidiomycota.Fungal Divers.2019,99, 105–367. [CrossRef]
7. Chen, Q. Global diversity and phylogeny of Fuscoporia (Hymenochaetales, Basidiomycota).Mycosphere2020,11, 1477–1513.
[CrossRef]
8. Du, P.; Chen, Q.; Vlasák, J.Fuscoporia ambiguaSp. Nov., a new species from America and China.Phytotaxa2020,456, 175–185.
[CrossRef]
9. Ryvarden, L.; Melo, I.Poroid Fungi of Europe; Fungiflora: Oslo, Norway, 2014.
10. Bernicchia, A.; Gorjón, S.P.; Arras, L.; Facchini, M.; Porcu, G.; Trichies, G.Polypores of the Mediterranean Region; Romar: Segrate, Italy, 2020; p. 904.
11. González, A.G.; Expósito, T.S.; Toledo Marante, F.J.; Pérez, M.J.M.; Tejera, E.B.; Bermejo Barrera, J. Lanosterol derivatives from Phellinus torulosus.Phytochemistry1994,35, 1523–1526. [CrossRef]
12. Deveci, E.; Tel-Çayan, G.; Duru, M.E.; Öztürk, M. Isolation, characterization, and bioactivities of compounds fromFuscoporia torulosamushroom.J. Food Biochem.2019,43, e13074. [CrossRef] [PubMed]
13. Khadhri, A.; Aouadhi, C.; Aschi-Smiti, S. Screening of bioactive compounds of medicinal mushrooms collected on Tunisian territory.Int. J. Med. Mushrooms2017,19, 127–135. [CrossRef]
14. Duru, M.E.; Tel-Çayan, G.; Deveci, E. Evaluation of phenolic profile, antioxidant and anticholinesterase effects ofFuscoporia torulosa.Int. J. Second. Metab.2019,6, 79–89. [CrossRef]
15. Covino, S.; D’Ellena, E.; Tirillini, B.; Angeles, G.; Arcangeli, A.; Bistocchi, G.; Venanzoni, R.; Angelini, P. Characterization of biological activities of methanol extract ofFuscoporia torulosa(Basidiomycetes) from Italy. Int. J. Med. Mushrooms2019,21, 1051–1063. [CrossRef] [PubMed]
16. Liu, H.-K.; Tsai, T.-H.; Chang, T.-T.; Chou, C.-J.; Lin, L.-C. Lanostane triterpenoids from the fungusPhellinus gilvus.Phytochemistry 2009,70, 558–563. [CrossRef]
17. González, A.G.; Expósito, T.S.; Barrera, J.B.; Castellano, A.G.; Marante, F.J.T. The absolute stereochemistry of senexdiolic acid at C-22.J. Nat. Prod.1993,56, 2170–2174. [CrossRef]
18. Kim, J.-P.; Yun, B.-S.; Shim, Y.K.; Yoo, I.-D. Inoscavin A, a new free radical scavenger from the mushroomInonotus xeranticus.
Tetrahedron Lett.1999,40, 6643–6644. [CrossRef]
19. Bagno, A.; Rastrelli, F.; Saielli, G. Toward the complete prediction of the1H and13C-NMR spectra of complex organic molecules by DFT methods: Application to natural substances.Chem. Eur. J.2006,12, 5514–5525. [CrossRef] [PubMed]
20. Barone, G.; Gomez-Paloma, L.; Duca, D.; Silvestri, A.; Riccio, R.; Bifulco, G. Structure validation of natural products by quantum-mechanical GIAO calculations of13C-NMR chemical shifts.Chem. Eur. J.2002,8, 3233–3239. [CrossRef]
21. Grimblat, N.; Zanardi, M.M.; Sarotti, A.M. Beyond DP4: An improved probability for the stereochemical assignment of isomeric compounds using quantum chemical calculations of NMR shifts.J. Org. Chem.2015,80, 12526–12534. [CrossRef]
22. Smith, S.G.; Goodman, J.M. Assigning stereochemistry to single diastereoisomers by GIAO NMR calculation: The DP4 probability.
J. Am. Chem. Soc.2010,132, 12946–12959. [CrossRef]
23. Mo, S.; Wang, S.; Zhou, G.; Yang, Y.; Li, Y.; Chen, X.; Shi, J. Phelligridins C-F: Cytotoxic pyrano [4,3-c][2]benzopyran-1,6-dione and furo[3,2-c]pyran-4-one derivatives from the fungusPhellinus igniarius.J. Nat. Prod.2004,67, 823–828. [CrossRef]
24. Lee, I.K.; Seok, S.J.; Kim, W.K.; Yun, B.S. Hispidin derivatives from the mushroomInonotus xeranticusand their antioxidant activity.J. Nat. Prod.2006,69, 299–301. [CrossRef]
25. Batta, A.K.; Rangaswami, S. Crystalline chemical components ofFomes senexand structure of senexdiolic acid and related compounds.J. Chem. Soc. Perkin Trans. 11975,5, 451–455. [CrossRef]
26. Jain, A.C.; Gupta, S.K. The isolation of lanosta-7,9(11),24-trien-3β,21-diol from the fungusGanoderma australe.Phytochemistry1984, 23, 686–687. [CrossRef]
27. Wang, X.; Bao, H.; Bau, T. Investigation of the possible mechanism of two kinds of sterols extracted fromLeucocalocybe mongolicain inducing HepG2 cell apoptosis and exerting anti-tumor effects in H22 tumor-bearing mice.Steroids2020,163, 108692. [CrossRef]
[PubMed]
28. Kim, K.H.; Choi, S.U.; Noh, H.J.; Zee, O.; Lee, K.R. Cytotoxic ergosterol derivatives from the mushroomNaematoloma fasciculare.
Nat. Prod. Sci.2014,20, 76–79.
29. Njue, A.W.; Omolo, J.O.; Cheplogoi, P.K.; Waweru, A.W. Cytotoxic triterpenoids from the mushroomClavulina cinerea(Bull) J.
Schroet (Cantharellaceae).Int. J. Biol. Chem. Sci.2017,11, 865–873. [CrossRef]
30. Bochevarov, A.D.; Harder, E.; Hughes, T.F.; Greenwood, J.R.; Braden, D.A.; Philipp, D.M.; Rinaldo, D.; Halls, M.D.; Zhang, J.;
Friesner, R.A. Jaguar: A High-performance quantum chemistry software program with strengths in life and materials sciences.
Int. J. Quantum Chem.2013,113, 2110–2142. [CrossRef]
31. Gajdács, M.; Spengler, G.; Sanmartín, C.; Mar´c, M.A.; Handzlik, J.; Domínguez-Álvarez, E. Selenoesters and selenoanhydrides as novel multidrug resistance reversing agents: A confirmation study in a colon cancer MDR cell line.Bioorg. Med. Chem. Lett.2017, 27, 797–802. [CrossRef]
32. Spengler, G.; Gajdács, M.; Mar´c, M.A.; Domínguez-Álvarez, E.; Sanmartín, C. Organoselenium compounds as novel adjuvants of chemotherapy drugs—a promising approach to fight cancer drug resistance.Molecules2019,24, 336. [CrossRef]
33. Chou, T.-C. Theoretical basis, experimental design, and computerized simulation of synergism and antagonism in drug combina- tion studies.Pharmacol. Rev.2006,58, 621–681. [CrossRef]
34. Chou, T.-C. Drug combination studies and their synergy quantification using the Chou-Talalay method.Cancer Res.2010,70, 440–446. [CrossRef] [PubMed]
35. Kincses, A.; Szabó, S.; Rácz, B.; Szemerédi, N.; Watanabe, G.; Saijo, R.; Sekiya, H.; Tamai, E.; Molnár, J.; Kawase, M.; et al.
Benzoxazole-based metal complexes to reverse multidrug resistance in bacteria.Antibiotics2020,9, 649. [CrossRef] [PubMed]
36. Miser-Salihoglu, E.; Akaydin, G.; Caliskan-Can, E.; Yardim-Akaydin, S. Evalution of antioxidant activity of various herbal folk medicines.J. Nutr. Food Sci.2013,3, 222.
37. Mielnik, M.B.; Rzeszutek, A.; Triumf, E.C.; Egelandsdal, B. Antioxidant and other quality properties of reindeer muscle from two different Norwegian regions.Meat Sci.2011,89, 526–532. [CrossRef] [PubMed]

![Table 3. DP4+ probabilities obtained for SS and RS isomers of 2 using the template from [21]; s and u refer to scaled and unscaled shifts.](https://thumb-eu.123doks.com/thumbv2/9dokorg/960363.56595/6.892.252.839.245.429/table-probabilities-obtained-isomers-template-scaled-unscaled-shifts.webp)

