Full Terms & Conditions of access and use can be found at
https://www.tandfonline.com/action/journalInformation?journalCode=rero20
ISSN: 1331-677X (Print) 1848-9664 (Online) Journal homepage: https://www.tandfonline.com/loi/rero20
The impact of state intervention on the Hungarian venture capital market
László Kállay & Erika Jáki
To cite this article: László Kállay & Erika Jáki (2020) The impact of state intervention on the Hungarian venture capital market, Economic Research-Ekonomska Istraživanja, 33:1, 1130-1145, DOI: 10.1080/1331677X.2019.1629979
To link to this article: https://doi.org/10.1080/1331677X.2019.1629979
© 2019 The Author(s). Published by Informa UK Limited, trading as Taylor & Francis Group.
Published online: 02 Jul 2019.
Submit your article to this journal
Article views: 488
View related articles
View Crossmark data
The impact of state intervention on the Hungarian venture capital market
Laszlo Kallaya and Erika Jakib
aSmall Business Development Centre, Corvinus University of Budapest, Budapest, Hungary;
bDepartment of Enterprise Finances, Corvinus University of Budapest, Budapest, Hungary
ABSTRACT
As part of its National Development Programmes in the period 2007–2013 Hungary implemented venture capital instruments to improve the competitiveness of small and medium sized companies. The concrete instruments included both fully and partly state-owned VC funds significantly increasing equity finance available for the target group. In our article, we investi- gate the impact of the state intervention on the quality of the VC portfolios built through the programmes. We point out that the key indicators of the portfolio do not promise a significant increase in aggregate company value and they deteriorated in the later years of the programme as the public funding was increased. We draw the conclusion that the size and quality of the venture capital market determines the efficient volume and type of state intervention.
ARTICLE HISTORY Received 23 July 2018 Accepted 14 March 2019
KEYWORDS
venture capital; government intervention; supply shock;
investment pressure;
crowding out impact;
SME finance
1. The importance of the research
As part of the EU funded National Development Programme in the period 2007–2013 Hungary implemented venture capital instruments (the Jeremie1 VC pro- gramme) to improve the competitiveness of small and medium sized companies. The concrete instruments included both fully and partly state-owned VC funds signifi- cantly increasing equity finance available for the target group. At the same time, the Hungarian government implemented a wide range of other state financial pro- grammes as well, funded partly from EU sources, partly from the national budget. In our article, we investigate the impact of the state intervention on the quality of the portfolios built by the partly state-owned VC funds between 2010 and 2016, in an environment characterised by a high level of state aid.
CONTACTLaszlo Kallay laszlo.kallay@uni-corvinus.hu
The project was prepared within the Szechenyi 2020 programme framework (EFOP-3.6.1-16-2016-00013) under the European Union project titled:“Institutional developments for intelligent specialization at the Szekesfehervar Campus of Corvinus University of Budapest.”
ß2019 The Author(s). Published by Informa UK Limited, trading as Taylor & Francis Group.
This is an Open Access article distributed under the terms of the Creative Commons Attribution License (http://creativecommons.org/
licenses/by/4.0/), which permits unrestricted use, distribution, and reproduction in any medium, provided the original work is properly cited.
–
https://doi.org/10.1080/1331677X.2019.1629979
2. Literature review
“State aid is defined as an advantage in any form whatsoever conferred on a selective basis to undertakings by national public authorities. Therefore, … gen- eral measures open to all enterprises are not covered by this prohibition and do not constitute state aid (examples include general taxation measures and employ- ment legislation).” (European Commission, 2016) State intervention can take a variety of forms, e.g., grants, interest and tax relief, guarantees, government hold- ings of all or part of a company, or providing goods and services on preferential terms, etc. State aid is basically banned in the EU (EU, 2012, Article 107), except when there is a special reason to intervene, i.e., when a socially important eco- nomic goal cannot be achieved due to market failure. Job creation, rural develop- ment, and innovation are the most frequent objectives governments try to achieve by providing state aid to enterprises.
Venture capital is one of the areas where the State can intervene by providing pub- lic funding for SMEs. According to Lerner (2012) we cannot readily assume that gov- ernments can effectively promote entrepreneurship and venture capital. One of the reasons for this is that programmes aimed at boosting innovative entrepreneurs may easily miss their target group, ending up benefiting associates of privileged persons.
Most of the authors point out that there is no guarantee for the success of interven- tion when the State runs or promotes venture capital programmes.
The form and the extent of the government intervention are in constant flux as they accord with economic needs. Governments can use multiple instruments to stimulate market activity. Both direct and indirect forms of intervention can be dis- tinguished. (Avots, Strenga & Paalzow,2013, Lerner,2012; Jaki & Molnar,2017):
Indirect government intervention is if the government invests in a venture capital (VC) fund handled by a private VC fund manager. Another form is the tax incen- tives such as tax shields for investment in VC and capital gains tax relief. There are many other measures that are designed to ensure a competitive economic environment for SMEs. For example, the banks’ loans can be supported by gov- ernment guarantees, which can also indirectly develop the SME.
Direct government intervention is when the state-owned VC funds management companies handle EU and state-owned funds. Another direct intervention is when the government organises training programmes and consulting opportunities for SMEs to make them ready for VC investment, or when state-owned banks issue credits to companies that often come with government guarantees.
An important– though very challenging –role for government is to intervene dir- ectly in the entrepreneurial process (Lerner,2012). It is important to avoid either too large or too small initiatives. Programmes that are too small will be unlikely to have significant impact and inflated expectations may create criticism. But efforts that are too substantial run the risk of swamping the markets. The imbalance between plenti- ful capital and limited investment opportunities may distort markets. Avots, Strenga and Paalzow (2013) found that government intervention in the venture capital market is essentially based on two assumptions:
insufficient private venture capital funding supply for new firms;
the ability of the government that invests partly because of externalities such as social impact, job creation, etc.
Moreover, Pergelova and Angulo-Ruiz (2014) found that government guarantees and government equity have a direct effect on new firms’competitive advantage and only an indirect impact on performance. On the other hand, they mentioned that some experts are concerned about the crowding out effect due to the direct involve- ment in the VC market by the government. Based on an empirical survey made in Canada, Cumming and MacIntosh (2006) stated that an increase in public venture capital actually led to a reduction in overall venture capital supply, which means that the public venture capital funds might crowd out classic private venture capital funds.
Conducting an overview of the public VC programmes in the Central and East European region, Karsai (2017) concludes that in some EE countries the venture cap- ital market may not be able to absorb the increased supply of capital. Considering the strong pressure on the VC fund managers to allocate all the resources of the VC pro- grammes, it is likely that investment conditions become softer than they would be in a market without state intervention.
Leleux and Surlemont (2003) analysed venture capital markets in 15 EU countries and found that in most of them (12) the public sector provided VC funds to promote the expansion of the market.
Venture capital investments amount to a very small share of the total outside financial sources of SMEs, usually below 2%. At the same time a much higher pro- portion of government (public) intervention targets the venture capital market. In the EU member countries 14% of the amount allocated for financial instruments (exclud- ing grants) funded venture capital programmes in the period between 2009 and 2016.
The potential target companies of the VC market include early stage companies and firms in the initial expansion stage. Companies in the seed and start-up stage do not realise revenues, they are still working on their idea, creating the prototype of the product or making the service available for their customers. In this stage they have a negative net cash flow and bear a high risk (Jaki, Molnar, & Walter, 2017). When evaluating the performance of portfolio companies it should be considered that their net cash flow is necessarily negative after the VC investment since they start spending cash on the development of their product or marketing. The value of the company will rise after three to five years when the company realises its turnover and profits.
An SME financing gap is considered as a kind of market failure by the EU. SMEs’
access to finance is particularly pressing in new EU member countries, since most of them report a widespread shortage of finance (European Commission, 2008).
Financing is necessary to setting up SMEs and expanding their operations, developing new products, and employing new staff or production facilities. Banks are less willing to finance SMEs generally and especially startups and very new firms (Walter, 2014).
If SMEs are not funded by banks or other financial suppliers, they may not launch a business, which could mean a potential loss to the economy (Vasilescu, 2010). The venture capital market in the CEE region is characterised by a limited number of business angels and incubator organisations and by a high number of underfinanced
promising start-ups.“ …the use of predominantly hybrid funds’forms of government VC programmes were more challenging in the CEE region compared to western Europe. However, the greatest risk of public equity schemes– the crowding out effect on private investors – is absent in the CEE region because of the lack of private investors.” (Karsai,2018, p73).
An investment proposal should be evaluated both by the VC fund manager and by the potential portfolio company (the owner of the intellectual property). Evaluating companies is a very difficult task even in the case of an established business and it is a more complex problem in the case of an early stage company.
The owners of intellectual property are not only interested in setting the pre- money value of the firm high, but also have a tendency to be over-optimistic. A financial plan is over-optimistic if forecasted data systematically deviate from actual values in the positive direction, i.e., sales revenues are over-planned while costs are under-planned (Lovallo, Viguerie, Uhlaner, & Horn, 2007 and Kahneman & Lovallo, 2003, Haw, Jung, & Ruland, 1994; Duru & Reeb, 2002). In financial planning, the time required for execution and the cost factors are typically under-planned while sales revenues are over-planned; consequently, results fall short of the plan. Krizan and Windschitl (2007) defined over-optimism as people’s tendency to rate the likeli- hood of desirable events higher than what it really is while underrating the probabil- ity of non-desirable events. Over-optimism is of critical importance in budgeting because owners have overly optimistic expectations about the company’s future.
Cooper, Woo, and Dunkelberg, (1988) found that entrepreneurs overrated the chan- ces of success of their businesses even though they clearly saw the likelihood of fail- ure in the case of those types of businesses.
A distinction must be made between the followings cases: 1) when planners (internal analysts) have an inside view of the company’s opportunities and have their own personal motivations such as start-uppers, and 2) when external analysts such as investment managers of VC funds prepare or evaluate the forecasts of the potential portfolio company’s performance, who can be regarded as being independent of the company. An agreement on the pre-money value of the potential portfolio company is a precondition for an investment decision. Although the two parties have contra- dictory interests, they should share a realistically optimistic evaluation on intellectual property generated in the project. The data on the stakes acquired by the VC fund managers indicate that the optimism about the growth of company value of the par- ties was very limited in many cases.
We should consider a further possible motivation of the potential portfolio firms.
Even if they do not count on growing company value and thus realising a return, they may get funding for their project, including salaries for a couple of years. By accepting low pre-money value, they gain time and money to continue operating.
Investing in firms characterised by this approach is not reasonable for return driven VC fund managers because it would result in low-performing portfolios, while absorption driven fund managers may have to invest in such firms if there are not enough companies promising higher returns. VC fund managers under absorption pressure bearing a very small proportion of loss but with a guaranteed management fee would reasonably build portfolios even with a high probability of loss.
While analysing the demand side we assume that entrepreneurs have a preference in this ranking of financial resources. We demonstrated in the earlier part of the art- icle that there was an abundant supply of subsidised financial resources available for entrepreneurs in the period 2007–2016. Considering the overall price of outside financial sources, we can conclude that the entrepreneurs’ preference ranking is the following: grants, credit, leasing, factoring, and equity. For potential portfolio compa- nies credit, factoring and leasing are not feasible options, but grants were available for innovation projects. Potential portfolio companies often had the choice to fund their projects from non-refundable money instead of from VC investments.
3. The development policy environment of the hungarian VC market The goal of state intervention in the venture capital market is to improve access to external finance for young innovative firms. The impact of such interventions depends very much on the development policy context. Limited and targeted inter- ventions may yield different results than the ones with a wide spectrum of target areas and large volume of funds provided. The Hungarian government has run large- scale enterprise development programmes in the last two decades.
In the period 2007–2016 Hungary provided over 2.5 times more state aid to enter- prises than the EU average measured as a percentage of GDP and is among the three countries spending an outstandingly high relative amount on state aid. Three-quarters of the state aid was in the form of grants available mainly for small and medium sized enterprises and innovation projects in the competitive sector.
Hungary allocated 30.8% of the European Structural and Investment funds to its economic development and innovation operative programme (European Union,2014).
The Hungarian government runs preferential credit programmes applying a variety of instruments; refinancing, guarantee, interest rate subsidies and direct loans issued by state owned financial institutions. By 2014, 40% of SME loan stock was backed by the government in some form (Sz€oll}osi & Pogacsas, 2014), which is an exceptionally high proportion in a market economy. The credit types backed by the state cover a very wide range including not only investment and working capital loans but also overdraft loans. The Hungarian National Bank refinanced an SME loan programme started in 2013, providing funds up to 70% of the SME credit stock at that time.
Technically this measure is not state aid since it is available for all SMEs.
The high level of state subsidies granted in the long run raises the question if this is an efficient way of promoting entrepreneurship and innovation. Kallay (2014) ana- lysed the major performance indicators of the Hungarian economy and found that there is not a strong connection between the level of state intervention and competitiveness.
In the period 2007–2016, four rounds of tenders were advertised and altogether 25 VC fund managers received funding from public resources; furthermore, a fully state- owned fund and a fund manager was established in 2010. The large number of fund managers strengthened the bargaining power of target companies allowing them to choose from a multiple of offers from fund managers.
In the case of the so-called “closed construction”, equity is to be paid back at the end of the investment period with a predetermined return. The investment works as credit in respect to cash flow. The state owned “Szechenyi T}okealap-kezel}o Zrt.”
(Szechenyi Capital Fund Management Plc.) anticipates a 12% to 15% return on its investments, which is much lower than the expected return of one single investment by other Hungarian or foreign fund VC funds (Jaki & Molnar, 2017).
4. Research questions
In the period subject to our research, the Hungarian government applied two forms of state intervention in the VC market. One was investing public money up to 70%
into venture capital funds under the control of private fund managers (the“Jeremie”
initiative); the other was establishing fully state-owned funds handled by a state- owned VC fund management company. The main question of our research is “what was the impact of state intervention on the Hungarian venture capital market in the period 2007–2016?”to be answered by the following sub-questions:
1. Did the high level of state intervention cause a crowding out effect?
2. How did the quality of portfolios change over time?
3. Has state intervention contributed to economic growth?
5. Period of the research, database and sources
The period of the research is the preparation, investment and exit period of the ven- ture capital programmes funded from the budget of the 2007–2013 Hungarian National Development Programme. The preparation and programme design started in 2007, the first investments by the VC funds were made in 2010, and the final deadline for VC investments was May 2016. The funds are supposed to be closed ten years after their starts.
The primary database of our research consists of the data of the companies receiv- ing investment in the VC programme of the 2007–2013 Hungarian National Development Programme. Our dataset contains information on 353 companies based on their total of 1305 annual balance sheets and financial statements for the financial years 2010–2017. The annual report’s data and additional information about the com- panies were collected form the Hungarian Ministry of Justice official database. In cases where the equity investment was split between two or more years, we took the year of the first investment transaction as the date of the investment. Our database includes the following: total revenue, cost of goods sold, operating expenses, gross profit and net earnings. From the assets side of the balance sheet we collected the fol- lowing data: intangible assets; property, plant and equipment, investments, current assets, and cash. From the liabilities side we composed the owner’s equity and liabilities.
We also used secondary data provided by the Hungarian Private Equity and Venture Capital Association (HVCA) on the total VC market and public VC funds (HVCA,2017).
An obvious limitation of our research is that most of the investments have not been closed and the availability of information on exits is limited.
6. Methodology
6.1. Share of public funds
We summed up the total VC investments (HUF billion), and the public funds invested (HUF billion) in the periods 2002–2008 and 2009–2016, and we calculated the following indicators:
Share of public funds¼Public funds invested HUF billionð Þ100 Total VC investments HUF billionð Þ
6.2. Closed down firms
We identified the companies that closed down their business by the end of 2017 based on the information of the Hungarian Ministry of Justice and the annual reports submitted between 2010 and 2017:
Non-operating companies are the following:
firms which failed to submit annual reports after a given year.
firms which were liquidated in a legal process.
firms which were legally deleted from the register of companies.
We calculated the following indicator:
Proportion of closed down firmst ¼Number of closed down firms by 2017t
Number of firms receiving investmentt
where t is the year of investment.
6.3. Firms in which the VC fund has a share exceeding 50%
We collected information on owners and their shares from the financial statements of the portfolio companies and calculated the following indicator:
Proportion of VC50þfirmst ¼Number of VC50þ firms receiving investmentt Number of firms receiving investmentt
where t is the year of investment and VC50þ denotes the firms in which the share of the VC fund exceeds 50%.
To discover how the quality of portfolios changed over time and whether the absorption pressure affected them we used the following indicators:
6.4. Revenue dynamics (change of revenues)
Change of revenuest;i¼ Revenuest;i Revenuest;0
Where t denotes the year of investment, i is for the number of years after the investment is made (i¼0 indicates the year of investment.)
6.5. Net earnings on revenue
Net earnings on revenuet ¼ Net earningst Total revenuet 6.6. Net earnings on equity
Net earnings on equityt ¼Net earningst Equityt 6.7. Change of intangible assets
Change of intangible assetst;i¼Intangible assetst;i Intangible assetst;0
7. Results
We present our research results in two subchapters; first we analyse the Hungarian VC market then we investigate the portfolios of the Jeremie VC funds.
7.1. The Hungarian venture Capital market between 2002 and 2016
Before the financial crisis (2002–2008) the Hungarian venture capital market was dominated by investments from off-shore funds (registered abroad). There were nei- ther privately-owned nor mixed public-private funds registered in Hungary operating under the domestic regulation. Because of a revised regulation introduced in 2002, establishing venture capital funds in Hungary became a real option. (The preceding regulation set unrealistic conditions for VC funds registered in Hungary.)
Two government owned venture capital funds operated on the market (CELIN and IKTA). Venture capital investments amounted to HUF 71.9 billion (approxi- mately EUR 287.6 million) out of which HUF 3 billion (EUR 12 million) or 4.1% of the total market was made up of public funds. In this period the private and public investments were separated both at the fund and individual transaction level.
Government intervention on the VC market was also strong by international com- parison. From among the Central and East European EU member states Hungary provided the highest amount of state resources to VC funds in the programming period of 2007–2013. EUR 819 million were invested by the governments in the region, EUR 378 million or 46.2% out of this amount in Hungary (Karsai,2017).
In 2008 the Hungarian government advertised the opportunity for VC fund managers to apply for up to 70% of co-funding from the national development programme. All the eight, qualifying venture capital fund managers were estab- lished after the tender was opened, with the aim of taking the co-funding oppor- tunity. There were four additional rounds of the venture capital programme and all the winning fund managers were established in order to apply for public funds.
This development can be regarded as one that stimulated the Hungarian venture capital market by attracting new fund managers. An important question is, how- ever, whether the initial stimulus of public funds generates more private capital investments, or the market remains dependent on additional government money.
After the financial crises (2009–2016) the yearly average volume of investments grew slightly from HUF 10.3 to 10.9 billion (EUR 41.1 to 43.6 million). The dramatic change in the market was due to the enormous increase in public funding growing to as high as 86.2% of the total market (See Table 1). The majority of the public capital came from EU resources within the framework of the national development programme.
The newly registered fund managers started their operations in a market character- ised by a high share of state funds with an absorption pressure. After the allocation of resources for the venture capital programme, there was no opportunity to decrease the amount. The inflexibility of the system became especially clear during the finan- cial crisis that erupted in 2008. Venture capital markets reacted by a significant drop in investment level while the publicly funded Hungarian VC funds still had the same investment targets. The absorption pressure increased after the crisis because the gov- ernment allocated additional resources as part of the 2007–2013 Hungarian National Development Programme for the venture capital market. The main reason for this decision was the absorption pressure at the level of financial programmes generally.
The EU funded credit and guarantee programmes issued and backed fewer loans than the decision-makers had expected, and venture capital seemed to be an easier way to use up resources allocated for innovation and enterprise development. For the second half of the 2007–2013 development programme an additional 75% of the ori- ginal amount was allocated for venture capital fund managers.
We can draw the conclusion that the state intervention on the Hungarian VC mar- ket caused a crowding out effect because private capital was replaced by public funds while the level of investments hardly changed.
7.2. The quality of the portfolios built by the VC funds
A venture capital market dominated by private (non-public) investors is driven by expected and actual return on invested capital. In the long run the return on venture capital funds is very close to the return on other types of investment simply because Table 1. Venture capital investments total market and public funds.
2002–2008 2009–2016
Total VC investments (HUF billion) 71.9 87
Yearly average investment (HUF billion) 10.3 10.9
Public funds invested (HUF billion) 3 75
Share of public funds% 4.1 86.2
Source: Statistics published by the Hungarian Venture Capital Association (HVCA,2017; Karsai2017; own database).
the market mechanisms would narrow large gaps; investors would reallocate their assets to investment instruments promising higher returns. On a VC market with a high share of public money and the necessity to invest funds by a fixed deadline, decisions are driven by absorption pressure. A fund manager would refuse a potential investment with low expected return (considering the level of risk and likelihood of success together) on a market dominated by private money because his portfolio would not perform well with such investments. The fund manager with absorption pressure may approve a transaction with similar parameters even it makes the performance of his portfolio worse since his key indicator is investing all the funds before the deadline. Consequently, he would keep investing after the projects with high enough returns run out, because reallocation of assets is not possible. The only way to spend the allocated money is to build a portfolio with a lower expected return.
If intellectual property represented by the projects has a low pre-money value, the stake of the project owners must remain low, i.e., VC funds will receive majority stakes in the portfolio companies for their investment in cash. These transactions can be considered as a kind of quasi investment because fund managers do not expect to realise return by usual forms of exit (selling the whole company), but instead obligate the project owners to buy back the VC fund’s stake at the end of the exit period. The owners of intellectual property accept a minority stake because they also know that the value of their project is low and hope to fund the development of their project from the VC investment. This makes risk and uncertainty very high, resulting in low performing portfolios.
Furthermore, as VC funds own the majority stake in the portfolio companies, in the event of failure they bear the bulk of the risk. Considering that the State is either the majority or full owner of most of the capital funds, public funds will suffer losses, while privately owned fund managers are fully paid for their services.
Table 2 shows that during the venture capital programme the number of transac- tions implemented by the VC funds in a year grew. We must take into account that the transactions in 2016 were postponed from 2015 and took place in the first quarter of the year. The bulk of the transactions were terminated in the second half of the programme period. At the same time venture capital funds acquired a majority inter- est in most of the cases; only in 2010 and 2011 was the proportion of firms in which the VC funds have a majority stake less than 50%.
Table 2. Share of closed down firms, and firms in which the VC fund has a majority stake by the year of investment.
Year of investment
Number of investments Unit
Proportion of CLOSED DOWN firms %
Proportion of firms in which the VC fund has majority stake %
2010 17 11.8 47.1
2011 27 33.3 37.0
2012 29 24.1 72.4
2013 35 20.0 55.9
2014 96 9.4 57.1
2015 63 12.7 56.7
2016 86 5.8 57.8
Average/SUM 353 13.3 56.3
Source: Own database of Hungarian VC investments 2010-2016.
We analyse the quality of the VC portfolios built as part of the 2007–2013 Hungarian Jeremie VC Programme. We must keep in mind that the VC portfolios usually do not produce high revenues and profits in the early years. The cash invested in the firms must serve the purpose of making the intellectual property of the innovators more valuable.
Losses in the first years are natural, revenue and net earnings would grow later so the indicators of a good quality portfolio show significant change over time; after initial losses revenues and profits start growing. To show the performance of the portfolio, we divided it into seven subsets by the year of investment and present the indicators of each subset from the beginning of the investment period.
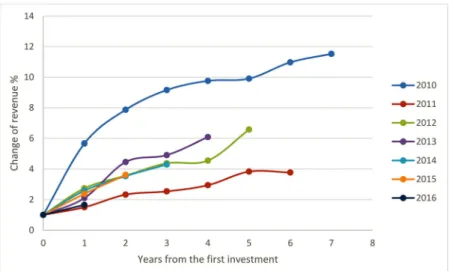
The zero point on the x axis ofFigures 1-4is the year when the VC fund invested in the company and indicator values of the seven groups are shown in relative time.
This method makes the indicators comparable showing how they perform year by year.
As a rule of thumb, the dynamic growth of a firm’s revenue is a precondition of the increasing company value because in most cases it is the basis for higher profits.
Even if a part of the portfolio companies fails, the rest of the firms must produce dynamic growth to increase the future value of the portfolio.
Figure 1 shows that the portfolio subset receiving investments in 2010 had the highest revenue dynamics while subsequent years lag behind, indicating that their business potential is smaller. Furthermore, the growth rate of the turnover demon- strates a declining trend.
Profitability, the firm’s capacity to generate income for the owners is a decisive fac- tor for potential buyers of the stake held by the VC fund. For future investors or buyers of the stake of the VC funds the most important question is how high the return on their investment can be.
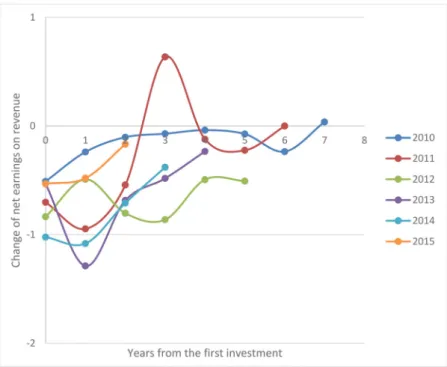
Companies that received investment in the first two years of the programme (2010–2011) have the highest change of net earnings on revenues. The outstanding value of the 2011 portfolio in the third year (2014) of the investment period is Figure 1. Change of revenue of the portfolio firms by year of investment.
Source: data collected by the authors
caused by one firm that received a EUR 140,000 grant from the European Research Council. Portfolio companies receiving VC funding in the subsequent years have produced somewhat lower figures so far. Figure 2 also shows that the Figure 2. Net earnings on revenue of the portfolio firms by year of investment.
Source: data collected by the authors
Figure 3. Change of net earnings on equity of the portfolio firms by year of investment.
Source: data collected by the authors
total net earnings of the portfolio are still negative, outside the exceptional value of the 2011 portfolio subset, and only the 2010 portfolio subset produced positive value in 2017.
There seems to be no clear growing trend in the change of the net earnings on equity. The volatility of the data is partly explained by fact that some of the compa- nies with negative equity have been closed down and this increases the net equity value of the portfolio. The outstanding figure of the part of the portfolio for 2011 in year three (2014) is caused by the firm mentioned above. Even though 53 poorly per- forming firms had been closed down and eliminated from the portfolio by 2017 there seems to be no significant improvement in profitability. The cumulated loss of the portfolio was over HUF 50 billion by the end of 2017, which constitutes 70% of the total capital investment by the VC funds. This means that the bulk of the resources for development has already been spent. The trend is a deteriorating one; profitability of later years’portfolios shows lower figures.
The equity provided by the VC funds is meant to finance the development of the projects of the portfolio firms. The result could be an increase in the intangible assets of the companies. The trend we see in Figure 4 is not promising; after the initial increase, the intangible assets decline indicating that this important element of com- pany value would not attract new owners to most of the firms.
Having been almost over the development period, the current state of the portfolio suggests that the programme would not generate significant economic growth.
8. Conclusions
After analysing the Hungarian VC market in the period 2007–2016 and the portfolios built by the VC funds in the Jeremie programme we can try to answer our research Figure 4. Change of intangible assets of the portfolio firms by year of investment.
Source: data collected by the authors
questions, to characterise the impact of state intervention on the Hungarian venture capital market.
8.1. Did the high level of intervention cause a crowding out effect?
Our analysis shows that although the state allocated significant resources to funding VC investments from 2010, the value of average yearly investment barely grew, while the share of public resources on the market increased from 4% to 86%. Public fund- ing did not work as an additional source of finance, instead most of it replaced pri- vate money.
8.2. How did the quality of portfolios change over time?
The indicators we analysed show that the quality of the portfolios of individual years have a deteriorating trend compared to the performance in the same period after the investment, implying that the increasing volume of public funding and investment transactions resulted in softer project selection standards.
8.3. Has state intervention contributed to economic growth?
The revenue dynamics, net earnings on revenue, net earnings on equity, and the change of intangible assets does not promise such an increase in the value of the portfolio. Our assessment in the current stage of the programme is that value of the whole portfolio is likely to end up below the value of the investment of VC funds.
The inflexible and relatively high supply of public resources result in absorption pressure and through that a softer selection process. The venture capital market is a complex system that provides funding for companies with high growth potential after a selection process. Although uncertainty is very high, and it is difficult to foresee risks in this process the main function of the market is to build viable portfolios with the highest possible return. If the supply shock changes the preferences of the VC fund managers and makes their attitude absorption oriented giving up return orienta- tion, the market would not fulfil its main function, instead – because of the softer selection process– the expected return of the portfolios would be lower including the possibility of being negative. The result may be a counter effective venture capital market that does not stimulate innovation. An additional problem could be generated by the supply shock. Innovators, developers, and start-uppers get a misleading mes- sage about what projects are viable, because it is too easy to get funding. They pay less attention to preparing their projects, seeking a product-market fit, finding cus- tomers, users, and generally building up the business potential of their projects. Thus, supply shock changes the approach of the players who could produce the intellectual property, a basic element of a venture capital market, and the result could be inves- ting in projects with low pre-money value.
We identified early signs of deterioration on the Hungarian venture capital market in the period 2010–2016: investing in projects with low intellectual property, prolifer- ation of quasi investments and minimising private risk in the VC funds.
Our general conclusion is that the capacity of a venture capital market determines the efficient level and structure of state intervention. Increasing supply of VC funds in itself would not automatically result in more value added generated by small innovative firms, because a supply shock can cause deterioration of the market by changing the approach of the key players.
Note
1. Jeremie stands for “Joint European Resources for Small to Medium Sized Enterprises” i.e., the financial instruments jointly funded by the national development programmes and private capital in the EU member countries in the programming period 2007–2013.
ORCID
Laszlo Kallay https://orcid.org/0000-0001-9065-7716
References
Avots, K., Strenga, R., & Paalzow, A. (2013). Public venture capital in Latvia.Baltic Journal of Economics,13(1), 3–30. doi:10.1080/1406099X.2013.10840523
Cooper, A. C., Woo, C., Y., & Dunkelberg, W. C. (1988). Entrepreneurs’perceived chances for success.Journal of Business Venturing,3(2), 97–108. doi:10.1016/0883-9026(88)90020-1 Commission Regulation (EU). (2012). No 360/2012 of 25 April 2012; Official Journal of the
European Union;https://eur-lex.europa.eu/legal-content/EN/TXT/PDF/?uri=CELEX:32012R0360&
from=EN
Cumming, D., & MacIntosh, J. (2006). Crowding out private equity: Canadian evidence.
Journal of Business Venturing,21(5), 569–609. doi:10.1016/j.jbusvent.2005.06.002
Duru, A., & Reeb, D. M. (2002). International diversification and analysts’ forecast accuracy and bias.Accounting Review,77(2), 415–433.
European Commission. (2008). Think small first, A small business act for Europe. Brussels:
COM, 394.
European Union. (2014). Partnership agreement with Hungary - 2014-2020. Brussels: European Commission.
European Commission. (2016).“What is state aid?”. Brussels: European Commission.http://ec.
europa.eu/competition/state_aid/overview/index_en.html
Haw, I.-M., Jung, K., & Ruland, W. (1994). The accuracy of financial analysts’ forecasts after mergers.Journal of Accounting, Auditing & Finance, Summer,9(3), 465–483.
HVCA. (2017). Venture capital and private equity overview Hungary –2017, HVCA; https://
www.hvca.hu/documents/Investment-monitoring-report_2017_v7-1.pdf
Jaki, E., & Molnar, E. M. (2017).Allami es unios szerepvallalas a magvet}oeletszakaszban lev}o vallalkozasok kockazatit}oke-finanszırozasaban. In Farkas Beata, & Pelle Anita (Szerk.) (Eds.), Varakozasokes gazdasagi interakciok. 340 p. Konferencia helye, ideje: Szeged; Magyarorszag, 2016.11 Szeged: JATEPress Kiado. pp. 97–110. (ISBN: 978-963-315-348-2)
Jaki, E., Molnar, E. M., & Walter, G. (2017). Government sponsored venture capital: Blessing or curse?Management (slovenia),12(4), 317–331. doi:10.26493/1854-4231.12.317-331 Kahneman, D., & Lovallo, D. (2003). Delusion of success: How optimism undermines execu-
tives decisions. Harvard Business Review, July.
Kallay, L. (2014). Allami t amogatasok es gazdasagi teljesıtmeny, K€ozgazdasagi Szemle LXI, marc., pp. 279–298).
Karsai, J. (2017). Furcsa par. Az allam szerepe a kockazatit}oke-piacon Kelet-Europaban, K€ozgazdasagi Szemle Alapıtvany. July 2017, pp. 236. ISBN: 9789638976925
Karsai, J. (2018). Government venture capital in Central and Eastern Europe.Venture Capital, 20(1), 73–102. doi:10.1080/13691066.2018.1411040
Krizan, Z., & Windschitl, P. D. (2007). The influence of outcome desirability on optimism.
Psychological Bulletin,133(1), 95–121. doi:10.1037/0033-2909.133.1.95
Leleux, B., & Surlemont, B. (2003). Public versus private venture capital: seeding or crowding out? A Pan-European Analysis. Journal of Business Venturing, 18(1), 81–104. doi:10.1016/
S0883-9026(01)00078-7
Lerner, J. (2012). Boulevard of broken dreams why public efforts to boost entrepreneurship and venture capital have failed - and what to do about it. Princeton, NJ: Princeton University Press.
Lovallo, D., Viguerie, P., Uhlaner, R., & Horn, J. (2007). Deals without delusions. Harvard Business Review, Dec 2007.85(12), p. 92–99, 8p, 1 Chart, 2 Illustrations.
Pergelova, A., & Angulo-Ruiz, F. (2014). The impact of government financial support on the performance of new firms: the role of competitive advantage as an intermediate outcome.
Entrepreneurship & Regional Development, 26(9-10), 663–705. doi:10.1080/08985626.2014.
980757
Sz€oll}osi, L., & Pogacsas, P., (2014). Kedvezmenyes magyar KKV finanszırozasi programokes az NHP. In C. Bokor, M. Endresz, Z. Fellner, B. Hidasi, L. Komlossy, K. Lehmann, D.
Modos, Z. Olah, P. Pogacsas, G. Pellenyi, A. Plajner, L. Sz€ oll}osi, A. Vadkerti, & V.
Varpalotai. N€ovekedesi Hitelprogram az els}o 18 honap - Tanulmanyk€otet a N€ovekedesi Hitelprogram eddigi eredmenyeir}ol, Budapest, Hungary: Magyar Nemzeti Bank, p. 17–26, www.mnb.hu.
Vasilescu, L. G. (2010). Financing gap for SMES and the Mezzanine Capital. Economic Research-Ekonomska Istrazivanja,23(3), 57–67. doi:10.1080/1331677X.2010.11517423 Walter, G. (2014). ‘Vallalatfinanszırozas a gyakorlatban - Lehet}osegek es d€ontesek a magyar
piacon. Vallalatfinanszırozasi lehet}osegek.’. Alinea, Budapest