THE PRECONDITIONS FOR MARKET INTEGRATION COMPATIBLE GAS
TRANSMISSION TARIFFS IN THE CESEC REGION
A CESEC Discussion Paper
Disclaimer: We strongly stress that the investigated tariff scenarios analysed in this paper are purely hypothetic and only for analytical purposes and thus the results cannot serve as a basis for tariff setting of TSOs, nor can substitute the regulatory scrutiny of justified costs whatsoever.
Commissioned by European Commission
Contact: Péter Kaderják (pkaderjak@rekk.hu) Prepared by: REKK Energiapiaci Tanácsadó Kft.
Phone: +36 1 482-7070 Fax: +36 1 482-7037 E-mail: rekk@rekk.hu
May 2016.
EXECUTIVE SUMMARY
Access tariffs to cross-border infrastructure are important features of the natural gas market integration “software”. Distorted access tariffs can lead to the underutilization of both existing and newly built infrastructure.
This paper addresses the relationship between cross-border gas transmission tariffs (mostly entry-exit tariffs) and regional cross-border gas trading between CESEC countries.1 First it identifies the present outlier (above average) tariffs in the region that are most likely to distort efficient cross-border trading. Next the paper offers potential explanations for tariffs being outliers. With market simulation tools2 it assesses the impact of a number of tariff reform scenarios – each addressing outlier tariffs – on market integration, the utilization of existing and a selected set of priority new CESEC infrastructure and on regional social welfare.
The major results of the analyses presented in the paper are as follows.
1. The comparative analysis of (Entry/Exit) tariffs in the CESEC region has shown that
cross-border tariffs are on average lower in the Western part of the region and along former transit routes as compared to the South-East part of the region and to borders with newly built and moderately utilized infrastructure;
they include certain upward outliers which may be related to trade-restricting arrangements, preservation of market power, transit arrangements or are due to the cost effect of infrastructure new-build;
2. The modelling of alternative tariff reform scenarios for the CESEC region has shown the following:
the overall tariff-related market integration and welfare effects in either scenario are not very large;
welfare effects would have been significantly higher modelling with 2015 data but a conscious methodological decision was made to assess the current general low- gas-price context and thus have a conservative assessment;
additionally the welfare analysis considered existing routes and sources in the CESEC region thus there is upside with the opening of e.g. the Trans-Balkan corridor or access to LNG landed in Croatia;
the scenario to lower tariffs across the board to marginal cost results in lower regional gas procurement costs due to almost doubling spot flows leading to the most significant consumer surplus increase across the scenarios; while resulting TSO and LTC-holder revenue losses are similar, those welfare effects are arguably not comparable 1:1; this scenario highlights the outstanding importance of moderate cross-border tariffs on key interconnectors providing spot gas to this LTC-gas dominated region for gas wholesale competition;
the scenario to harmonise regional tariffs to the average will impact trade and sourcing costs for the region very negatively;
1 See CESEC Action Plan (point D.1).
2 REKK’s European Gas Market Model (EGMM) is employed for this purpose.
targeted scenarios to adjust outlier tariffs downward could trigger additional flows resulting in general welfare improvements.
3. The modelling of alternative tariff scenarios for a selected set of priority new CESEC infrastructure has shown that
proposed regasification tariffs and existing cross-border tariffs to Hungary prohibits gas from a new LNG regasification terminal in Croatia to flow out of the country; only significantly reduced regas and cross-border tariffs can help Croatian LNG to have a region-wide market impact;
the implementation of the GR-BG interconnector (or reverse flow), the BG-RO- HU corridor and the BG-RS interconnector at normal tariffs can double the utilization of Greek LNG, Bulgaria and Serbia being the largest beneficiaries; after the implementation of TAP, pipeline gas will compete with Greek LNG in the region.
TABLE OF CONTENTS
Executive summary ... 3
1. Background ... 9
2. Review of current gas transmission tariff characteristics in the CESEC region ... 11
3. The problem: potentially distortive entry exit-tariffs in the CESEC region ... 16
3.1. High exit tariffs ... 16
3.2. High entry tariffs ... 18
3.3. High entry and exit tariffs ... 18
4. Development of gas transmission tariff reform scenarios ... 19
5. Modelling results ... 21
5.1. Non-welfare related findings ... 21
5.1.1. Change in RCC Index (RCCI) ... 21
5.1.2. Change in pipeline flows and utilisation ... 23
5.2. Welfare related results ... 24
5.2.1. A note on TSO profits ... 24
5.2.2. Scenario “a” ... 25
5.2.3. Scenario “b” ... 27
5.2.4. Set of scenarios “c” ... 27
5.2.5. Tariff reduction on the Romanian-Hungarian interconnector ... 28
5.2.6. Tariff reduction on the Croatia-Hungary bidirectional interconnector ... 30
5.2.7. Tariff reduction on the Hungary-Serbia interconnector ... 31
5.2.8. Tariff reduction on the Slovakia - Hungary interconnector ... 32
5.2.9. Scenario “d” ... 32
5.3. General findings ... 33
6. The impact of transmission tariffs on cesec priority infrastructure utilization ... 35
7. Concluding remarks ... 37
8. Annex 1. Tariffs at interconnection points with updated Ukrainian entry-exit fees ... 39
9. Annex 2. Tariffs used for modelling scenarios ... 40
10. Annex 3. Detailed welfare effects ... 46
11. Annex 4. EGMM model description ... 58
12. Annex 5. Detailed price effects ... 60
13. Annex 6. Modelled utilisation of pipelines ... 62
14. Annex 7. Technical annex ... 64
LIST OF FIGURES
Figure 1. Tariffs at interconnection points between CESEC and neighbouring countries,
€/MWh for a standard one-year product of 10 000 kWh/h (based on January 2016 data) ... 13 Figure 2. Level of exit and entry tariffs in the CESEC region, compared to the mean and median across the analysed countries (based on January 2016 data)* ... 14 Figure 3. Relationship between tariff levels and capacity utilization, 2015 ... 15 Figure 4. Total welfare change by stakeholders in the CESEC region caused by entry and exit tariffs set to 0.13 €/MWh (M€/year) ... 26 Figure 5. Change in pipeline flows in Scenario “a” compared to reference case, TWh ... 26 Figure 6. Total welfare change by stakeholders in the CESEC region caused by entry and exit tariffs set to weighted average (M€/year) ... 27 Figure 7. Pipeline utilisation of the RO-HU interconnector at various tariff scenarios, % ... 28 Figure 8. Total welfare effect of the 25% tariff reduction at the RO-HU interconnector by CESEC countries ... 30 Figure 9. Total welfare change by stakeholders in the CESEC region caused by 50%
reduction of entry and exit tariffs on HU-HR interconnector (M€/year) ... 31 Figure 10. Total welfare change by stakeholders in the CESEC region caused by 25%
reduction of entry and exit tariffs on HU-RS interconnector (M€/year) ... 31 Figure 11. Total welfare change by stakeholders in the CESEC region caused by 25%
reduction of entry and exit tariffs on SK-HU interconnector (M€/year) ... 32 Figure 12. Total welfare change by stakeholders in the CESEC region caused by reduction of outlier entry and exit tariffs to average (M€/year) ... 33 Figure 13. Relative change of spot traded gas flows compared to the reference for CESEC region interconnectors ... 33 Figure 14. Value of RCCI in modelled scenarios ... 34 Figure 15. Comparing the total welfare effects of scenarios ... 34 Figure 16. Total welfare change by stakeholders in the CESEC region caused by reduction of entry and exit tariffs to 0.13 €/MWh (M€/year) ... 46 Figure 17. Total welfare change by countries in the CESEC region caused by reduction of entry and exit tariffs to 0.13 €/MWh (M€/year) ... 47 Figure 18. Total welfare change by stakeholders in the CESEC region caused by reduction of entry and exit tariffs to weighted average tariff (M€/year) ... 47 Figure 19. Total welfare change by countries in the CESEC region caused by reduction of entry and exit tariffs to weighted average tariff (M€/year) ... 48 Figure 20. Total welfare change by stakeholders in the CESEC region caused by 25%
reduction of entry and exit tariffs on RO-HU interconnector (M€/year) ... 48 Figure 21. Total welfare change by countries in the CESEC region caused by 25% reduction of entry and exit tariffs on RO-HU interconnector (M€/year) ... 49 Figure 22. Total welfare change by stakeholders in the CESEC region caused by 50%
reduction of entry and exit tariffs on RO-HU interconnector (M€/year) ... 49 Figure 23. Total welfare change by countries in the CESEC region caused by 50% reduction of entry and exit tariffs on RO-HU interconnector (M€/year) ... 50 Figure 24. Total welfare change by stakeholders in the CESEC region caused by 25%
reduction of entry and exit tariffs on HU-RS interconnector (M€/year) ... 50 Figure 25. Total welfare change by countries in the CESEC region caused by 25% reduction of entry and exit tariffs on HU-RS interconnector (M€/year) ... 51 Figure 26. Total welfare change by stakeholders in the CESEC region caused by 50%
reduction of entry and exit tariffs on HU-RS interconnector (M€/year) ... 51
Figure 27. Total welfare change by countries in the CESEC region caused by 50% reduction of entry and exit tariffs on HU-RS interconnector (M€/year) ... 52 Figure 28. Total welfare change by stakeholders in the CESEC region caused by 25%
reduction of entry and exit tariffs on SK-HU interconnector (M€/year) ... 52 Figure 29. Total welfare change by countries in the CESEC region caused by 25% reduction of entry and exit tariffs on SK-HU interconnector (M€/year) ... 53 Figure 30. Total welfare change by stakeholders in the CESEC region caused by 50%
reduction of entry and exit tariffs on SK-HU interconnector (M€/year) ... 53 Figure 31. Total welfare change by countries in the CESEC region caused by 50% reduction of entry and exit tariffs on SK-HU interconnector (M€/year) ... 54 Figure 32. Total welfare change by stakeholders in the CESEC region caused by 25%
reduction of entry and exit tariffs on HU-HR interconnector (M€/year) ... 54 Figure 33. Total welfare change by countries in the CESEC region caused by 25% reduction of entry and exit tariffs on HU-HR interconnector (M€/year) ... 55 Figure 34. Total welfare change by stakeholders in the CESEC region caused by 50%
reduction of entry and exit tariffs on HU-HR interconnector (M€/year) ... 55 Figure 35. Total welfare change by countries in the CESEC region caused by 50% reduction of entry and exit tariffs on HU-HR interconnector (M€/year) ... 56 Figure 36. Total welfare change by stakeholders in the CESEC region caused setting outliers to average tariffs (M€/year) ... 56 Figure 37. Total welfare change by countries in the CESEC region caused setting outliers to average tariffs (M€/year) ... 57 Figure 38. 2016 reference case yearly average prices, €/MWh ... 60
LIST OF TABLES
Table 1. Gas transmission tariff systems in CESEC countries and the average share of the
commodity component in total tariff payments (considering all entry and exit points) ... 11
Table 2. Above-average cross border total transmission tariff cases (bold letters) and outlier entry tariffs (italic letters) in the CESEC region (left, January 2016 data) and potential underlying explanations (right) ... 16
Table 3. Value of RCCI and consumer surplus in the modelling scenarios ... 21
Table 4. Country level cost convergence index (CCCI) ... 23
Table 5. Relative change of LTC and spot traded gas flows compared to reference on the CESEC region’s interconnectors ... 24
Table 6. LTC and spot flow related welfare change effects, M€ ... 25
Table 7. Entry, exit and total tariffs applicable on the RO-HU interconnector (€/MWh) ... 28
Table 8. Pipeline utilization effect (% left, TWh right) of the tariff reduction scenarios on the RO-HU interconnector ... 29
Table 9: Modelled spot flows on HR_LNG and HR-HU cluster (TWh/yr) ... 35
Table 10: Modelled spot flow on Greek LNG cluster (TWh/yr) ... 36
Table 11. Tariffs used on the CESEC interconnectors in reference case and scenarios “a”, “b” and “d” (€/MWh) ... 40
Table 12. Tariffs used on the CESEC interconnectors in scenarios “c1-c2” (€/MWh) ... 41
Table 13. Tariffs used on the CESEC interconnectors in scenarios “c5-c6” (€/MWh) ... 42
Table 14. Tariffs used on the CESEC interconnectors in scenarios “c9-c10” (€/MWh) ... 43
Table 15. Tariffs used on the CESEC interconnectors in scenarios “c13-c14” (€/MWh) ... 44
Table 16. Tariffs used on the CESEC interconnectors in scenarios “c17-c18” (€/MWh) ... 45
Table 17. Sources of input data used in the EGMM ... 59
Table 18. Modelled reference wholesale gas price for the CESEC region in 2016 Q1 (€/MWh) ... 61
Table 19. Absolute price change of the modelled scenarios compared to the reference (€/MWh) ... 61
Table 20. Change in relative utilisation of pipelines, %. Green background indicated 2% higher utilisation while red background shows 2% lower utilisation. ... 62
Table 21. Change in absolute pipeline flows, TWh/year. Green background indicated 2% higher utilisation while red background shows 2% lower utilisation. ... 63
Table 22. Exchange rates used for tariff calculation ... 64
Table 23. ISO 3166-1 alpha-2 Country codes ... 65
1. BACKGROUND
The market integration that the EU aspires to achieve requires compatible regulation between neighbouring countries with regard to interconnector access. Specifically, capacity allocation, congestion management and access tariffs to cross-border infrastructure are important features of the natural gas market integration “software”. Even if a critical infrastructure project is built and commissioned, its contribution to market integration can be obstructed by misguided regulatory policy. In some instances, regulatory distortions lead directly to the underutilization of particular new infrastructures.
This paper addresses the relationship between cross-border gas transmission tariffs (mostly entry-exit tariffs) and regional cross-border gas trading between CESEC3 countries. It will identify the present outlier (above average) tariffs in the region (see Figure 4 below) and distinguish them based on past analyses and anecdotic evidence. Then it will assess the impact of a number of tariff reform scenarios by removing identified distortions caused by the outlier tariffs with market simulation tools.
The primary function of national gas transmission tariff systems is to provide sufficient revenue for the national TSOs to cover their justified costs. In the region it is the sole responsibility of national institutions (primarily National Regulatory Authorities) to determine gas transmission tariffs, including tariffs for interconnection access. The third package obliged EU member states to apply entry/exit (E/E) transmission tariffs according to principles laid out in Article 13 of the Gas Regulation4, but this did not specify the exact methodology of allocating justified costs between intra-country and cross-border exit/entry points. Thus Member State NRAs have nearly a free hand in determining the actual tariff levels and structures according to their preferred methodology.
However, beyond TSO cost recovery, the significance of gas transmission tariffs for regional market integration and cross border trade is obvious.
Let’s consider the case of two neighbouring gas markets, A and B, where A is cheaper than B and both have an E/E tariff regime. While the wholesale gas price difference serves as the fundamental driver for cross border trade, this trade incentive is reduced by the sum of the exit tariff from market A plus the entry tariff to market B that the gas traders will have to pay at the border. Trade incentives might be further reduced by congestion on interconnectors (a rare phenomenon in the CESEC region).
The structure of the discussion paper is as follows. Section 2 provides for a detailed review of cross-border gas transmission tariff characteristics for the CESEC region based on the most recent available data. Tariff levels, structures and outliers are elaborated. Section 3 concerns the typology of outlier tariffs and includes a discussion of the circumstances that might explain them. Section 4 first outlines four major hypothetical cross-border tariff reform scenarios, each of them addressing the issue of outlier tariffs. In section 5, REKK’s European Gas Market Model (EGMM) is employed to simulate the likely impacts of those hypothetic
3 The CESEC region includes altogether 14 countries, hereafter referred to with the following country codes:
Austria (AT), Bosnia and Herzegovina (BA), Bulgaria (BG), Greece (GR), Croatia (HR), Hungary (HU), Italy (IT), FYROM Macedonia (MK), Moldova (MD), Romania (RO), Serbia (RS), Slovenia (SI), Slovakia (SK), Ukraine (UA)
4 Regulation (EC) No 715/2009 of the European Parliament and of the Council of 13 July 2009 on conditions for access to the natural gas transmission networks and repealing Regulation (EC) No 1775/2005
tariff reform scenarios, compared to a reference case of wholesale gas prices, social welfare, the level of gas trading activity (gas flows), the utilization level of infrastructures and TSO revenues from entry-exit tariffs around the region. In particular, we are interested in potential Pareto-improvements, when e.g. a decrease of a particular cross-border tariff might increase trading activity and welfare so that potential losers from the change can be compensated to the level before the change and overall gains still remain positive. Results are presented by:
The use of the Regional Cost Convergence Index (RCCI), which shows the relative additional cost of the gas bill of the region compared to Western-European markets.5
The change in utilisation in the region’s interconnectors.
Welfare change in the Region’s countries presented by countries and stakeholders.
5 For a detailed description of RCCI, see Section 5.1.
2. REVIEW OF CURRENT GAS TRANSMISSION TARIFF CHARACTERISTICS IN THE CESEC REGION
Gas transmission tariff systems vary from country to country regarding the tariff structure (see Table 1), types of capacity products, measurement units as well as the reference gas conditions in the CESEC region.6
Table 1. Gas transmission tariff systems in CESEC countries and the average share of the commodity component in total tariff payments (considering all entry and exit points)
Tariff system Average share of commodity
component in total tariff (at 56.2% Load Factor)***
Type of tariff system Application of capacity and commodity elements****
Austria entry-exit only capacity 0%
Bosnia and Herzegovina
postage stamp only commodity 100%
Bulgaria postage stamp only commodity 100%
Croatia entry-exit commodity part at exit points 4%
Greece entry-exit commodity part at entry points** 14%
Hungary entry-exit commodity part at exit points 12%
Italy entry-exit commodity part at entry points 20%
Macedonia postage stamp only commodity 100%
Moldova postage stamp only commodity 100%
Romania entry-exit commodity part at exit points 22%
Serbia* entry-exit commodity part at exit points 22%
Slovakia entry-exit only capacity 0%
Slovenia entry-exit metering cost at entry and exit, other commodity component at exit
17%
Ukraine* entry-exit only commodity 100%
Notes:
In those countries, where the payable fee includes a commodity component, it is charged at the exit points (except for Italy and Greece).
The percentage share of the commodity element shown in the table was determined by summing up the fees (entry, exit and commodity) payable for transporting 1 MWh of gas at all entry and exit points in the given country, and dividing the commodity portion by this amount.
* introduced in 2015
** only entry points, not including exit point
*** based on Acer Market Monitoring Report 2015, pp. 251-252.
**** capacity component refers to tariff elements with a capacity type measurment unit (e.g. EUR/MWh/h), commodity component refers to tariff elements with a commodity type measurement unit (e.g. EUR/MWh)
6 Primary gas transmission tariff information for this analysis was collected from the web pages of the national TSOs and NRAs. When entry/exit point prices are the outcome of an auction, reserve prices were applied as a proxy. Technical data on gas characteristics were collected from the web pages of TSOs and the ENTSOG. The source of exchange rate information is the European Central Bank for EU Member States and National Bank homepages for the countries outside the EU.
In order to make baseline comparisons, transmission fees were estimated as a standardized transportation service for each relevant cross-border point and expressed in a common measurement unit (€/MWh) (see Reference scenario in Table 11 in Annex 2 for the estimated transmission fees). The assumed standard transportation service has the following characteristics:
The duration of transmission contracts is one year
Contracts refer to firm transportation services
The booked maximum hourly capacity is 10 000 kWh (/h/y)7
Applied load factor is 56.2%8
Tariff are expressed in €/MWh
Using our assumed capacity reservation level of 10 000 kWh/h and load factor (56.2%) for the yearly firm transmission service contract, we calculated the overall transportation fee (in
€) that would be incurred by a shipper at each interconnection point (IP), making all the necessary conversions regarding gas reference conditions and currency units. Once we have arrived at the total fee corresponding to the standardized service, tariffs can be determined on a per MWh basis, dividing total payments by the yearly transported volume (€/MWh). Where entry and exit tariffs apply, the fee consists of the relevant exit plus entry fees due at the two sides of the border (including the commodity fee at the relevant point).
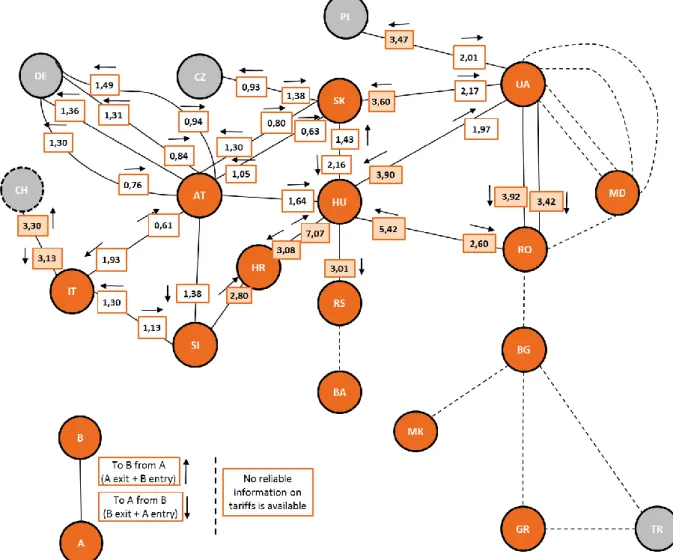
Figure 1 illustrates the interconnections between the analysed countries and presents the value of estimated total (exit + entry) transmission fees referring to gas flows in both directions. The coloured value boxes mark higher than average tariffs, while the arrows indicate the related flow directions. It is apparent from the figure that tariffs are generally lower in the Western part of the CESEC region and along major former transit routes (e.g. SK-AT-IT; SK-CZ).
Countries with a single supply route tend to have higher tariff rates (e.g. RS). Some well- connected countries can also be characterized with high tariff rates (e.g. UA, HU or RO) due to the pricing of new infrastructure, protectionist measures or other reasons (see Section 3 for a discussion on the possible reasons for outlier tariffs).
7 Capacity size was chosen based on interviews with gas industry market participants.
8 Load factor is calculated as: (Average flow)/(Average booked capacity). Average booked capacity utilization in Europe is reported in the Acer Market Monitoring Report 2015, pp. 251-252.
Figure 1. Tariffs at interconnection points between CESEC and neighbouring countries, €/MWh for a standard one-year product of 10 000 kWh/h (based on January 2016 data)9
Source: REKK
It is also worth looking at total tariffs decomposed to exit and entry tariffs by borders. Figure 2 presents the exit and entry tariffs for all the interconnectors of the CESEC countries.10 The horizontal lines indicate the mean and median values of exit and entry tariffs in the charts (mean values are 1.33 and 0.92 EUR/MWh, medians are 0.90 and 0.80 EUR/MWh respectively)11. Countries with exit tariff levels above the mean are Croatia, Hungary, Romania and Ukraine. Austria and Slovakia are above the median, but under the mean values.
Higher than average entry tariffs apply for some of the IPs of Croatia, Hungary, Romania,
9 More recently Ukrainian exit and entry tariffs have been increased significantly (see Annex 1. Tariffs at interconnection points with updated ukrainian entry-exit fees). Exit fee modifications have relevance for Ukraine and Russia but not much for the present analysis. However, increased entry fees to Ukraine could likely decrease natural gas flows to Ukraine compared to figures indicated in Tables 20 and 21.
10 In case of some borders (BG-GR; BG-MK; BG-TR, RO-BG; RS-BA; TR-GR, UA-MD) no reliable information was available on tariffs, and third party access is not always possible, thus we did not include these borders in the later analysis. Some other borders are not included, because according to ENTSOG and TSO websites no capacity is available in the given directions (HU-AT, RS-HU, HR-SI, SI-AT).
11 Mean exit and entry tariffs would be at 1.52 and 1.1 while the median exit and entry tariffs at 0.92 and 1.06 EUR/MWh without the cross border tariffs between the CESEC region vis-à-vis the Czech Republic and Germany.
Serbia and Ukraine. The entry tariff in Italy is higher than the median value but under the mean. As can be seen from the two graphs, exit tariffs are generally higher than entry tariffs.
This can be partly explained by the fact that commodity charges are in most cases applied at the exit points (except in Italy and Greece, where it is applied at the entry points). The combinations of outlier exit and entry tariffs will serve as the basis for a potential typology of outlier cross-border transmission fees in the next section of the paper.
Figure 2. Level of exit and entry tariffs in the CESEC region, compared to the mean and median across the analysed countries (based on January 2016 data)*
* Note: Since, according to ACER, the average load factor of booked gas transmission capacities decreased from 79% in 2013 to 56.2% in 2015 in Europe, we tested the sensitivity of estimated transmission tariffs to this
remarkable change in the load factor. We can only report on a notable 45% increase of Croatian exit tariffs from 2014 to 2015 by assuming a uniform 79% load factor for the period 2013-2015.
Source: REKK
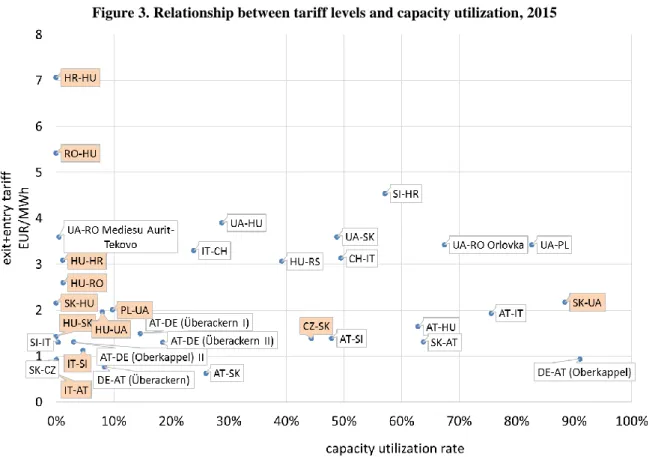
Figure 3 explores the possible relationship between infrastructure utilisation rates and level of tariffs payable at the IPs in the region. According to the plotted values, lower utilization rates cannot generally be associated with higher tariff rates. One striking result is the underutilization of a large share of the interconnectors: almost half of the observed infrastructure – 15 out of the analysed 33 pipelines – had a utilization rate below 10% in 2015, especially cross-border capacities (and reverse flow possibilities) built and implemented after 2009 (coloured IPs). Only one of the newly realized cross-border capacities has a high utilisation rate (SK-UA). Although most of the highly utilised infrastructures are priced below the average (2.24 €/MWh), there are many exceptions, such as the HU-RS, SI- HR, UA-SK, UA-RO (Orlovka) and UA-PL interconnectors, for which transit fees are determined.
Although there is no significant correlation between tariff levels and utilisation rates, there are many pipelines with high tariffs and rather low utilisation rates (HR-HU, RO-HU, UA-RO, HU-HR, HU-RO) and most of them are newly built infrastructure. However, many of these lines were built to improve supply security which does not ensure high utilization rates under normal market conditions and thus also poses a challenge for tariff setting.
Figure 3. Relationship between tariff levels and capacity utilization, 2015
Source: REKK, ENTSOG and IEA. Only those interconnectors are included for which reliable information was accessible.
Utilization data retrieved from the IEA12 and ENTSOG13 showed somewhat higher utilization rates of for the newly implemented infrastructure in 2014, but at only by 1-2% relatively insignificant.
12 www.iea.org/gtf/
13 https://transparency.entsog.eu/
3. THE PROBLEM: POTENTIALLY DISTORTIVE ENTRY EXIT- TARIFFS IN THE CESEC REGION
This section identifies those cross-border gas transmission tariffs that may hinder gas market integration in the CESEC region and offers possible explanations for such outlier tariffs.
Typology is based on results from past analyses and anecdotic evidence. A basic assumption of the present analysis is that while NRAs assess the overall justified costs of national transmission systems fairly (to be collected through entry-exit tariffs), the allocation of costs among internal and cross-border entry-exit points might sometimes be distortive for various reasons.
Table 11 in Appendix 1 shows 2016 entry, exit and total tariffs for all relevant CESEC cross- border gas shipping directions. There are 8 cases, in addition to all connection points when gas enters neighbouring markets from Ukraine, where the total tariff crossing national borders is above the regional mean value of 2.24 €/MWh. In addition, there are 5 cases when entry tariffs are above the mean value of 0.92 €/MWh but total tariffs remain below average. The remainder of the paper focuses on the analysis of these outliers.
The first of the following pair of cross tables includes those cases with above-average total (exit + entry) cross border transmission tariffs (bold letters) as well as above average entry tariff cases with below average total tariffs (italic letters). The accompanying cross-table provides the possible explanation behind the outlier E/E tariff combinations.
Table 2. Above-average cross border total transmission tariff cases (bold letters) and outlier entry tariffs (italic letters) in the CESEC region (left, January 2016 data) and potential underlying explanations (right)
EXIT EXIT
Low High Low High
ENTRY
Low No problem CH-IT; UA-SK
ENTRY
Low No problem
(a) Low cost country export
limitation; (b) former transit fee
translated into high exit fee; (c)
single route dependence
High
AT-HU; HU-UA;
PL-UA;SK-HU;
SK-UA; HU-HR;
IT-CH; SI-HR;
HR-HU; HU-RO;
HU-RS; RO-HU;
UA-HU; UA-PL;
UA-RO
High
(d) Market protection of
incumbent supplier
(e) New built regulatory trap;
and/or combination of
cases (a)-(d)
3.1. HIGH EXIT TARIFFS
Higher than average exit tariffs might reflect different underlying regulatory “stories”.
a. Low-cost production country export limitation. Cross-border E/E tariffs can be used in a strategic manner to discourage the export of low-cost gas. Low-cost gas comes mainly from domestic production in the CESEC region (mostly Romania, Croatia and Hungary). Despite the commercial interest of gas extracting companies, government policies might prefer to channel low-cost gas to supply household retail customers or local industry, mostly at regulated (cost-based) prices and limit export opportunities. This might be a particularly attractive policy option if the company
involved in gas production is foreign owned. The simplest option to limit the export of domestically produced gas is strategic underinvestment into interconnection infrastructure. This might take the form of postponing the investment decision of an interconnector or resisting reverse flow implementation for an existing one. Once the physical infrastructure is in place, the remaining option to limit natural gas exports in a “market-conforming” manner is to set a prohibitive exit tariff from the country in question. This could make gas export unprofitable and thus unlikely on a purely commercial basis. The sign of this phenomenon is reflected in an outstanding high exit tariff.
Exit tariffs from Croatia to Hungary and Slovenia and from Romania to Hungary are well above average. After the completion of the Hungary- Romania interconnector in 2010, the Romanian TSO had been reluctant to invest in reverse flow from Romania to Hungary for years. Hungary was against the reverse flow exemption, claiming that in a supply disruption situation Hungary could use Romanian sources (storage or own production).
The Commission was involved in the negotiations and a minor reverse flow capacity (5% of the total capacity) was inaugurated in 2013. Since then, exit tariffs from Romania were set at a prohibitive level (2013: 2.25 €/MWh; 2014:
4.42 €/MWh; since then 3.67 €/MWh). Croatia has also been reluctant to implement reverse flow at the Croatian-Hungarian border. The exit tariff from Croatia to both Hungary and Slovenia is 5.8 €/MWh, the highest among CESEC countries.
b. Transit contract (non-EU) and legacy transit contract (EU) costs translated into high exit fees. The Third Package obliged EU member states to replace their former gas transmission tariff schemes (mostly distance-related or post stamp) with the Entry/Exit tariff scheme. Part of the rationale for this change was to eliminate gas transit within the EU internal gas market. Nevertheless, the duration of legacy gas transit contracts do not necessarily respect this regulatory change. Ukraine, Turkey and Switzerland still transit natural gas to EU Member States while other EU Member States (e.g. Bulgaria, Hungary or Romania) still “transit” Russian gas through their territories to non-EU countries. In certain cases and directions, we might suspect legacy transit costs to be translated into the E/E tariffs in the form of higher exit fees in order to collect certain pre-determined revenues from given trading partners by affected national TSOs.
All above average exit tariffs from Ukraine are suspect cases in this regard.
The highest exit fee from Hungary is towards Serbia (2 €/MWh). The case is very sensitive given that total gas quantities for Serbia and Bosnia and Herzegovina are imported through this point. Note that the entry fee from Hungary to Serbia is also slightly above average.
c. Single route dependence. There are four countries in the CESEC group with a single gas transmission entry point to their internal systems: Bosnia and Herzegovina, FYR of Macedonia, Moldova and Serbia. The lack of route diversification makes these markets vulnerable not just to the market power by their gas supplier(s) but also to the market power of their transmission provider. This market power might be reflected in high exit tariffs to these markets.
The transmission tariff from Hungary to Serbia is clearly an outlier. Although we regarded our information on transmission tariffs for the remaining three countries as uncertain, we have to note that all three cross-border tariffs to
these countries (from Serbia to Bosnia and Herzegovina, from Bulgaria to FYR of Macedonia and from Romania to Moldova) seem to be well above average.
However, this is due to higher than average entry tariffs in case of Moldova and FYR of Macedonia and high exit and entry tariffs to Bosnia and Herzegovina.
3.2. HIGH ENTRY TARIFFS
We discuss two possible underlying “stories” for higher-than-average entry tariffs. One of them is the new-built regulatory trap discussed below. According to this hypothesis, a high general cost level of a significantly expanded national transmission system might call for both high exit and entry fees to recover high CAPEX costs. The second story is the following:
d. Market protection for the incumbent wholesaler. High entry fees to a gas market favour, ceteris paribus, the incumbent gas wholesaler / supplier of that market by reducing the competitiveness of alternative gas suppliers to that particular market.
This case can only be relevant for markets where the incumbent gas wholesaler is in a potentially contestable situation.
Cross-border entry tariffs to Croatia and Hungary as well as from Hungary to Serbia are higher than average. Market protection of local incumbent wholesalers might be an issue for all dominant local wholesalers. For Hungary, the new built trap is a potential alternative hypothesis to explain over-average entry tariffs from several directions.
3.3. HIGH ENTRY AND EXIT TARIFFS
The combination of high entry and exit tariffs can reflect the combination of the explanations under points (a)-(d) or be explained by an alternative hypothesis.
e. The “new-built regulatory trap” (NBRT). The 2009 January gas crisis made it clear that a major gas infrastructure upgrade was needed to improve gas supply security and market integration in Central and South East Europe. However, there has been a stark difference in the intensity of cross border gas infrastructure investments among CESEC countries as well as in the level of EU support provided for these efforts since the crisis. Due to the standard transmission tariff regulatory practice for new gas infrastructure with free third party access, the capital cost of new infrastructure enters the cost base of national E/E transmission tariffs mainly through increased depreciation and regulatory asset base. This implies a significant increase in national E/E tariffs as a result of a prudent regulatory practice. Since new interconnectors often create alternative shipment routes for diversification purposes, they immediately become competitive with existing infrastructure for hosting gas flows. However, relatively high tariffs would discourage gas flows away from routes, including new infrastructure components, and lower the probability of recovering the relatively high CAPEX of new infrastructure. Reduced flows due to high relative E/E tariffs put further upward pressure on tariffs that further reduces the competitiveness of new infrastructures. We call this process the “new-built regulatory trap”. This will be marked by the generally high relative tariff level of a particular national system. Based on the data in Table 2, Hungary fits into this definition of a new-built regulatory trap.
Indeed, all entry tariffs to Hungary are outliers and the Romanian and Serbian exit tariffs are above average. There will be a brief discussion of alternatives responses to the NBRT.
4. DEVELOPMENT OF GAS TRANSMISSION TARIFF REFORM SCENARIOS
In this and forthcoming sections we use the European Gas Market Model (EGMM), developed by REKK, to investigate the likely impact of tariff reform scenarios for the CESEC that eliminate distortive effects of the most egregious outliers. Market and welfare impacts of these scenarios are then compared to the CESEC reference. It is important to note that the Ukrainian transit system charges, the Trans Balkan pipeline and the entry charges for neighbouring countries from the Ukrainian system remained unchanged in the course of the analysis. The reason for that is the existing legal constraint that prohibits any use of the Trans Balkan pipeline by third parties, where only long term contracted gas is shipped.
We strongly stress that the investigated tariff scenarios are purely hypothetic and only for analytical purposes and thus the results cannot serve as a basis for tariff setting or substitute for the regulatory scrutiny of justified costs whatsoever.
The EGMM covers the gas markets of 35 European countries. A detailed description of the model is provided in Annex 4. For this exercise, the model was calibrated to reflect recent (Q1 2016) price and flow patterns.14 The input data sources used for modelling is summarized in Table 17, Annex 4. Modelled yearly wholesale gas prices of the 2016 reference (in
€/MWh) are listed in Table 18, Annex 5. The model assigns transportation tariffs to cross- border interconnection points, where shippers have to pay the sum of the exit rate of the departure country and the entry rate of the country which the gas enters, plus any commodity component due either at the exit or entry points (or, in some cases, both).
To assess the effect of transmission tariff adjustments in the region, we carried out scenario analyses by keeping all model input parameters at the reference level except for the tariffs on gas interconnectors. While we expect only moderate changes in total annual social welfare of the modelled 14 CESEC countries from transmission tariff changes, modelling results reveal the direction, the beneficiaries and those negatively impacted by the change from moving away from distortive tariffs.
Based on the tariff benchmark carried out in Section 3 of this paper the idea was to create a limited number of scenarios to analyse the effect of tariff change on the wholesale gas prices of the CESEC region and on the utilization of existing pipelines.
The following tariff reform scenarios are assessed:
UNIFORM TARIFFS ADJUSTMENTS
a. Reduction of each pair of E/E tariffs to the assumed marginal cost of operating the interconnectors (0.13 €/MWh) at CESEC borders without compensating the tariff decrease in any other way for TSOs. This way total transmission tariff on each border is 0.26 €/MWh. CESEC and non-CESEC interconnector tariff is changed only on the CESEC side of the pipeline.15
14 The modelling was carried out in March 2016. Modelled flows were verified with the 2015 actual flows reported by Eurostat, IEA and ENTSOG transparency platform. About 90% of total modelled European flows are close to 2015 data reported by Eurostat, ENTSOG and IEA on 70% of interconnectors. Price levels were calibrated to reflect 2016 Q1 TTF and oil indexed gas prices.
15 Eg.a Germany-Austria interconnector tariff is adjusted at the Austrian entry side but not on the German exit side, since Germany is not a CESEC country.
b. We set a uniform cross border tariff based on the weighted average of entry tariffs and weighted average of exit tariffs by 2015 observed cross-border flows. Note that weighted average tariffs this way are not identical with average tariffs.
Uniform entry tariffs are set to 0.77 €/MWh, exit tariffs to 1.67 €/MWh. Total transmission tariff on each border (except for the Ukrainian borders and the Trans- Balkan corridor) is set to 2.44 €/MWh.
SELECTIVE TARIFF ADJUSTMENTS
c. Investigation of the effects of gradually decreasing tariffs on outliers and their impact on welfare and market outcomes. The tariff level of outliers was decreased one-by one by 25-50% ceteris paribus.
d. Smoothing of outliers: reduction of outlier tariffs to the average level (without compensation). All entry tariffs above the average entry level were reduced to 0.92 €/MWh and all exit tariffs above the average exit level were set to the average 1.33 €/MWh at the same time. Tariffs under the average remained on their current level.
Despite significant efforts by BULGARTRANSGAZ and DESFA, under the auspices of the European Commission, to conclude an Interconnection Agreement and additional efforts to make reverse flow from Greece to Bulgaria possible, the lack of third party access and limited transparency are still major features of the Trans-Balkan corridor. Consequently, tariff adjustment was not analysed for related interconnectors as well as for the pipelines exiting Ukraine for similar reasons. On these interconnectors, tariffs were not modified in any of the scenarios.
Since we choose not to compensate the TSO for the possible revenue reduction due to tariff decrease, we expect other stakeholders in the gas market to realise some gains in welfare compared to the reference. Our underlying idea is that within the modelled country boundaries, welfare redistribution is possible among stakeholders. For instance, a reduction in tariffs may hurt the TSO on total revenue basis, but may result in a general price reduction and increased consumer welfare. Theoretically, this welfare increase may finance the lost TSO revenues by a simple change of tariffs on the exit to distribution system. We are interested in how the change in regional social welfare, due to increased trade and price changes, compares to the change in aggregate TSO revenues.
5. MODELLING RESULTS
5.1. NON-WELFARE RELATED FINDINGS
5.1.1. Change in RCC Index (RCCI)
In this section we give a quick overview of the changes compared to the reference case in market integration indicators other than social welfare. We use the RCCI (Regional Cost Convergence Index) as an indicator of the region’s cost (and thus indirectly price-) convergence to Western-European markets.16 The RCCI is formally calculated as:
𝑅𝐶𝐶𝐼 = ∑ 𝑝𝑖∙ 𝑞𝑖 𝑝𝑠𝑝𝑜𝑡∙ 𝑄− 1 Where
i is an index of CESEC countries
pi is the average annual wholesale gas price in country i in €/MWh qi is the annual average gas consumption in TWh
pspot is the average annual wholesale gas price in the TTF in €/MWh Q is the total gas consumption of the CESEC region in TWh
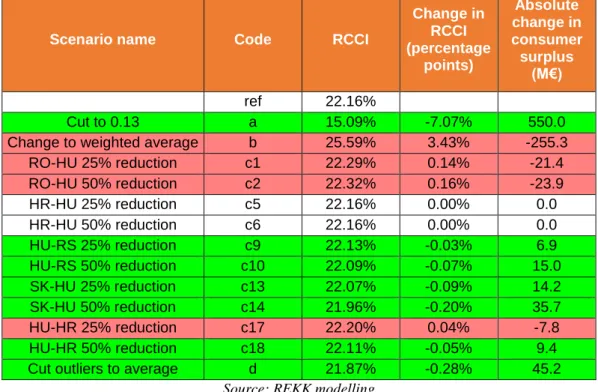
Table 3. Value of RCCI and consumer surplus in the modelling scenarios
Scenario name Code RCCI
Change in RCCI (percentage
points)
Absolute change in consumer surplus
(M€) ref 22.16%
Cut to 0.13 a 15.09% -7.07% 550.0
Change to weighted average b 25.59% 3.43% -255.3
RO-HU 25% reduction c1 22.29% 0.14% -21.4
RO-HU 50% reduction c2 22.32% 0.16% -23.9
HR-HU 25% reduction c5 22.16% 0.00% 0.0
HR-HU 50% reduction c6 22.16% 0.00% 0.0
HU-RS 25% reduction c9 22.13% -0.03% 6.9
HU-RS 50% reduction c10 22.09% -0.07% 15.0
SK-HU 25% reduction c13 22.07% -0.09% 14.2
SK-HU 50% reduction c14 21.96% -0.20% 35.7
HU-HR 25% reduction c17 22.20% 0.04% -7.8
HU-HR 50% reduction c18 22.11% -0.05% 9.4
Cut outliers to average d 21.87% -0.28% 45.2 Source: REKK modelling
16 The RCC Index was introduced by Kaderják et al (2015), Natural Gas Market Integration int he Danube Region: the role of infrastructure development, in: Competition and Regulation 2015, Institute of Economics, MTA, Budapest, pp. 239-65.
The indicator shows the additional cost of the total gas bill which the CESEC region pays compared with procuring all gas demand at the spot price (in our case the TTF). Consumer welfare change results from the modelling underpin these findings. In the reference case, the CESEC region pays an extra of 22.16% due to existing long term contract constraints and infrastructure bottlenecks. In scenario “a”, the region’s tariffs are set at the minimum level allowing for more spot gas flows. This includes a reduction in the DE-AT tariff (considering the AT entry), which allows for more flows on the interconnector (utilisation spiked from 71% to 92%). Consequently, increased trade from Western-Europe to Eastern Europe drives a price convergence – a reduction in CESEC regional prices and an increase in TTF price compared to the reference. In this scenario the RCCI index declined by 7%. We must stress that in all cases we assumed that the price of long-term contracted gas at the border of the importer country is unchanged, so all effects on the RCCI index are stemming from changes in spot gas flows.17
In scenario “b”, a price increase happened on some pipelines connecting the region to the Western-European markets. Consequently, availability of cheaper spot gas was limited by the tariffs and the RCCI index increased to 25.59%.
The set of “c” scenarios considers price changes on targeted individual interconnectors within the region, hence the aggregate effect of these scenarios is expected to be negligible.
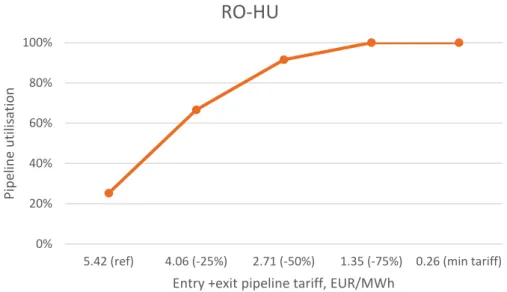
When tariffs at the RO-HU interconnector are reduced, the overall gas bill of the region becomes somewhat higher than in the reference case. The reason for this is the fact that Romanian domestic production is priced below TTF. Allowing this gas to reach neighbouring markets decreases the price in Hungary and Serbia but does not compensate for the increase in gas price in Romania. This explains the slightly higher RCCI relative to the reference.
Tariff adjustment at the HU-RS interconnector gives negligible but positive results. Increased spot gas flows on the interconnector allow for lower prices in Serbia and Bosnia.
Unfortunately, the relatively low consumption of these two countries compared to the whole region’s gas usage makes the effects inconsequential.
Tariff adjustment on the HU-HR interconnector provides differing results. At 25% reduction, the gas price in Croatia is lower than in the reference, but this means that some spot flows originally delivered to the other Balkans countries are “re-routed” to Croatia, so for instance Bosnia and Serbia experience somewhat higher prices than in the reference. The price drop in Croatia does not balance out the price hike in the other countries, leading to a higher RCCI. In the 50% price reduction case, Croatian price decrease is stronger and can compensate for the other countries’ price increase, hence the lower RCCI. Still, the outcomes are to be considered close to zero.
In scenario “d” outlier tariffs are cut back to the average level. This outcome is still rather insignificant since no interconnectors to the Western markets are affected.
Although on regional level most results are negligible, on country level these changes can be considerable. In this case, we provide a simple country average annual price over TTF gas price figure. Formal representation of the index is as:
𝐶𝐶𝐶𝐼 = 𝑝𝑖∙ 𝑞𝑖 𝑝𝑠𝑝𝑜𝑡 ∙ 𝑞𝑖− 1
17 This assumption is based on the paper of Simon Pirani and Katja Yafimava (2016): Russian Gas Transit Across Ukraine Post-2019: pipeline scenarios, gas flow consequences, and regulatory constraints. OIES PAPER:
NG 105
Where
i is an index of CESEC countries
pi is the average annual wholesale gas price in country i in €/MWh qi is the annual average gas consumption in TWh
pspot is the average annual wholesale gas price in the TTF in €/MWh
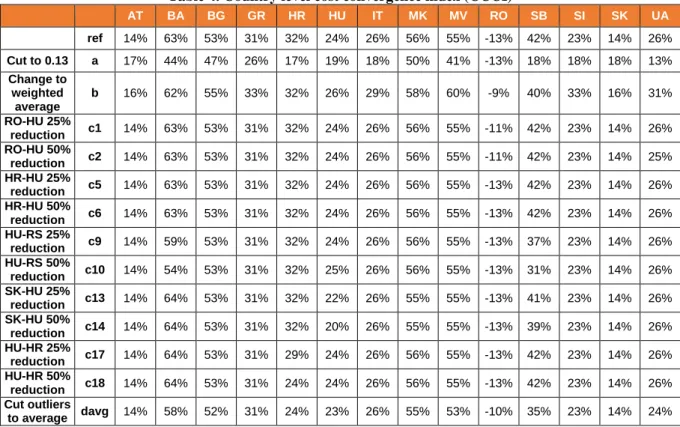
Calculation of the RCCI on the country level reveals the large difference in the position of certain CESEC countries. Consumers in more isolated countries (BA, BG, MK, MD, RS) pay high above the TTF and the most radical tariff cut scenario “a” would change the overall picture. However, tariff cuts on individual interconnectors can have a greater impact. For instance, HU-RS tariff reduction makes a significant positive change in the CCCI in Bosnia and Herzegovina and Serbia, and HU-HR tariff adjustment improves the Croatian CCCI.
Table 4. Country level cost convergence index (CCCI)
AT BA BG GR HR HU IT MK MV RO SB SI SK UA
ref 14% 63% 53% 31% 32% 24% 26% 56% 55% -13% 42% 23% 14% 26%
Cut to 0.13 a 17% 44% 47% 26% 17% 19% 18% 50% 41% -13% 18% 18% 18% 13%
Change to weighted
average
b 16% 62% 55% 33% 32% 26% 29% 58% 60% -9% 40% 33% 16% 31%
RO-HU 25%
reduction c1 14% 63% 53% 31% 32% 24% 26% 56% 55% -11% 42% 23% 14% 26%
RO-HU 50%
reduction c2 14% 63% 53% 31% 32% 24% 26% 56% 55% -11% 42% 23% 14% 25%
HR-HU 25%
reduction c5 14% 63% 53% 31% 32% 24% 26% 56% 55% -13% 42% 23% 14% 26%
HR-HU 50%
reduction c6 14% 63% 53% 31% 32% 24% 26% 56% 55% -13% 42% 23% 14% 26%
HU-RS 25%
reduction c9 14% 59% 53% 31% 32% 24% 26% 56% 55% -13% 37% 23% 14% 26%
HU-RS 50%
reduction c10 14% 54% 53% 31% 32% 25% 26% 56% 55% -13% 31% 23% 14% 26%
SK-HU 25%
reduction c13 14% 64% 53% 31% 32% 22% 26% 55% 55% -13% 41% 23% 14% 26%
SK-HU 50%
reduction c14 14% 64% 53% 31% 32% 20% 26% 55% 55% -13% 39% 23% 14% 26%
HU-HR 25%
reduction c17 14% 64% 53% 31% 29% 24% 26% 56% 55% -13% 42% 23% 14% 26%
HU-HR 50%
reduction c18 14% 64% 53% 31% 24% 24% 26% 56% 55% -13% 42% 23% 14% 26%
Cut outliers
to average davg 14% 58% 52% 31% 24% 23% 26% 55% 53% -10% 35% 23% 14% 24%
Source: REKK modelling
5.1.2. Change in pipeline flows and utilisation
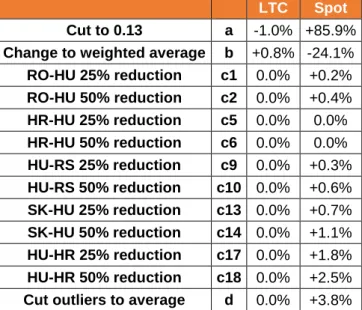
Changes in total pipeline flows in the region show the effect of tariff on trade. We differentiated between LTC and spot flows. Scenario “a” had the strongest positive effect by crowding out LTC flows with spot flows. Scenario “b” hindered the spot trade, thus the region’s countries had to procure more LTC gas. The set of individual tariff reduction scenarios “c” and outlier reduction scenario “d” had negligible effects on pipeline utilisation.
LTC flows remain mainly untouched by any sort of tariff adjustment. At the same time, spot flows react to the tariff scenarios even up to an 80% change in the most radical tariff cut scenario (“a”).
Table 5. Relative change of LTC and spot traded gas flows compared to reference on the CESEC region’s interconnectors
LTC Spot Cut to 0.13 a -1.0% +85.9%
Change to weighted average b +0.8% -24.1%
RO-HU 25% reduction c1 0.0% +0.2%
RO-HU 50% reduction c2 0.0% +0.4%
HR-HU 25% reduction c5 0.0% 0.0%
HR-HU 50% reduction c6 0.0% 0.0%
HU-RS 25% reduction c9 0.0% +0.3%
HU-RS 50% reduction c10 0.0% +0.6%
SK-HU 25% reduction c13 0.0% +0.7%
SK-HU 50% reduction c14 0.0% +1.1%
HU-HR 25% reduction c17 0.0% +1.8%
HU-HR 50% reduction c18 0.0% +2.5%
Cut outliers to average d 0.0% +3.8%
Source: REKK modelling. For individual pipeline utilisation figures of the different scenarios see Annex 6
5.2. WELFARE RELATED RESULTS
RCCI in the previous chapter captured the consumer’s position change as result of modifying changing wholesale gas prices in the analysed scenarios. Utilisation of the pipelines is also an important indicator of market-based trade. However, there are other players in the market outside of consumers and TSOs whose positions are affected. Total welfare change integrates the position change of all market participants:
Consumers, by evaluating the consumer surplus
Producers, by presenting the profit of the natural gas producer companies
TSOs, by calculating profits on the entry-exit regime and congestion rents
SSOs, by calculating profits on storage activity
LNG facility operators
Long term contract holders, by calculating a profit of selling long-term contracted gas to national markets
Welfare effects are considered for only the CESEC region countries and results are presented as an absolute change compared to reference.
In the simulations ceteris paribus cross-border tariff adjustments for TSOs remain uncompensated by tariff increases on internal exit or entry points.
Note that welfare analysis results presented in this paper apply equal weights for the welfare components (surplus or profit) of each stakeholder. Given the short term, static nature of the EGMM model, this approach is justified. However, in a dynamic setting some stakeholders, in particular long term contract holders could adjust to the new tariff conditions so that their short term losses are partly mitigated by initiating contract renegotiation with their suppliers (or in case of the TSO, with the relevant NRA).
5.2.1. A note on TSO profits
Simple modification of TSO E/E tariffs may affect revenues of the TSO that are realised from long-term contracted flows. Since LTC flows were contracted at their minimum on the reference scenario as well, no changes are expected in LTC flow levels. However, if LTC volumes are inflexible, a change in tariffs may introduce additional revenues or losses to the
TSO, which are not balanced by other welfare effects. This is because in the modelling framework we do not consider the welfare of the exporter party. This way any change in the reference tariffs introduces a welfare effect from “outside the system”.
Therefore we indicate the TSO welfare effect related to long-term contracted flows to be able to adjust modelling results.
Table 6. LTC and spot flow related welfare change effects, M€
a b c1 c2 c5 c6 c9 c10 c13 c14 c17 c18 dav TSO profit change from LTC -614 522 0 0 0 0 -11 -21 0 0 0 0 -21 TSO profit change from spot -264 16.5 1.2 1.93 -0 -0 -4.7 -10 -1.2 -3.5 2.39 1.61 -11
Total TSO profit change -878 538 1.2 1.93 -0 -0 -15 -32 -1.2 -3.5 2.39 1.61 -33 Source: REKK modelling
It is apparent that in most scenarios, the LTC related TSO effects are accounting for most of the change. We corrected for this effect in all our results.
5.2.2. Scenario “a”
Scenario “a” tests a radical decrease (down to 0.13 €/MWh for entry and exit) in the pipeline tariffs across the modelled CESEC countries with the exception of the Trans Balkan pipeline and all pipelines exiting Ukraine as explained earlier. The tariff reduction is more radical in South East Europe than in the Central European countries.18 Our expectation is that lower tariffs lead to lower wholesale gas prices and increased flow. The consumer welfare will grow by the drop in prices, but at the same time domestic producers will sell their gas cheaper, so their position will also worsen compared to the reference case. The same negative effect is true for long term contract holders. There is a possibility that the positive consumer welfare component will compensate for TSO and producer losses.
Figure 4 shows the modelled welfare change in scenario “a” for the consumers, TSOs and for the other market participants (including storage system operators, LTC contract holders, and domestic producers of natural gas). It is apparent that the price decrease does have positive welfare effects for the consumers, but at the same time the tariff reduction cuts deeply into the revenues of the TSOs and other market participants (in this case, producers are the most affected). On the whole, the welfare change is slightly negative compared to the reference, since consumer welfare change does not fully compensate the reduction of welfare of other market participants.
18 In this analysis, by Central European countries we mean Austria, Slovakia, Hungary, Slovenia. South-East Europe covers Romania, Bulgaria, Croatia, Bosnia and Herzegovina, FYROM and Serbia.