DOI: 10.18427/iri-2017-0070
Long Term Relationships of Hungarian Companies
1Zsófia J
ÁMBOR, Andrea G
ELEI Corvinus University of BudapestAbstract. Considering the growing interest of firms regarding their long term relationships in our constant and rapidly changing world, we study these types of relationships maintained by Hungarian companies. The
study is based on the Competitiveness Research Centre’s database created in 2013, more than 80% of the firms in the sample belong to SMEs. Our goal is to get a deeper insight and understanding of these long term relationships. Therefore, we identify different reasons for developing them, based on these reasons we create specific clusters and compare the
relationship content of them along three dimensions: (i) the level of commitment between partners; (ii) social bonds; and (iii) the value of the
relationship. We have a triadic approach and examine both supplier and customer relationship of the focal firms filling out our questionnaire.
Results suggest that on the supplier side, two factors (reliable/stable supply and potential radical cooperation in innovation), while on the customer side, three factors (stable capacity utilisation, new orders by the
customer, potential small cooperation in innovation) determine the reasons of maintaining long term relationships. We could identify three significantly different clusters on both sides of the supply triad that reflect a relational content contradicting the traditional relationship management literature suggesting two types of balanced long term relationships, the
so-called arm’s length and the strategic relationship.
Keywords: long term relationship, triad, supply chain
Introduction
Considering the growing interest of firms regarding their long term relationships in our constant and rapidly changing world, we study these types of relationships maintained by Hungarian companies. Our goal is to get a deeper insight and understanding of the long term relationships.
Besides the traditional relationship types (the so called arm’s length and strategic relationships) we also examine potential coopetitive relationships.
Within the supply chains literature in many cases research focuses on dyadic relationship (for example: buyer – supplier or seller – customer.
According to other arguments this dyadic approach has severe limitations, since it is possible to examine the dynamics of a relationships only in triads, such as the supplier – buyer – buyer’s customer triad (Choi & Wu, 2009; Li & Choi, 2009). In our study we have a triadic approach analysing the relationships maintained by the focal company with its most important supplier and customer.
Customer expectations appear in the literature on different levels.
Mandják and Durrieu (2000) differ 3 levels of customer expectations, these are the transactional (for example expectations associated with purchasing of given product/service), the relationship (for example innovation) and the so called network related expectations (for example expectation of further information through given supplier). These expectations have a crucial influence on the actual relationship management practice focal firms have (Gelei, 2012). In our study we have the purpose to examine this effect, and to identify different relationship types along the different practices.
After the introduction the methodology used will be presented in the next section. Following, our results will be presented, and in the last section our main conclusions will be summarized.
Methodology and research results
The study is based on the Competitiveness Research Centre’s database created in 2013 at the Corvinus University of Budapest. Approximately 83% of the participant firms in the sample belong to SMEs, total 300 companies filled in the questionnaire. Generally from the whole sample we can conclude that in the high sample size data 71.3% of the companies belong to internal non state-owned ownership companies. The top core businesses of the respondents belong to commerce (20%), engineering (15.3%), service (14.7%) and food industry (11%) (Csesznák & Wimmer, 2014). With the help of deep quantitative data analysis we were able to achieve our exploratory goal and examine existing theory about the three levels of customer expectations. The analysis was run in IBM SPSS 22 Programme following the logic below. First, firms working in long term relationships with their suppliers and customers have been selected. The original question in the questionnaire was: “What percentage of the supplies/sales in given sector is based on contracts considered as long term?” Those firms have been selected where the answer was higher than zero. More than 70% of the respondents have been selected. Total 214 companies maintain for supplier-focal company contracts and total 218 companies maintain long term contracts for customer-focal relationships.
These firms composed the basis of our analysis, which was performed for
are used, what is the reason behind?” Numerous answers related to specific customers’ expectations are listed for this question. These expectations and their internal connections were examined using factor analysis. Within factor analysis Principal Component Analysis method has been used, rotation has been performed by Varimax method. Kaiser- Meyer-Olkin’s Measure of Sampling Adequacy has been calculated in both cases (supplier and customer sides) according to Nunnaly and Bernstein (1994). After this, Cronbach Alpha values of the variables (associated with the same factors) have been double checked, as visible on Figures 1 and Figure 2. On both sides Cronbach Alpha values are higher than 0.5 We can conclude that in case of supplier – buyer relationships the internal consistency achieves high level, in case of seller - customer relationships the internal consistency achieves an acceptable level.
Figure 1. Rotated component matrix with factors in supplier – buyer relationships
1 2
Adequate price (purchasing costs calculable in advance). 0.245 0.735
Reliable /stabile supply. -0.048 0.876
Cover of appropriate purchasing volume. 0.338 0.717
Predictable supplier performance. 0.288 0.701
Excellent reliability on product's or service's quality. 0.244 0.767
Potential small cooperation in innovation. 0.676 0.182
Potential radical cooperation in innovation. 0.83 0.097
New orders to be achieved through given supplier. 0.665 0.404
Important information to be obtained through given
supplier. 0.786 0.333
Access to other important actors through given supplier. 0.778 0.351 Flexible "call in" due to contract setting. 0.763 0.309
Potential common strategy with supplier. 0.687 0.498
Cost reduction possibilities. 0.555 0.603
Supplier adheres existence of long term contract. 0.622 0.286
To get advantages afront competitors. 0.696 0.407
Other. 0.736 -0.07
CRONBACH ALPHA 0.923 0.855
VARIANCE EXPLAINED (%) 0.519 0.119
SUPPLIER In case you are using long term contracts in your supplier relationships, what is the reason behind?
Component
Source: using data of Competitiveness Research Centre’s database (2013), based on own calculation in SPSS
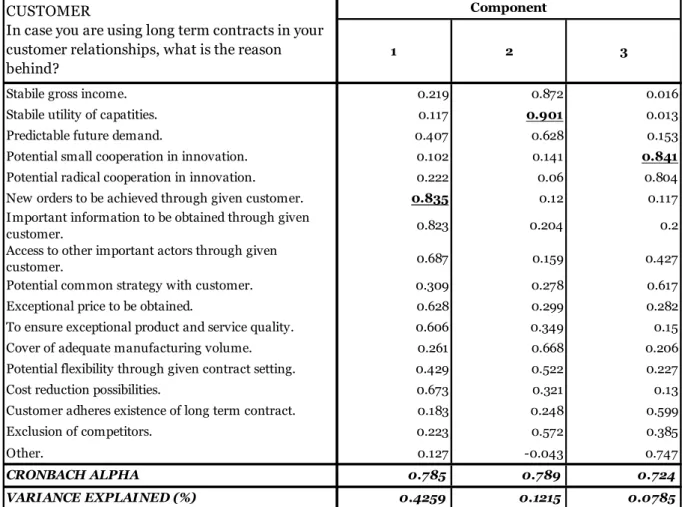
Figure 2. Rotated component matrix with factors in seller – customer relationships
1 2 3
Stabile gross income. 0.219 0.872 0.016
Stabile utility of capatities. 0.117 0.901 0.013
Predictable future demand. 0.407 0.628 0.153
Potential small cooperation in innovation. 0.102 0.141 0.841
Potential radical cooperation in innovation. 0.222 0.06 0.804
New orders to be achieved through given customer. 0.835 0.12 0.117
Important information to be obtained through given
customer. 0.823 0.204 0.2
Access to other important actors through given
customer. 0.687 0.159 0.427
Potential common strategy with customer. 0.309 0.278 0.617
Exceptional price to be obtained. 0.628 0.299 0.282
To ensure exceptional product and service quality. 0.606 0.349 0.15
Cover of adequate manufacturing volume. 0.261 0.668 0.206
Potential flexibility through given contract setting. 0.429 0.522 0.227
Cost reduction possibilities. 0.673 0.321 0.13
Customer adheres existence of long term contract. 0.183 0.248 0.599
Exclusion of competitors. 0.223 0.572 0.385
Other. 0.127 -0.043 0.747
CRONBACH ALPHA 0.785 0.789 0.724
VARIANCE EXPLAINED (%) 0.4259 0.1215 0.0785
CUSTOMER In case you are using long term contracts in your customer relationships, what is the reason behind?
Component
Source: using data of Competitiveness Research Centre’s database (2013), based on own calculation in SPSS
After performing factor analysis and detecting the factors for each relationship types, we have performed cluster analysis in order to identify the different thinking of the respondents.
In this following section results of relationship analysis will be presented first for long term supplier then for customer relationships. Also a comparison is presented between the two relationship groups. The same type of questions have been asked from the focal companies in the questionnaire about their suppliers and also their customers. Also, the logic and applied methodologies were the same. This analysis has concluded the following results.
Supplier related relationships
First we checked the supplier related long term relationships. Using the factor analysis 2 factors appeared as latent variables. According to our interpretation the first latent variable is in line with the theoretical construction of transaction related, while the second with the relationship level expectations. The variables with the highest factor load have been used for this cluster analysis. This was stable supply in case if the transactional, and potential for radical innovation in case of the relationship level expectations.
In summary we can conclude that the respondent companies are maintaining long term relationships on one hand to gain the so called classical competitive advantages (and it is attached to the phenomenon of competition); on the other hand companies are maintaining long term relationships in order to archive advantages which are realizable on more complex way, on longer time period (requiring cooperation between the partners).
Based on the above described variables we have grouped the respondent companies using cluster analysis. First we used hierarchical cluster analysis that resulted in three clusters, then used the K-means clustering method to finalize cluster memberships (see Figure 3.).
As visible on Figure 3, total 211 companies got into three different groups reflecting a sophisticated relationship management practice of the analysed focal firms. Respondent companies think differently about their existing long term relationships with their suppliers. As a next step we have tried to map the differences in the portfolio of supplier relationship management based on the following three questions:
- “What is the level of relation-specific investments (RSI) with your most important supplier?” This question contains 5 sub questions related to the different types of such idiosyncronic investments (Bensaou, 1999), like human resources, special tools, new procedures, new site, other. We have asked respondents for
evaluating both the present, but also the past level of RSI (3 years ago). These relation-specific investments are by definition hard to transfer to other relationship, and therefore reflect the level of commitment between partners in the relationship (Håkansson &
Ford, 2002).
- “How important is the social bond with your most important
supplier?” Several dimension of this social bond have been asked here, for example: common goals, loyalty, trust, cooperation, trustworthiness, etc. This question is reflecting to the concept of social bond between partners according to the ARA model
(Håkansson & Shenota, 1995).
- “When is a supplier relationship considered valuable in your company?” Numerous options have been listed, here too for example: reliability, reputation, continuous innovation of the
supplier, special knowledge of the supplier, etc. The third question
involves the issue of relationship value into our analysis (Ulaga &
Eggert, 2005).
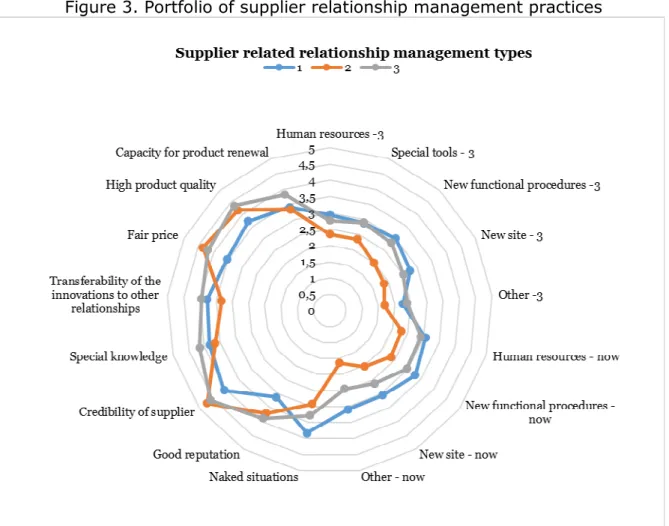
Figure 3. Portfolio of supplier relationship management practices
Source: using data of Competitiveness Research Centre’s database (2013), based on own calculation in SPSS
The first relationship management type (marked as blue) feels relatively sensitive in connection with naked situations, new site, new procedures and human resources. On the other side the third group (marked as grey) evaluates a supplier as valuable and key due to its special knowledge, high product quality, capacity for product renewal, transferability of the innovations to other relationships and good reputation. The second group (marked as orange) feels less committed to its supplier, for this group two major issues are especially important, the fair price and the credibility of the supplier. For all three groups social bond relation characteristics and relationship value characteristics are more important and valuable compared to the actual levels of RSI that is the level of commitment of the relationship.
Customer related relationships
After analysing the long term relationships with the supplier, we have analysed the long lasting customer relationships, what are the reasons behind to create and maintain long relationship between focal company and its customer. The same logic and methodology was used, taking those respondent companies (total 218 companies) that maintain long term contracts. As mentioned above, three factors appeared to be present within the expectations of the focal firm. All the three theoretical levels of expectations appear as factors, the transactional level (the biggest factor load in case of stabile utilization of capacity), relationship level expectations (the biggest factor load in case of potential cooperation for small innovation) and the network level expectations (the biggest factor load in case of acquiring new orders through existing customers).
Based on the above described three concrete variables we have carried at cluster analyses the same way presented above. Three significantly different customer relationship groups have been identified (see Figure 4).
As visible on Figure 4, total 216 companies got into three different groups which mean that the respondent companies think differently about their existing customer related long term relationship management techniques. In the next step we have tried to map the differences based using similar questions as in the supplier relationship management analysis:
- “What is the level of RSI with your most important customer?” This question contains 5 sub questions related to the different
dimensions of such RSIs.
- “How important is the social bond with your most important
customer?” Several sub questions have been asked here too, for example: common goals, loyalty, trust, cooperation,
trustworthiness, etc.
- “When is When is a customer relationship considered valuable in your company?” Numerous options have been listed again, for example:
reliability, reputation, continuous innovation of the customer, special knowledge of the customer, etc.
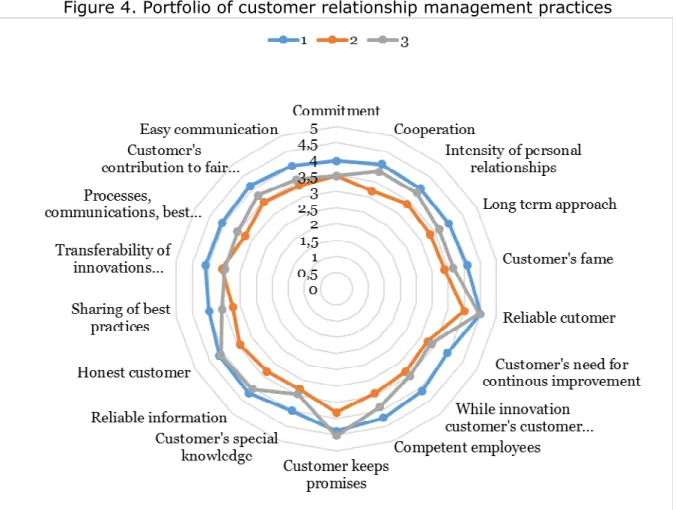
Figure 4. Portfolio of customer relationship management practices
Source: using data of Competitiveness Research Centre’s database (2013), based on own calculation in SPSS
After performing the cluster analysis, three groups stand out quite clearly. The first group (marked as blue) evaluates the strongest relationships with its customer compared to the other two groups; the highest score is related to reliability and honesty of the customer, but also cooperation and competency of the employees appear to have key importance. The second group (marked as orange) has the lightest connection to its customer, however reliability and trustworthiness of the customer achieved the highest scores in this type of relationship management. Less important is the easy communication and the customer’s special knowledge. The third group (marked as grey) is between the other two groups in terms of all the parameters. This group seems to be a “transitional” one evaluating its customer relationship less committed than the first group, but more complex than the second group.
Generally we can say that all the examined relationship characteristics seem to be more balanced in importance for this customer relationship management type.
Triadic level analysis
Comparing the vertical supply triad (supplier – focal firm – customer relationships’) we can conclude that credibility of the business partners is one of the most important elements considering both relationship types of the focal company. This element achieved highest score in the sample in case of focal firms with strong network level expectations.
We can also observe that customer long term relationships seems to be more balanced comparing to long term relationships with suppliers, commitment of the focal company seem to be higher in connection with customer. On the supplier side RSIs have relatively less importance.
Conclusions
In our research we examined long term relationships of Hungarian firms based on the Competitiveness Research Centre database. Our goal was to compare these long terms relationships with the existing literature and the traditional competitive or cooperative relationships with more complex coopetitive types. According to our findings we can conclude that the classical models are mixed in practice and this open way for a relatively new phenomenon, the coopetitive type of relationship management.
For further research several possibilities seem to be interesting. One of them is to re-run the same questionnaire and to examine the new thinking of the Hungarian companies in the past three or four years. Also it might spread the whole research for different countries and analyse whether geographically potential difference exists. Finally, another direction would be to analyse the relationships interviewing all actors of the triads, supplier, focal company and customer in order to get to the bottom of their existing relationship.
References
Bensaou, M. (1999). Portfolios of Buyer-Supplier Relationships. (Cover story).
Sloan Management Review, 40 (4), 35.
Csesznák, A., & Wimmer Á. (2014). Vállalati jellemzők és összefüggéseik – A
„Versenyben a világgal” kutatási program 2013. évi felmérésében résztvevő vállalatok jellemzése. Versenyképesség könyvsorozat, 1. kötet. Budapest: BCE Vállalatgazdaságtan Intézet, Versenyképesség Kutató Központ.
Choi, T. Y., & Wu, Z. (2009). Taking the leap from dyads to triads: Buyer- supplier relationships in supply networks. Journal of Purchasing and Supply Management, (15), 263.
Gelei, A. (2012). Capability-based value creation in Hungarian automotive supply chains. The IMP Journal, (2), 135. Retrieved from
http://citeseerx.ist.psu.edu/viewdoc/download?doi=10.1.1.655.6156&rep=rep 1&type=pdf#page=13 [31.12.2016].
Håkansson, H., & Shenota, I. (1995). Developing Relationships in Business Networks. First edition. London: Routledge.
Håkansson, H., & Ford, D. (2002). How should companies interact in business networks? Journal of Business Research, 55 (2), 133-139.
Li, M., & Choi, T. Y. (2009). Triads in services outsourcing: Bridge, bridge decay and bridge transfer. Journal of Supply Chain Management, 45 (3), 27.
Mandják, T., & Durrieu, F. (2000). Understanding the non-economic value of business relationships. In 16th IMP Conference (pp. 7-9). Retrieved from http://impgroup.org/uploads/papers/89.pdf [31.12.2016].
Nunnally, J. C., & Bernstein, I. H. (1994). Psychometric Theory. Third edition.
New York: McGraw-Hill.
Ulaga, W., & Eggert, A. (2005). Relationship value in business markets: the construct and its dimensions. Journal of Business-to-business Marketing, 12 (1), 73-99.