Andrea Tabi
Temporal discounting in social clusters on the basis of stated preferences
Introduction
Samuelson’s discounted utility (DU) model was introduced in 1937 and applied for policies (e.g. Cost-Benefit Analysis) until recent times and generally accepted as a model which can describe actual intertemporal behavior representing it in one parameter (social discount rate, SDR). But over the last decades a lot of empirical research (Loewenstein and Prelec, 1992; Chapman, Lazaro et al., 2002) have documented anomalies in intertemporal choices. The most important discovery is that the discount rates are not constant over time, but are decreasing and seem to follow a hyperbolic curve. In addition, there are several observed anomalies in responses (Loewenstein and Prelec, 1992), namely: (1) sign effect (gains are discounted more than losses); (2) magnitude effect (small amounts are discounted more than large amounts); (3) delay/speedup asymmetry (greater discounting is shown to avoid delay of a good than to expedite its receipt); (4) improving sequences (in choices over sequences of outcomes, improving sequences are often preferred to declining sequences though positive time preference dictates the opposite); (5) violations of independence and preference for spread (in choices over sequences, violations of independence are pervasive, and people seem to prefer spreading consumption over time). Beyond those anomalies, time effect (inverse relationship between time horizon and discount rates) and domain effects (different discount rates are used for different goods, e.g. money, health) can be observed in case of long-term stated time preferences (Chapman, 1996).
Chapman (2001), Lazaro et al. (2002), Hendrickx and Nicolaij (2004), Berndsen and Pligt (2001) conducted their studies on students and revealed their time preferences on various topics. Lazaro et al. (2002) found that stated preferences do not correspond with the behavior predicted by the axioms of Samuelson’s discounted utility model and their results also underpin the assumptions of time effect, magnitude effect and delay/speed-up asymmetry in social intertemporal decisions.
Chapman (2001) has undertaken 3 experiments among a sample of students and studied the difference between intergenerational and intragenerational discounting behavior. Despite the assumption that the intergenerational discount rates should be lower, empirical research shows similar parameters for both time intervals (Chapman, 2001).
Svenson and Karlsson (1989) as well as Hendrickx and Nicolaij (2004) investigate the connection of temporal discounting and environmental risks.
Hendrickx and Nicolaij (2004) focus on the ethical and loss-relating concerns related to risk evaluation. Svenson and Karlsson (1989) analyze the significance of time horizons and the discounting of negative consequences using a decision theoretic framework. Both empirical studies found that the majority of people did not discount environmental risks.
Our study is based on representative sample of 1000 elements, in contrast to other authors, who have undertaken their studies on samples of students. We consider that students would not represent the actual attitudes of all social clusters, although they would give us proper and accurate answers. Our survey is representative for the Hungarian population regarding gender, age and income.
The questions in the survey aim to measure personal preferences through getting rewards in the future and also try to capture the personal preferences which concern common decisions mainly through allocation of common costs over time. We also attempt to reveal the long term intergenerational time preferences through saving lives and the last type of question investigates the willingness to pay (WTP) of people about the future costs of climate change.
Methods
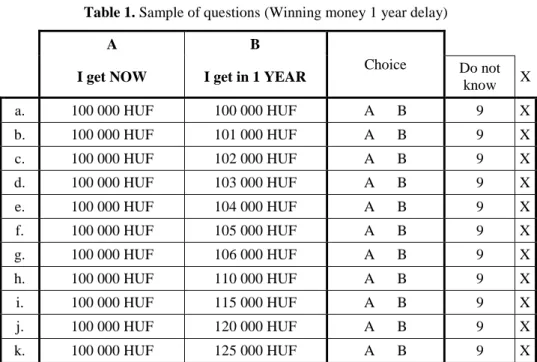
As described above, each questionnaire consists of 4 types of questions and each question type contains 11 pairs of 2 alternatives which arranged on an ordinal scale. Thus, it is possible to investigate respondents’ “switching point”
where they switch from alternative “A” to alternative “B”. For example, the first type of question assumes a hypothetical situation, where the respondent wins a certain amount of money, and has to decide when he/she wants to receive it.
Alternative “A” involves receiving 100 000 HUF immediately while alternative
“B” involves receiving a bigger amount 1 year later (see Table 1).
Table 1. Sample of questions (Winning money 1 year delay)
A B
Choice
I get NOW I get in 1 YEAR Do not
know X
a. 100 000 HUF 100 000 HUF A B 9 X
b. 100 000 HUF 101 000 HUF A B 9 X
c. 100 000 HUF 102 000 HUF A B 9 X
d. 100 000 HUF 103 000 HUF A B 9 X
e. 100 000 HUF 104 000 HUF A B 9 X
f. 100 000 HUF 105 000 HUF A B 9 X
g. 100 000 HUF 106 000 HUF A B 9 X
h. 100 000 HUF 110 000 HUF A B 9 X
i. 100 000 HUF 115 000 HUF A B 9 X
j. 100 000 HUF 120 000 HUF A B 9 X
k. 100 000 HUF 125 000 HUF A B 9 X
The second type of question refers to social decisions related to flood protection. The hypothetical situation is the following: “Imagine that the state offers a certain amount of money to villages along the river Tisza, which has to be spent on flood protection. If the subsidy is asked for immediately, the state can offer a lower amount, if you wait 1 or 10 years, villages will get a larger sum, which makes more efficient protection possible (e.g. stronger dams). What is your decision?” The purpose of this question is to reveal people’s attitude to urgent and pressing situations, where it is important to act as soon as possible.
Our assumption is that in such a decision situation, where intervention is urgent, using time preference rates is meaningless or using stated preferences will lead to a paradox exchange: the quicker the intervention should be, the higher the time preference rate, which induces decisions for postponing actions.
The third question type deals with saving lives, using the following hypothetical situation: “Imagine that you have to decide between two programs, which financially support medicine and therapy researches. In case of Program
“A” an already existing treatment is supported, which can save 100 lives immediately. Program “B” supports medicine researches, which could help more than 100 people in 1, 30 or 100 years to stay alive. What is your decision?”
The last group of questions, regarded as the most abstract or hypothetical, deals with the financial consequences of climate change: “Imagine that you have to choose from two options regarding climate costs. Option “A” is that, from now on, you pay a certain amount annually (to cover the costs of climate change), and option “B” involves postponing the costs and paying 1 million HUF (in 10 years) or 10 million Ft (in 30 years), when the catastrophic consequences of climate change occur. What is your decision?”
In all cases, inflation is ignored, 1 HUF now is equal to 1 HUF in the future.
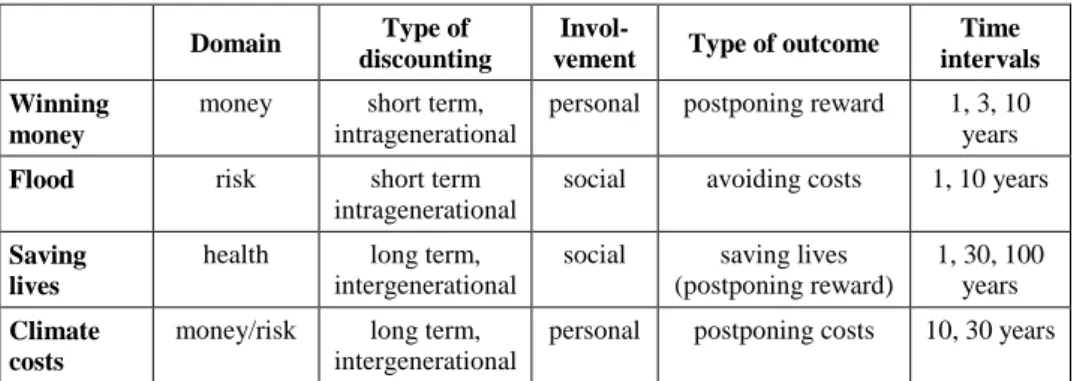
In Table 2 the four types of questions are summarized by temporality, involvement, type of outcome and time horizons.
Table 2. Types of questions Domain Type of
discounting
Invol-
vement Type of outcome Time intervals Winning
money
money short term, intragenerational
personal postponing reward 1, 3, 10 years
Flood risk short term
intragenerational
social avoiding costs 1, 10 years
Saving lives
health long term, intergenerational
social saving lives (postponing reward)
1, 30, 100 years Climate
costs
money/risk long term, intergenerational
personal postponing costs 10, 30 years
Discount rates have been calculated according to the following equation:
,
where n is the number of years implied in the choice. The indifference point is the point where the respondent switches from one alternative to another (Chapman, 2001). The indifference number stands with the last preferred immediate benefit (alternative “A”), before alternative “B” is chosen, e.g. if winning 115 000 HUF in 1 year is preferred to getting 100 000 HUF now, but 100 000 HUF now is preferred to getting 110 000 HUF in 1 year, then the indifference point is 110 000 HUF.
Results
Although 1012 individuals completed the questionnaire, there were missing values and in many cases the results were not appropriate for analysis for different reasons. It often occurred that respondents chose two or more switching points, which are not consistent in an ordinal scale, or they did not switch from one alternative to another. The latter event could happen for several reasons: (1) respondents do not want to discount at all (2) the scale is not wide enough, thus they could not find their indifference point (3) respondents do not understand the situation or (4) they do not want to make a decision. Thus, the inconsistent and unusable replies were coded as “do not know” and excluded from the analysis.
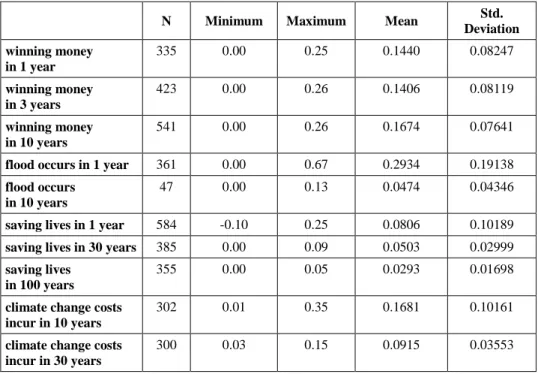
Table 3 shows the number of respondents, the minimum and maximum value of discount rates, their means, and standard deviations by question types. Time delays are different because of the various topics, and the involvement of the people.
A repeated measures ANOVA was conducted between time delays within each question group. The results of RM ANOVA suggest that the time delays within all question groups significantly differ from each other (Greenhouse- Geisser and Huynh-Feldt tests show p=0.000 significance level), but according to the pairwise comparisons of means by Bonferroni correction in “winning money” the means of time delays 1 and 3 years do not differ statistically (p = 0.546).
In case of ‘Saving lives’ and ‘Climate costs’ scenario, we have long term (intergenerational) discount rates, and we can observe that the rates fall as the delay increases (time effect), and there is a significant difference between the discounting of money and health (domain effect). The high rate for flood in a 1 year delay implies a preference for early intervention and the very low number of responses in favour of a 10 year delay also correspond with findings of other research by Svenson and Karlsson (1989) as well as Hendrickx and Nicolaij (2004), illustrating that the majority of people do not discount environmental risks, where they could be involved personally.
Table 3. Descriptive Statistics
N Minimum Maximum Mean Std.
Deviation winning money
in 1 year
335 0.00 0.25 0.1440 0.08247
winning money in 3 years
423 0.00 0.26 0.1406 0.08119
winning money in 10 years
541 0.00 0.26 0.1674 0.07641
flood occurs in 1 year 361 0.00 0.67 0.2934 0.19138
flood occurs in 10 years
47 0.00 0.13 0.0474 0.04346
saving lives in 1 year 584 -0.10 0.25 0.0806 0.10189 saving lives in 30 years 385 0.00 0.09 0.0503 0.02999 saving lives
in 100 years
355 0.00 0.05 0.0293 0.01698
climate change costs incur in 10 years
302 0.01 0.35 0.1681 0.10161
climate change costs incur in 30 years
300 0.03 0.15 0.0915 0.03553
In our questionnaire, respondents were asked about happiness, life satisfaction, general attitude to the environment (5 questions) and personal data (gender, age, number of children, qualification, net income) as well. The questions about happiness and life satisfaction were measured on a scale from 1 to 10 where 1 means “unhappy/dissatisfied” and 10 means “very happy/very satisfied”. The general attitude questions tried to reveal how people evaluate our environment and what they think should be done to preserve our natural resources for the next generations. Respondents were asked to decide on a 5 grade scale (1 – totally disagree, 5 – totally agree) whether they agree or disagree with the following statements:
1. The state is responsible for preserving our natural resources. (“state”) 2. It is everybody’s right to use natural resources for private purposes. (“pri-
vate”)
3. I believe that technological development and innovations will solve the environmental problems. (“innov”)
4. We should radically change our consumption behavior in order to pre- serve our environment. (“change”)
5. People must ensure that natural resources will be available for the next generations. (“nextgen”).
A one-way ANOVA method was conducted in each question group (winning money, flood, saving lives, climate costs), using discount rates as dependent variables. Independent variables were gender, age, net income, qualification, happiness and attitude questions about environmental problems (Table 4 contains only those variables which have statistically significant results).
No connection could be observed between time discounting and gender:
women and men use the same discount rates. There was absolutely no statistical connection between age, number of children and time discounting behavior.
Table 4. One-way ANOVA for variables (sig. levels)
Income Qualifi- cation
Hap-
piness “State” “Pri-
vate” “Innov” “Change” “Nextgen”
winning money in 1 year
0.288 0.016 0.167 0.002 0.806 0.000 0.000 0.000
winning money in 3 years
0.139 0.001 0.223 0.040 0.384 0.585 0.013 0.000
winning money in 10 years
0.030 0.217 0.017 0.021 0.001 0.052 0.003 0.000
flood occurs in
1 year 0.144 0.903 0.097 0.878 0.684 0.000 0.022 0.187
flood occurs in
10 years 0.420 0.042 0.069 0.384 0.397 0.186 0.282 0.225
saving lives
in 1 year 0.236 0.095 0.055 0.003 0.011 0.001 0.007 0.000 saving lives
in 30 years 0.031 0.005 0.038 0.269 0.175 0.087 0.000 0.000 saving lives
in 100 years 0.046 0.503 0.209 0.175 0.158 0.256 0.039 0.000 climate
change costs incur in 10 years
0.030 0.268 0.123 0.908 0.414 0.351 0.015 0.287
climate change costs incur in 30 years
0.167 0.049 0.056 0.930 0.713 0.483 0.007 0.045
In cases of net income, qualification and happiness we can observe a very weak connection with time preference rates, but the strongest relationships are apparent when we look at the attitude questions, especially „change” and
„nextgen”.
In order to reveal the correlations between the variables and be able to cluster our sample, principle components analysis was conducted on all variables. The varimax rotation resulted in six factors, which explained 72.18 % of variance (number of factors selected by Mineigen criterion). Factor 1 consists of qualification and net income (income factor), Factor 2 includes happiness and life satisfaction (happiness factor), Factor 3 contains 2 attitude questions:
“change” and “nextgen” (change factor), Factor 4 consists of the other 3 attitude questions: “state”, “private” and “innov” (state factor), Factor 5 includes age and the number of children (age factor) and finally, Factor 6 contains gender (gender factor). A two-step cluster analysis was carried out on the 1012- element-representative sample, based on 4 factors: income, change, state and happiness (gender and age factors were excluded because as a result of the one- way ANOVA analysis they do not have any relationship with time discounting behavior). Three clusters were identified.
Table 5 shows the one-way ANOVA results which tested the connection between the identified clusters and discount rates. Thus, we have identified social clusters, where significantly different time discounting behavior is noticeable in two domains: winning money and saving lives. In these two domains the mean of discount rates are increasing in the order of cluster 1, cluster 3, and cluster 2. The main difference between clusters is along the change and state factors, which describe people’s attitude to environmental problems. The happiness factor has the lowest influence and the income factor had a moderate effect on clustering.
Table 5. One-way ANOVA for clusters
Mean 1 2 3 Total Sig.
winning money
in 1 year 0.1044 0.1785 0.1496 0.1440 0.000
winning money
in 3 years 0.1091 0.1572 0.1481 0.1399 0.000
winning money
in 10 years 0.1299 0.1769 0.1737 0.1634 0.000
flood occurs
in 1 year 0.2862 0.3046 0.3235 0.3057 0.449
flood occurs
in 10 years 0.0564 0.0367 0.0650 0.0546 0.501
saving lives
in 1 year 0.0538 0.0952 0.0922 0.0816 0.003
saving lives
in 30 years 0.0371 0.0600 0.0529 0.0508 0.000
saving lives
in 100 years 0.0227 0.0337 0.0330 0.0300 0.000
climate change costs incur in 10 years
0.1747 0.1400 0.1693 0.1606 0.075
climate change costs incur in 30 years
0.0943 0.0843 0.0895 0.0890 0.267
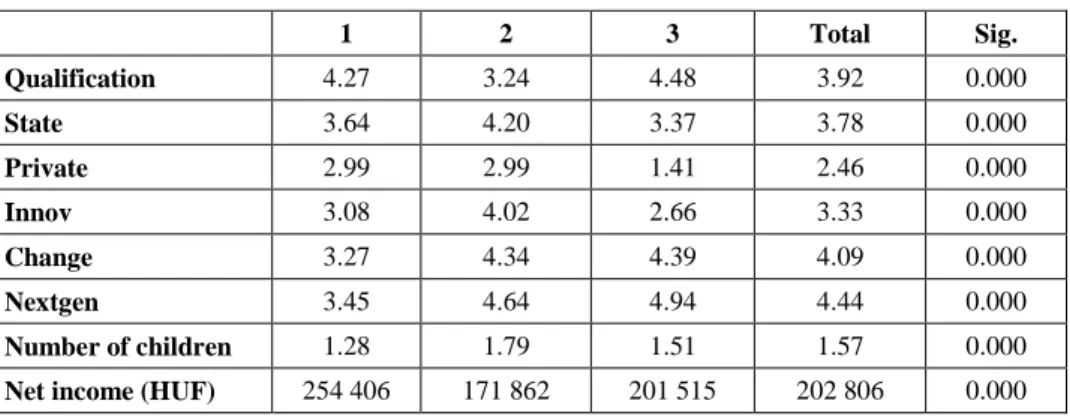
Table 6 shows the mean values of variables for the three clusters, where statistically significant differences were found. Cluster 1 contains people, who are typically in the highest income category, have the lowest number of children and their main feature is to have been largely undecided on the attitude questions, usually choosing the value of 3, which is the medium value between agree and disagree. Cluster 2 is regarded as the least well-paid category with the lowest qualification (skilled workers without high school graduation), but they usually agreed with the statements regarding environmental attitudes. Cluster 3 is the mixture of cluster 1 and 2, but the most remarkable observation is that these people usually agreed with the exploitation of nature for private purposes.
Table 6. Means by clusters
1 2 3 Total Sig.
Qualification 4.27 3.24 4.48 3.92 0.000
State 3.64 4.20 3.37 3.78 0.000
Private 2.99 2.99 1.41 2.46 0.000
Innov 3.08 4.02 2.66 3.33 0.000
Change 3.27 4.34 4.39 4.09 0.000
Nextgen 3.45 4.64 4.94 4.44 0.000
Number of children 1.28 1.79 1.51 1.57 0.000
Net income (HUF) 254 406 171 862 201 515 202 806 0.000
Conclusions
The paper contrasted temporal discounting in individual and social exchanges.
The temporal exchange of different domains like money, lives and environmental risks have been analyzed for different time horizons.
The primary aim of the study was to reveal the time discounting behavior of people and cluster them, based on their attributes and attitudes to environmental problems. For the purposes of the research, a 1000-element representative sample has been used. Although we dispose of a huge sample, only approximately one-third of respondents provided consistent, analyzable answers to the time preference questions. This points out how difficult it would be to design policies on the basis of people’s opinion regarding long-term programs or projects.
It is clear that we cannot use the same rates over time or across different domains. The observed methodology of calculating social discount rates consists of two main parts. The first part is called pure time preference rate (p), which describes the attitude of people to next generations’ welfare. The second part makes next generations’ welfare equal with current generation’s welfare.
This part is calculated from the product of two parameters; elasticity of marginal utility of consumption (e) and the growth rate of per capita real consumption (g) (Evans and Sezer, 2005). There are several methods for the calculation of each parameter, but most prevalent is the tax-based (mostly income tax) method for the elasticity of marginal utility of consumption (Evans, 2005) and the use of GDP as a growth rate. Our study revealed that time
discounting behavior has no connection with gender, age and is also very weakly connected with qualification, happiness and life satisfaction.
Regarding time discounting patterns, the strongest relationship after clustering was discovered between income levels and the five attitude questions towards the environment. Accordingly, it seems acceptable to reckon observed preferences on the basis of income levels (income taxes) and people’s attitude to next generations, which literally corresponds with the meaning of pure time preference rate (p). This rate is calculated based on the number of deaths relative to the population (this rate is called “Changing Life Chance” by Pearce and Ulph, (1995)) and is used in many countries to compute SDR for Cost- Benefit Analysis. The argument for using the death rate as the expression of people’s attitude is absolutely refuted by our results. The ageing has no connection with discounting behavior, elderly people discount the same way as young people do. So, it can be concluded that the income level influences our discounting patterns which has to be considered in an SDR model and can be calculated top-down, but the calculation of pure time preference rates should be based on the interpretation of real stated preferences.
References
BERNDSEN, M., PILGT, J. (2001): Time is on my side: Optimism in intertemporal choice. Acta Psychologica 108 (2001), pp. 173–186.
CHAPMAN, G. B. (1996): Temporal discounting and utility for health and money (Journal of Experimental Psychology: Learning, Memory and Cognition, 22, pp. 771–791.
CHAPMAN, G. B. (2001): Time preferences for the very long term. Acta Psychologica 108 (2001), pp. 95–116.
EVANS, D. J. AND SEZER, H. (2005): 'Social discount rates for member countries of the European Union', Journal of Economic Studies, vol. 32, no. 1, pp. 47-59.
EVANS, DAVID J. (2005): The Elasticity of Marginal Utility of Consumption: Estimates for 20 OECD Countries. FISCAL STUDIES, vol. 26, no. 2, pp. 197–224.
FREDERICK, S., LOEWENSTEIN, G. AND O’DONOGHUE, T. (2002):
Time Discounting and Time Preference: A Critical Review. Journal of Economic Literature, XL, pp. 351–401.
HENDRICKX, L., NICOLAIJ, S. (2004): Temporal discounting and environmental risks: The role of ethical and loss-related concerns. Journal of Environmental Psychology 24 (2004), pp. 409–422.
LAZARO, A., BARBERAN, R., RUBIO, E. (2002): The discounted utility model and social preferences: Some alternative formulations to conventional discounting. Journal of Economic Psychology 23 (2002), pp. 317–337.
LOEWENSTEIN, G., PRELEC, D. (1992): Anomalies in intertemporal choice: Evidence and an interpretation, Quart. J. Econ. 107, 573]398_1992.
PEARCE, D., ULPH, D. (1995): A social discount rate for the United Kingdom. Centre for Social and Economic Research on the Global Environment (CSERGE). Working Paper GEC 95-01, London.
SAMUELSON, P. A. (1937): A note on measurement of utility. Review of Economic Studies, 4 (2), pp. 155–161
SVENSON, O., KARLSSON, G. (1989): Decision-making, time horizons, and risk in the very long term perspective. Risk Analysis, 9, pp. 385–399.