SPATIAL AND TEMPORAL PATTERNS OF TRUE BUG ASSEMBLAGES EXTRACTED WITH BERLESE FUNNELS
(DATA TO THE KNOWLEDGE ON THE GROUND-LIVING HETEROPTERA OF HUNGARY, №. 2)
D. RÉDEI1,* – M. GAÁL2 – L. HUFNAGEL2
*e-mail: dredei@freemail.hu
1 Department of Entomology, Faculty of Horticultural Sciences, Szent István University, H-1118 Budapest, Ménesi út 44, Hungary
(phone / fax: +36-1-372-0125)
2 Department of Mathematics and Informatics, Faculty of Horticultural Sciences, Szent István University, H-1118 Budapest, Villányi út 29–33, Hungary
(phone: +36-1-372-6261; fax: +36-1-466-9273)
(Received 21th March 2003; accepted 15th May 2003)
Abstract. A rich material of Heteroptera extracted with Berlese funnels by Dr. I. Loksa between 1953–
1974 in Hungary, has been examined. Altogether 157 true bug species have been identified. The ground- living heteropteran assemblages collected in different plant communities, substrata, phytogeographical provinces and seasons have been compared with multivariate methods. Because of the unequal number of samples, the objects have been standardized with stochastic simulation. There are several true bug species, which have been collected in almost all of the plant communities. However, characteristic ground-living heteropteran assemblages have been found in numerous Hungarian plant community types.
Leaf litter and debris seem to have characteristic bug assemblages. Some differences have also been recognised between the bug fauna of mosses growing on different surfaces. Most of the species have been found in all of the great phytogeographical provinces of Hungary. Most high-dominance species, which have been collected, can be found at the ground-level almost throughout the year. Specimens of many other species have been collected with Berlese funnels in spring, autumn and/or winter. The diversities of the ground-living heteropteran assemblages of the examined objects have also been compared.
Keywords: Heteroptera, ground-level, Berlese funnel, plant community, substratum
Introduction
The majority of terrestrial heteropterans can be collected from plants in great numbers by the usual methods for Heteroptera collecting (sweep-netting, beating etc.).
Collecting bugs from ground-level needs great effort and generally has trifling result compared with collecting from the vegetation. Therefore, the species occurring mostly or exclusively on the ground usually escape the zoologists’ attention. The methods for collecting ground-living invertebrates (pitfall trap, sifting, Berlese funnel etc.) are only occasionally used by heteropterologists. Consequently, our knowledge on the faunistical, ecological, cenological data of species occurring mostly or exclusively on the ground is far poorer than that of species collected regularly in great numbers from the vegetation.
On this account, the authors have examined numerous materials and identified a great number of true bugs collected in Hungary with Berlese funnels and pitfall traps.
The present work – which is the second part of a series of publications – deals with the true bugs collected with Berlese funnels over 20 years in Hungary. Because of the
identical way of collecting, the samples can be well compared on the basis of the true bugs found in them. In present paper the ground-living bug assemblages inhabiting different substrata and plant communities, occurring in different parts of Hungary and in different seasons are compared.
Review of literature
The literature on the subject has been surveyed in the first part of this series of publications [5].
Materials and methods
The material examined and identification of species
The investigations have been carried out on the rich ground-living animal material collected by the staff of the Department of Systematic Zoology and Ecology of Eötvös Loránd University under the guidance of the late Dr. I. Loksa between 1953–1974. The material preserved in vials of 70% methyl alcohol was extracted from different substrata with Berlese funnels. All of the heteropteran specimens of Loksa’s collection have been sorted and identified. Further data on the material examined as well as the works used for the identification has been presented in the first part of this series of publications [5].
Statistical methods
The relative dominance of most of the species studied is very low. Therefore, by the statistical analysis, the species (including the nymphs unidentified at species level as groups) with a relative dominance less than 0.20% have been grouped on the basis of their taxonomical position and body size. It can be presumed that the result of this grouping approaches that of a grouping by the life habits of the species. The species groups created are shown in Table 2.
The following sample parameters (object categories), each being comparable with multivariate methods, have been examined: (1) the plant communities where the samples were taken; (2) the extracted substrata; (3) the great phytogeographical provinces of Hungary where the samples were taken; (4) the seasons in which the samples were taken.
The statistical analyses started from a cenological database in which the rows represented the taxa, the columns the objects, and the cells contained the numbers of the individuals. These tables have to be suitable for the comparison of the objects and for the significance analysis of the differences. Accordingly we used the following methods:
(1) The original Berlese samples were sorted by the parameter examined.
(2) Only thus samples were considered, which have data from all the four parameters (primary data filter).
(3) For every group of the given parameter we examined the combinations with the other three parameters. Only thus combinations were considered, which were present in all of the groups to be compared (secondary data filter).
(4) The numbers of samples have been also standardized: the number of the specimens of each species collected in a given combination has been divided by the number of samples taken in that combination. These standardized values were summed for every group.
(5) As a result of the previous steps, every group was described by only one column, which contained the numbers of the individuals of the different taxa with the same sampling method.
(6) From every column random samples, with the same number of individuals, were taken with an own-developed Excel macro. With the aim of this stochastic simulation (bootstrapping) we can generate arbitrary number of pseudo-replicates.
In this case 10 new objects, each containing 100 (70 in case of the plant communities) heteropteran specimens, have been randomly generated.
(7) The variables have also been standardized with their standard deviation.
To explore the similarity relations of the new objects obtained by stochastic simulation, principal coordinates analysis (metrical multidimensional scaling) has been used based on Euclidean distance:
( )
EUjk xij xik
i
= n −
∑
= 2 1.
There are many samples, where not each of the sample parameters (object categories) examined were recorded by Loksa. Therefore, the method described above has been carried out on two sorts of data: (1) on the data matrix containing all samples (unfiltered data matrix, with looser criteria of comparability, without the steps 2–4); (2) on the data matrix containing only the samples, of which all of the four examined sample parameters (objects) are known (filtered data matrix, with stronger criteria of comparability, steps 1–7). The similarity patterns obtained by the two different methods have been compared in every case.
With two-sided t-test carried out on the coordinates obtained by PCoA of the randomly generated new objects, it can be examined whether the differences between the groups of objects are significant. If two groups of objects differ significantly along whether the horizontal or the vertical axis, their difference is significant. If no difference can be observed along either the horizontal or the vertical axis, their difference along another axis can be significant. This axis generally goes through the averages of the coordinates of the one and the other group of objects.
It is to be noted that data have been processed using numerous multivariate methods, other standardizations, similarity functions, etc., out of which only a few are published in this paper, but all of them have been used to draw the conclusions.
To compare diversity relations, Rényi’s diversity ordering method has been applied.
For the multivariate data analysis the program package SYN-TAX 5.1 [2, 3] has been used. The diversity ordering has been carried out with the program package NuCoSA 1.05 [6, 7, 8].
Results and discussion
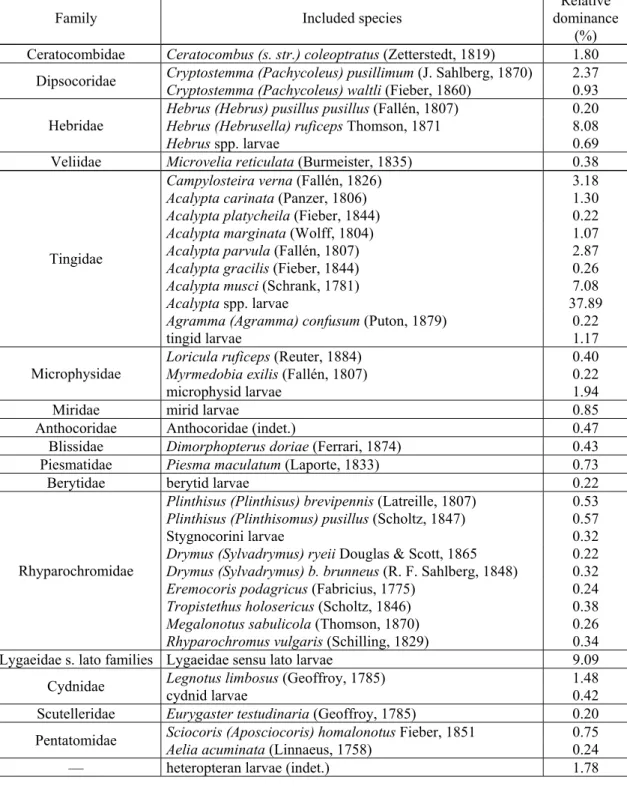
5060 specimens of Heteroptera have been found in the 3657 samples examined. The relative dominance of only 30 species is greater than 0.20% (Table 1).
Table 1. The heteropteran species (at species level unidentified larvae included) with a relative dominance greater than 0.20%.
Family Included species
Relative dominance
(%) Ceratocombidae Ceratocombus (s. str.) coleoptratus (Zetterstedt, 1819) 1.80 Cryptostemma (Pachycoleus) pusillimum (J. Sahlberg, 1870) 2.37 Dipsocoridae Cryptostemma (Pachycoleus) waltli (Fieber, 1860) 0.93 Hebrus (Hebrus) pusillus pusillus (Fallén, 1807) 0.20 Hebrus (Hebrusella) ruficeps Thomson, 1871 8.08 Hebridae
Hebrus spp. larvae 0.69
Veliidae Microvelia reticulata (Burmeister, 1835) 0.38
Campylosteira verna (Fallén, 1826) 3.18
Acalypta carinata (Panzer, 1806) 1.30
Acalypta platycheila (Fieber, 1844) 0.22
Acalypta marginata (Wolff, 1804) 1.07
Acalypta parvula (Fallén, 1807) 2.87
Acalypta gracilis (Fieber, 1844) 0.26
Acalypta musci (Schrank, 1781) 7.08
Acalypta spp. larvae 37.89
Agramma (Agramma) confusum (Puton, 1879) 0.22 Tingidae
tingid larvae 1.17
Loricula ruficeps (Reuter, 1884) 0.40
Myrmedobia exilis (Fallén, 1807) 0.22
Microphysidae
microphysid larvae 1.94
Miridae mirid larvae 0.85
Anthocoridae Anthocoridae (indet.) 0.47
Blissidae Dimorphopterus doriae (Ferrari, 1874) 0.43 Piesmatidae Piesma maculatum (Laporte, 1833) 0.73
Berytidae berytid larvae 0.22
Plinthisus (Plinthisus) brevipennis (Latreille, 1807) 0.53 Plinthisus (Plinthisomus) pusillus (Scholtz, 1847) 0.57
Stygnocorini larvae 0.32
Drymus (Sylvadrymus) ryeii Douglas & Scott, 1865 0.22 Drymus (Sylvadrymus) b. brunneus (R. F. Sahlberg, 1848) 0.32 Eremocoris podagricus (Fabricius, 1775) 0.24 Tropistethus holosericus (Scholtz, 1846) 0.38 Megalonotus sabulicola (Thomson, 1870) 0.26 Rhyparochromidae
Rhyparochromus vulgaris (Schilling, 1829) 0.34 Lygaeidae s. lato families Lygaeidae sensu lato larvae 9.09
Legnotus limbosus (Geoffroy, 1785) 1.48
Cydnidae cydnid larvae 0.42
Scutelleridae Eurygaster testudinaria (Geoffroy, 1785) 0.20 Sciocoris (Aposciocoris) homalonotus Fieber, 1851 0.75 Pentatomidae Aelia acuminata (Linnaeus, 1758) 0.24
— heteropteran larvae (indet.) 1.78
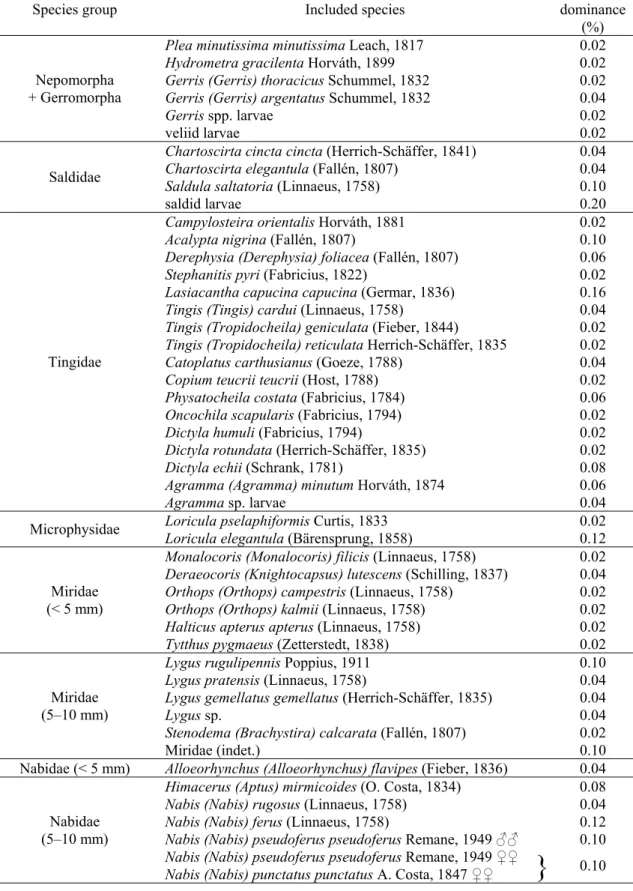
The majority of the species were collected in a very low number (with a relative dominance less than 0.20%). These species have been grouped for the statistical analysis (Table 2).
Table 2. The species groups created by grouping the species (or at species level unidentified larvae) having a low (less than 0.20%) relative dominance based on their taxonomical position and body size.
Species group Included species
Relative dominance
(%) Plea minutissima minutissima Leach, 1817 0.02
Hydrometra gracilenta Horváth, 1899 0.02
Gerris (Gerris) thoracicus Schummel, 1832 0.02 Gerris (Gerris) argentatus Schummel, 1832 0.04
Gerris spp. larvae 0.02
Nepomorpha + Gerromorpha
veliid larvae 0.02
Chartoscirta cincta cincta (Herrich-Schäffer, 1841) 0.04 Chartoscirta elegantula (Fallén, 1807) 0.04
Saldula saltatoria (Linnaeus, 1758) 0.10
Saldidae
saldid larvae 0.20
Campylosteira orientalis Horváth, 1881 0.02
Acalypta nigrina (Fallén, 1807) 0.10
Derephysia (Derephysia) foliacea (Fallén, 1807) 0.06
Stephanitis pyri (Fabricius, 1822) 0.02
Lasiacantha capucina capucina (Germar, 1836) 0.16 Tingis (Tingis) cardui (Linnaeus, 1758) 0.04 Tingis (Tropidocheila) geniculata (Fieber, 1844) 0.02 Tingis (Tropidocheila) reticulata Herrich-Schäffer, 1835 0.02
Catoplatus carthusianus (Goeze, 1788) 0.04
Copium teucrii teucrii (Host, 1788) 0.02
Physatocheila costata (Fabricius, 1784) 0.06 Oncochila scapularis (Fabricius, 1794) 0.02
Dictyla humuli (Fabricius, 1794) 0.02
Dictyla rotundata (Herrich-Schäffer, 1835) 0.02
Dictyla echii (Schrank, 1781) 0.08
Agramma (Agramma) minutum Horváth, 1874 0.06 Tingidae
Agramma sp. larvae 0.04
Loricula pselaphiformis Curtis, 1833 0.02
Microphysidae Loricula elegantula (Bärensprung, 1858) 0.12 Monalocoris (Monalocoris) filicis (Linnaeus, 1758) 0.02 Deraeocoris (Knightocapsus) lutescens (Schilling, 1837) 0.04 Orthops (Orthops) campestris (Linnaeus, 1758) 0.02 Orthops (Orthops) kalmii (Linnaeus, 1758) 0.02 Halticus apterus apterus (Linnaeus, 1758) 0.02 Miridae
(< 5 mm)
Tytthus pygmaeus (Zetterstedt, 1838) 0.02
Lygus rugulipennis Poppius, 1911 0.10
Lygus pratensis (Linnaeus, 1758) 0.04
Lygus gemellatus gemellatus (Herrich-Schäffer, 1835) 0.04
Lygus sp. 0.04
Stenodema (Brachystira) calcarata (Fallén, 1807) 0.02 Miridae
(5–10 mm)
Miridae (indet.) 0.10
Nabidae (< 5 mm) Alloeorhynchus (Alloeorhynchus) flavipes (Fieber, 1836) 0.04 Himacerus (Aptus) mirmicoides (O. Costa, 1834) 0.08 Nabis (Nabis) rugosus (Linnaeus, 1758) 0.04
Nabis (Nabis) ferus (Linnaeus, 1758) 0.12
Nabis (Nabis) pseudoferus pseudoferus Remane, 1949 ♂♂ 0.10 Nabidae
(5–10 mm)
Nabis (Nabis) pseudoferus pseudoferus Remane, 1949 ♀♀
Nabis (Nabis) punctatus punctatus A. Costa, 1847 ♀♀
}
0.10Table 2 (continued).
Species group Included species
Relative dominance
(%)
Phymata crassipes (Fabricius, 1775) 0.02
Reduviidae reduviid larvae 0.08
Aradus cinnamomeus Panzer, 1806 0.04
Aradus distinctus Fieber, 1860 0.04
Aneurus (Aneurodes) avenius (Dufour, 1833) 0.02 Aneurus (Aneurus) laevis (Fabricius, 1775) 0.02 Aradidae
aradid larvae 0.06
Piesma capitatum (Wolff, 1804) 0.08
Parapiesma quadratum (Fieber, 1844) 0.06
Parapiesma silenes (Horváth, 1888) 0.04
Parapiesma salsolae (Becker, 1867) 0.16
Parapiesma kochiae (Becker, 1867) 0.14
Piesmatidae
Parapiesma sp. 0.02
Berytinus (Berytinus) minor minor (Herrich-Schäffer, 1835) 0.02 Berytinus (Lizinus) signoreti (Fieber, 1859) 0.02 Berytinus (Lizinus) montivagus (Meyer-Dür, 1841) 0.12 Berytinus (Lizinus) geniculatus (Horváth, 1885) 0.02 Berytidae
Berytinus (Lizinus) sp. 0.02
Horvathiolus superbus (Pollich, 1781) 0.02
Lygaeosoma sardeum sardeum Spinola, 1837 0.02 Lygaeidae s. str.
Nysius senecionis senecionis (Schilling, 1829) 0.04
Cymus glandicolor Hahn, 1832 0.02
Cymus aurescens Distant, 1883 0.06
Cymidae
Cymus sp. 0.16
Blissidae Dimorphopterus spinolae (Signoret, 1857) 0.16 Geocoridae Geocoris (Geocoris) ater (Fabricius, 1787) 0.04 Heterogastridae Platyplax salviae (Schilling, 1829) 0.02 Oxycarenus (Oxycarenus) modestus (Fallén, 1829) 0.02
Macroplax preyssleri (Fieber, 1837) 0.20
Macroplax fasciata fasciata (Herrich-Schäffer, 1835) 0.02
Metopoplax origani (Kolenati, 1845) 0.12
Camptotelus lineolatus lineolatus (Schilling, 1829) 0.02 Oxycarenidae
Tropidophlebia costalis (Herrich-Schäffer, 1850) 0.04 Plinthisus (Plinthisus) longicollis Fieber, 1861 0.12
Plinthisus sp. 0.02
Plinthisus spp. larvae 0.14
Stygnocoris sabulosus (Schilling, 1829) 0.12 Stygnocoris pygmaeus (R. F. Sahlberg, 1848) 0.16 Acompus pallipes (Herrich-Schäffer, 1834) 0.02 Drymus (Sylvadrymus) sylvaticus (Fabricius, 1775) 0.08
Scolopostethus thomsoni Reuter, 1875 0.10
Scolopostethus affinis (Schilling, 1829) 0.10 Scolopostethus puberulus Horváth, 1887 0.04 Scolopostethus pilosus pilosus Reuter, 1875 0.12
Ischnocoris punctulatus Fieber, 1861 0.06
Ischnocoris hemipterus (Schilling, 1829) 0.10
Pionosomus opacellus Horváth, 1895 0.06
Trapezonotus (Trapezonotus) a. arenarius (Linnaeus, 1758) 0.12 Trapezonotus (Trapezonotus) dispar Stål, 1872 0.02 Megalonotus chiragra (Fabricius, 1794) 0.08 Megalonotus antennatus (Schilling, 1829) 0.04 Rhyparochromidae
(< 5 mm)
Megalonotus praetextatus (Herrich-Schäffer, 1835) 0.04
Table 2 (continued).
Species group Included species
Relative dominance
(%)
Eremocoris plebejus (Fallén, 1807) 0.02
Emblethis verbasci (Fabricius, 1803) 0.04
Emblethis griseus (Wolff, 1802) 0.04
Emblethis denticollis Horváth, 1878 0.04
Emblethis ciliatus Horváth, 1875 0.06
Aphanus rolandri (Linnaeus, 1758) 0.02
Peritrechus geniculatus (Hahn, 1832) 0.02
Peritrechus gracilicornis Puton, 1877 0.08
Peritrechus nubilus (Fallén, 1807) 0.04
Beosus maritimus (Scopoli, 1763) 0.04
Graptopeltus lynceus (Fabricius, 1775) 0.08
Raglius alboacuminatus (Goeze, 1778) 0.02
Rhyparochromus pini (Linnaeus, 1758) 0.02
Rhyparochromidae (5–10 mm)
Pachybrachius fracticollis (Schilling, 1829) 0.10
Pyrrhocoris apterus (Linnaeus, 1758) 0.04
Pyrrhocoridae Pyrrhocoris marginatus (Kolenati, 1845) 0.02 Stenocephalidae Dicranocephalus spp. larvae 0.02
Spathocera obscura (Germar, 1842) 0.04
Bathysolen nubilus (Fallén, 1807) 0.04
Coriomeris denticulatus (Scopoli, 1763) 0.04 Coreidae
(5–10 mm)
coreid larvae 0.04
Coreus marginatus (Linnaeus, 1758) 0.10
Coreidae
(> 10 mm) Ceraleptus gracilicornis (Herrich-Schäffer, 1835) 0.02 Rhopalus (Rhopalus) subrufus (Gmelin, 1788) 0.02 Rhopalidae Brachycarenus tigrinus (Schilling, 1817) 0.08
Microporus nigritus (Fabricius, 1794) 0.04
Cydnidae (< 5 mm)
+ Thyreocoridae Thyreocoris scarabaeoides (Linnaeus, 1758) 0.16
Cydnus aterrimus (Forster, 1771) 0.02
Tritomegas bicolor (Linnaeus, 1758) 0.04
Cydnidae
(5–10 mm) Adomerus biguttatus (Linnaeus, 1758) 0.02
Odontoscelis spp. larvae 0.04
Scutelleridae
(5–10 mm) scutellerid larvae 0.02
Eurygaster austriaca (Schrank, 1776) 0.12
Scutelleridae
(> 10 mm) Eurygaster maura (Linnaeus, 1758) 0.12
Podops inuncta (Fabricius, 1775) 0.02
Sciocoris (Sciocoris) cursitans (Fabricius, 1794) 0.08 Sciocoris (Aposciocoris) microphthalmus Flor, 1860 0.02 Dyroderes umbraculatus (Fabricius, 1775) 0.02 Neottiglossa leporina (Herrich-Schäffer, 1830) 0.02
Eusarcoris aeneus (Scopoli, 1763) 0.02
Eurydema ventrale Kolenati, 1846 0.02
Eurydema oleraceum (Linnaeus, 1758) 0.04
Pentatomidae (< 10 mm)
pentatomid larvae 0.16
Aelia rostrata Boheman, 1852 0.02
Dolycoris baccarum (Linnaeus, 1758) 0.02
Pentatomidae
(> 10 mm) Palomena prasina (Linnaeus, 1758) 0.02 Acanthosomatidae Elasmucha grisea (Linnaeus, 1758) 0.02
The ground-living heteropteran assemblages of different plant communities The material
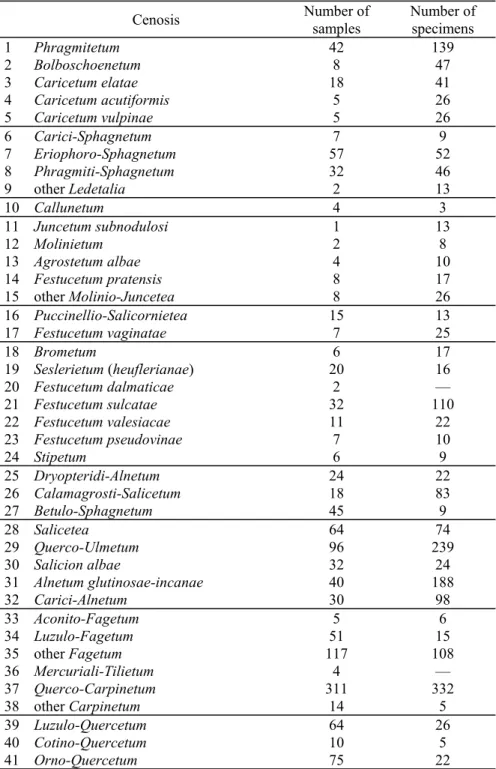
Loksa collected samples in numerous plant communities in Hungary (Table 3). To examine their similarity, the cenoses have to be pooled into cenosis groups because of the limited number of samples. The groups created are shown in Table 4.
Table 3. The number of the samples taken in the different plant communities and community groups and the number of heteropteran specimens found in the samples.
Cenosis Number of samples
Number of specimens
1 Phragmitetum 42 139
2 Bolboschoenetum 8 47
3 Caricetum elatae 18 41
4 Caricetum acutiformis 5 26
5 Caricetum vulpinae 5 26
6 Carici-Sphagnetum 7 9
7 Eriophoro-Sphagnetum 57 52
8 Phragmiti-Sphagnetum 32 46
9 other Ledetalia 2 13
10 Callunetum 4 3
11 Juncetum subnodulosi 1 13
12 Molinietum 2 8
13 Agrostetum albae 4 10
14 Festucetum pratensis 8 17
15 other Molinio-Juncetea 8 26
16 Puccinellio-Salicornietea 15 13
17 Festucetum vaginatae 7 25
18 Brometum 6 17
19 Seslerietum (heuflerianae) 20 16
20 Festucetum dalmaticae 2 —
21 Festucetum sulcatae 32 110
22 Festucetum valesiacae 11 22
23 Festucetum pseudovinae 7 10
24 Stipetum 6 9
25 Dryopteridi-Alnetum 24 22
26 Calamagrosti-Salicetum 18 83
27 Betulo-Sphagnetum 45 9
28 Salicetea 64 74
29 Querco-Ulmetum 96 239
30 Salicion albae 32 24
31 Alnetum glutinosae-incanae 40 188
32 Carici-Alnetum 30 98
33 Aconito-Fagetum 5 6
34 Luzulo-Fagetum 51 15
35 other Fagetum 117 108
36 Mercuriali-Tilietum 4 —
37 Querco-Carpinetum 311 332
38 other Carpinetum 14 5
39 Luzulo-Quercetum 64 26
40 Cotino-Quercetum 10 5
41 Orno-Quercetum 75 22
Table 3 (continued).
Cenosis Number of
samples Number of specimens
42 Quercetum petraeae-cerris 246 151
43 Ceraso-Quercetum 40 426
44 Festuco-Quercetum 31 18
45 Spiraeetum mediae 30 72
46 Tilio-Fraxinetum 91 125
47 Aceri (tatarico)-Quercetum 3 —
48 Corno-Quercetum 36 18
49 Convallario-Quercetum 5 3
50 Robinietea 58 52
51 Pinetea + Piceetea 96 83
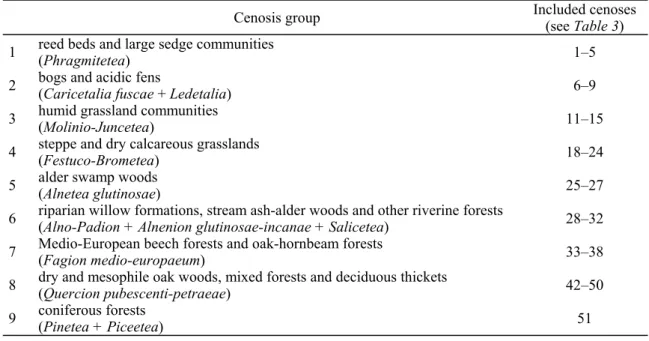
Table 4. The groups of cenoses created from the associations investigated by Loksa.
Cenosis group Included cenoses (see Table 3)
1 reed beds and large sedge communities
(Phragmitetea) 1–5
2 bogs and acidic fens
(Caricetalia fuscae + Ledetalia) 6–9
3 humid grassland communities
(Molinio-Juncetea) 11–15
4 steppe and dry calcareous grasslands
(Festuco-Brometea) 18–24
5 alder swamp woods
(Alnetea glutinosae) 25–27
6 riparian willow formations, stream ash-alder woods and other riverine forests
(Alno-Padion + Alnenion glutinosae-incanae + Salicetea) 28–32 7 Medio-European beech forests and oak-hornbeam forests
(Fagion medio-europaeum) 33–38
8 dry and mesophile oak woods, mixed forests and deciduous thickets
(Quercion pubescenti-petraeae) 42–50
9 coniferous forests
(Pinetea + Piceetea) 51
If we examine the data matrix containing only the samples, of which all the four sample parameters (object categories) examined are known, not all of the plant community groups mentioned before can be compared because of the limited number of samples. Therefore, other groups of cenoses have to be created (Table 5).
Table 5. The number of the samples taken in different groups of cenoses obtained from filtered data matrix (see in text) and the number of heteropteran specimens found in this samples.
Cenosis group Included cenoses
(see Table 3) Number of
samples Number of specimens 1 humid treeless communities 1–9, 11–15 137 190
2 humid wooded communities 25–32 286 675
3 Medio-European beech forests and oak-hornbeam
forests 33–38 341 425
4 dry and mesophile oak woods, mixed forests and
deciduous thickets 42–50 399 516
The patterns observed
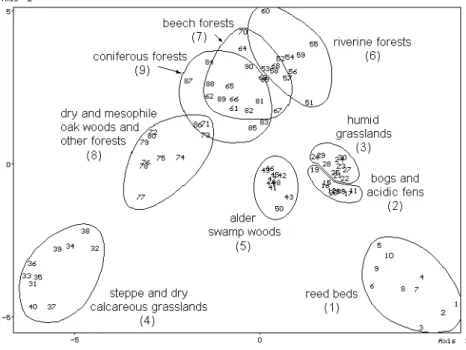
The similarity pattern of the objects obtained from different groups of plant communities of the unfiltered data matrix by stochastic simulation is shown in Fig. 1.
Figure 1. The similarity pattern of the objects obtained from cenosis groups 1–9 (unfiltered data matrix; see Table 4) by stochastic simulation.
With t-test carried out on the coordinates obtained by PCoA of the new objects generated, it can be established that differences between any two cenoses – except that between beech and oak-hornbeam forests (cenosis group 7) and coniferous forests (cenosis group 9) – are significant at least at 0.05 level (Table 6).
Table 6. Comparison of the coordinates obtained by PCoA of the objects obtained by stochastic simulation from cenosis groups 1–9 (unfiltered data matrix; see Table 4) by t-test. In the cells, the upper value means the significance along Axis 1 and the lower value the significance along Axis 2. Significant differences are marked by shaded cells. (*p < 0.05, **p < 0.01)
1 2 3 4 5 6 7 8 9 1 1.00 1.00 4.70·101.12·10-6-7 ** **
1.02·10-5 **
1.95·10-8 **
1.91·10-16 **
1.63·10-1
6.18·10-8 **
2.79·10-14 **
1.34·10-8 **
7.09·10-14 **
1.09·10-10 **
5.73·10-13 **
1.16·10-13 **
2.41·10-10 **
3.97·10-11 **
1.46·10-12 **
2 1.00 1.00 9.73·104.94·10-1-6 ** 8.50·101.86·10-14-6 ** ** 4.75·102.71·10-10-1 ** 1.89·107.97·10-6-9 ** ** 3.74·101.04·10-8-7 ** ** 8.74·103.46·10-1-4 ** ** 1.24·102.46·10-7-7 ** **
3 1.00 1.00 1.94·101.30·10-13-7 ** **
9.98·10-11 **
2.27·10-3 **
1.97·10-6 **
4.23·10-8 **
5.06·10-5 **
8.37·10-7 **
1.48·10-10 **
7.48·10-2
1.60·10-7 **
3.38·10-6 **
4 1.00 1.00 3.87·103.83·10-11-7 ** ** 2.38·103.70·10-14-13 ** ** 3.29·103.03·10-13-12 ** ** 8.69·102.71·10-9-9 ** ** 1.29·109.47·10-11-12 ** **
5 1.00 1.00 4.66·101.39·10-2-9 * **
3.12·10-3 **
3.88·10-8 **
6.50·10-8 **
1.26·10-3 **
5.19·10-4 **
1.20·10-7 **
6 1.00 1.00 2.56·101.08·10-4-1 ** 7.70·107.16·10-10-8 ** ** 4.79·103.25·10-5-3 ** **
7 1.00 1.00 2.99·103.68·10-7-6 ** **
1.39·10-1 1.34·10-1
8 1.00 1.00 2.99·103.68·10-7-6 ** **
9 1.00 1.00
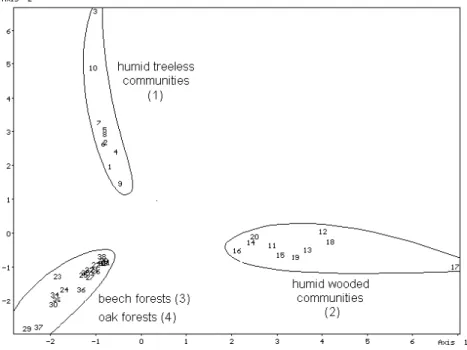
The similarity pattern of the objects obtained from the cenosis groups of the filtered data matrix by stochastic simulation is shown in Fig. 2. The segregation of the humid treeless (cenosis group 1), the humid wooded (cenosis group 2) communities from each other and from the beech and oak woods (cenosis groups 3 and 4) can be observed.
With t-test carried out on the obtained coordinates of the new objects generated, it can be proved that only the difference between beech and oak woods is not significant at 0.05 level (Table 7).
Figure 2. The similarity pattern of the objects obtained from cenosis groups 1–4 (filtered data matrix; see Table 5) by stochastic simulation.
Table 7. Comparison of the coordinates obtained by PCoA of the objects obtained by stochastic simulation from cenosis groups 1–4 (filtered data matrix; see Table 5) by t-test (probabilities).
In the cells, the upper value means the difference along Axis 1 and the lower value the difference along Axis 2. Significant differences are marked by shaded cells.(*p < 0.05,**p <
0.01)
1 2 3 4 1 1.00 1.00 3.40·102.36·10-6-5 ** ** 5.62·101.06·10-3-6 ** ** 1.45·101.03·10-2-6 * **
2 1.00 1.00 2.55·104.59·10-7-4 ** **
3.59·10-7 **
1.29·10-3 **
3 1.00 1.00 6.36·108.54·10-1-1
4 1.00 1.00
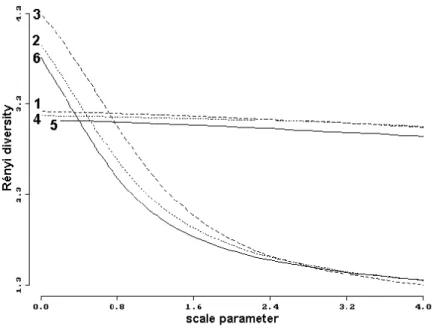
By studying the diversity conditions of samples collected in the six most exhaustively investigated plant communities by Rényi’s method, the diversity profiles shown in Fig. 3 have been obtained. It can be established that at the begin of scale parameter, in the section sensitive to rare species, the diversities of samples extracted from reed beds and large sedge communities, riverine forests and beech forests are
considerably higher than that of bogs and acidic fens, dry grassy communities and dry and mesophile woods. The ground-living true bug assemblages of the three latter community groups have a very low diversity at the great values of scale parameter, in the section sensitive to frequent species, because there is one species in each having a very high dominance. These are the sphagnum bug Hebrus ruficeps (with a relative dominance of 90.08%) in bogs and acidic fens, the Lygaeidae sensu lato larvae (40.32%) in dry grasslands and the larvae of Acalypta spp. (43.40%) in dry and mesophile oak woods, mixed forest and deciduous thickets.
Figure 3. The diversity profiles of the samples taken from different groups of plant communities (Rényi-diversity). The numbers mean the groups of coenoses: 1 = reed beds and large sedge communities, 2 = bogs and acidic fens, 3 = steppe and dry calcareous grasslands, 4 = riparian willow formations, stream ash-alder woods and other riverine forests, 5 = Medio-European beech forests and oak-hornbeam forests, 6 = dry and mesophile oak woods, mixed forests and deciduous thickets.
Discussion of the patterns
The similarity pattern (Fig. 1) obtained from the unfiltered data matrix shows that in some plant communities characteristic ground-living bug assemblages can be found.
Regarding the pattern, it seems to be clear that the variability of the objects through Axis 1 have relation to the humidity and that of through Axis 2 to the wooded or treeless character of the plant communities. By examining the unfiltered data matrix, it can be observed that the pattern obtained is determined mostly by the relations of the three species and species groups having the highest relative dominance: Hebrus ruficeps, larvae of Acalypta spp. and Lygaeidae sensu lato larvae. Each of them can be found in almost all communities, but the relative dominance of Hebrus ruficeps shows increase, that of Lygaeidae sensu lato larvae shows decrease parallel with the increase of the value of Axis 1. On the other hand, the relative dominance of Acalypta spp. larvae shows increase parallel with the increase of the value of Axis 2. Accordingly, Hebrus ruficeps, a semiaquatic bug species, can be found with highest dominance at the ground-level of humid treeless plant communities, Lygaeidae sensu lato larvae in dry treeless and wooded
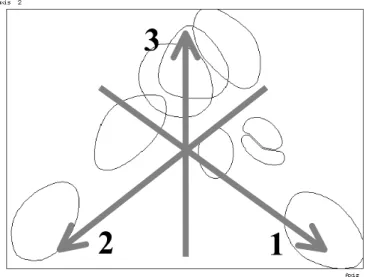
communities and so in the alder swamp woods, and the larvae of Acalypta spp. in wooded cenoses (except the alder swamp woods). Consequently, this three species and species groups determine the triangular shape of the similarity pattern (Fig. 4).
3
2 1
Figure 4. The direction of the increase of relative dominance of the three species and species group with highest dominance on the similarity pattern (Fig. 1). 1 = Hebrus ruficeps, 2 = Lygaeidae sensu lato larvae, 3 = Acalypta spp. larvae.
Regarding the individual plant communities and heteropteran species, it can be established that, in addition to the species and species groups before, in most of the cenoses the species Ceratocombus coleoptratus, Rhyparochromus vulgaris, Aelia acuminata and so the species groups Tingidae, Miridae, Oxycarenidae, Rhyparochromidae and pentatomid adults with a body size of 5–10 mm can be found.
The species belonging to the species groups mentioned before have by all means more or less well-defined habitat preference, but the groups united from various species with diverse preferences can be found in most of the plant communities. Furthermore, the species pooled into groups cannot be examined one by one because of their very low relative dominance.
No frequent species or species group were found to be characteristic of all treeless communities (cenosis groups 1–4). Acalypta carinata and all microphysid species (Loricula ruficeps, Myrmedobia exilis and the group united from the low-dominance species of the family) seem to occur characteristically at the ground-level of dry and humid wooded cenoses (cenosis groups 5–9).
At the ground-level of most of the humid communities regardless of their wooded or treeless character (cenosis groups 1–3, 5, 6), the saldids and cymids occur. The species Acalypta parvula, A. gracilis, Dimorphopterus doriae and Megalonotus sabulicola were found to be characteristic of all dry communities (cenosis groups 4, 7–9).
The following species and species groups seem to occur characteristic in hygrophilous treeless associations (cenosis groups 1–3): Cryptostemma pusillimum, Hebrus pusillus and H. ruficeps, Microvelia reticulata, Agramma confusum and the group Nepomorpha + Gerromorpha. Out of these, Hebrus ruficeps can be found in most of the plant communities. Nevertheless, it can be extracted in these groups of cenoses usually in large numbers, but occurs only sporadically in the others. The segregation of
the ground-living bug assemblages of the reed beds and large sedge communities (cenosis group 1) from that of the other two hygrophilous treeless associations (cenosis groups 2–3) is caused mostly by the occurrence of the aquatic and semiaquatic bugs.
The relative dominance of Hebrus ruficeps was strikingly higher in the former cenosis group than in the latter two groups of cenoses. Furthermore, the species Hebrus pusillus, Microvelia reticulata and the species group Nepomorpha + Gerromorpha were collected only in the former cenosis group.
Usually none or a very limited number of the above-mentioned species occur in dry grasslands (cenosis group 4). The ground-living heteropteran assemblages of this group of plant communities consist of mostly the frequent species occurring in most of the communities and the species, which are characteristic of dry forests. The relative dominance of the Lygaeidae sensu lato larvae is high, too. The species Campylosteira verna, Acalypta musci, Piesma maculatum and the species groups of Nabidae with a size of 5–10 mm and Piesmatidae occur in dry grassy communities as well as in most of the (humid and dry) wooded cenoses, but are to be found in any of the humid treeless communities.
The single species collected mostly in wet forests (cenosis groups 5 and 6) is the seed bug Drymus brunneus. The ground-living heteropteran assemblages of these forests consist of frequent species occurring in most cenoses and species characteristic of all humid plant communities.
The segregation of the ground-living bug communities of the different mesophile, xero-mesophile or xerophile forests (cenosis groups 7–9) seems to have relation with the humidity. The difference between the community of beech and oak-hornbeam forests (cenosis group 7) and that of coniferous forests (cenosis group 9) are not significant at 0.05 level. The seed bug Drymus ryeii occurs in all of these groups of communities. This species seems to be more xerophilous than the other high-dominance species of the genus, D. brunneus.
Comparison of the ground-living heteropteran assemblages of different substrata The material
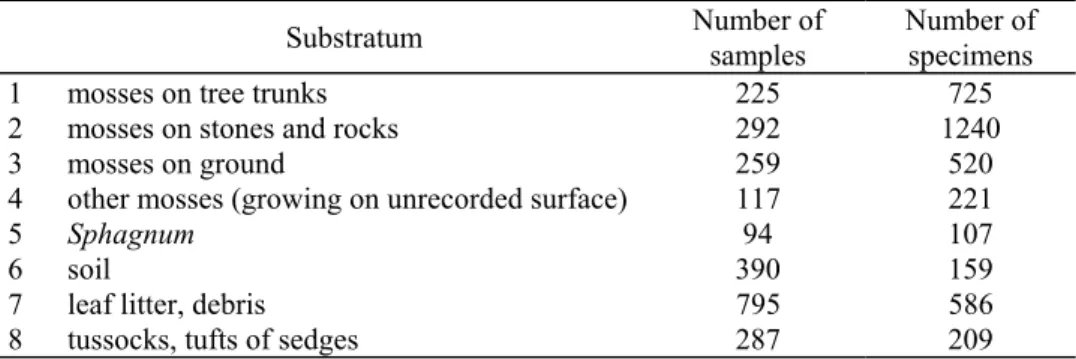
The most important substrata examined are shown in Table 8. Another 1198 samples of other or unrecorded substrata were also extracted.
Table 8. The number of the samples of different substratum categories extracted by Loksa and the number of heteropteran specimens found in these samples.
Substratum Number of samples
Number of specimens
1 mosses on tree trunks 225 725
2 mosses on stones and rocks 292 1240
3 mosses on ground 259 520
4 other mosses (growing on unrecorded surface) 117 221
5 Sphagnum 94 107
6 soil 390 159
7 leaf litter, debris 795 586
8 tussocks, tufts of sedges 287 209
If we examine the data matrix containing only the samples, of which all of the four sample parameters (object categories) examined are known, not all of the substratum
categories mentioned before can be compared because of the limited number of samples. Therefore, new substratum categories have to be created (Table 9).
Table 9. The number of the samples of different substratum categories obtained from filtered data matrix (see in text) and the number of heteropteran specimens found in these samples.
Substratum Number of
samples
Number of specimens 1 tussocks, tufts of sedges 132 133
2 mosses 448 978
3 Sphagnum 66 64
4 soil, leaf litter, debris 539 335
The patterns observed
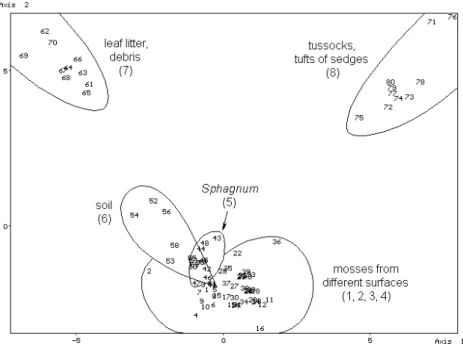
The similarity pattern of the objects obtained from different substrata of the unfiltered data matrix by stochastic simulation is shown in Fig. 5. The different mosses appear very close to each other, therefore their analysis have been performed separately, too (Fig. 6).
Figure 5. The similarity pattern of the objects obtained from substrata 1–8 (unfiltered data matrix; see Table 8) by stochastic simulation.
By studying the similarity relations, it has been established that characteristic ground-living heteropteran communities were segregated in some substrata. The similarity pattern shows that the assemblages extracted from soil and from different mosses including Sphagnum species are highly similar. On the other hand, the assemblages of debris and that of tussocks differ from the assemblages of preceding substrata and from each other, too.
Figure 6. The similarity pattern of the objects obtained from different mosses (unfiltered data matrix; see Table 8) by stochastic simulation.
With t-test carried out on the obtained coordinates of the generated new objects, it can be proved that differences between any two substrata – except from the group of the mosses growing on the ground and that of the „other” (on unrecorded surface growing) mosses – are significant at least at 0.05 level. The above-mentioned two groups of mosses do not differ significantly along either the horizontal or the vertical axis, but their difference is significant along the axis going through the averages of the coordinates of the one and the other group of objects.
Figure 7. The similarity pattern of the objects obtained from substrata 1–4 (filtered data matrix; see Table 9) by stochastic simulation.
The similarity pattern of the objects obtained from different substratum categories of the filtered data matrix by stochastic simulation is shown in Fig. 7. It can be observed that this pattern is substantially identical to that obtained from the unfiltered data matrix (Fig. 5). By examining the data matrix, it can be established that the similarity pattern obtained is determined mostly by the dominance relations of the same species and species groups as the similarity pattern obtained from the unfiltered data matrix. With t- test carried out on the obtained coordinates of the new objects generated, it can be proved that differences between the assemblages living in any substrata are significant at least at 0.05 level.
By studying the diversity conditions of heteropteran communities by Rényi’s method the diversity profiles shown in Fig. 8 have been obtained. It can be established that the diversity of samples extracted from different mosses and from leaf litter are lower than that extracted from soil and from Sphagnum.
Figure 8. The diversity profiles of the samples extracted from different substrata (Rényi- diversity). The numbers mean the substratum types (see in Table 8).
Discussion of the patterns
By examining the unfiltered data matrix, it can be established that the obtained similarity pattern is determined mostly by the dominance relations of the three most dominant species and species groups: Acalypta musci, larvae of Acalypta spp. and Lygaeidae sensu lato larvae. Each of them can be found in almost all of the substrata, but the relative dominance of Acalypta musci is considerably high in coats of different mosses. Also, that of the larvae of Acalypta spp. in the mosses and in/on the soil, and that of Lygaeidae sensu lato larvae in the leaf litter is high. The relative dominance of each of them is low in tussocks.
Regarding the individual heteropteran species, it can be observed that the number of species, which can be found in most of the substrata including soil, is considerably high.
Such species are Hebrus ruficeps, Campylosteira verna, Acalypta carinata, A. parvula, Loricula ruficeps, Piesma maculatum, Plinthisus brevipennis (the relative dominance of
1
2
Figure 9. The direction of the increase of relative dominance of the three most dominant species and species group on the similarity pattern (Fig. 5). 1 = Lygaeidae sensu lato larvae, 2
= Acalypta musci and Acalypta spp. larvae.
P. brevipennis is especially high in leaf litter). In most of the substrata the following species groups can be found: Nabidae with a size of 5–10 mm, Rhyparochromidae with a size of 5–10 mm. A great number of the preceding species and species groups are zoophagous (Hebrus ruficeps, Loricula ruficeps, nabids), whereas another great number feed on mature seeds (most of rhyparochromid adults, maybe Plinthisus brevipennis too, whose life habits are insufficiently known). According to literature data [1], the species of the lace bug genera Campylosteira and Acalypta are phytophagous, living mostly in coats of mosses or on stems of different herbaceous plants. However, many of them were found in leaf litter, or even in/on the soil.
The number of ground-living bug species, which can be found in most of the living or died vegetal substrata but not in soil, is high, too. Such species are: Ceratocombus coleoptratus, Cryptostemma pusillimum, Acalypta platycheila, A. marginata, A. musci, Myrmedobia exilis, Rhyparochromus vulgaris, and the following species groups:
Saldidae, Tingidae (adults and larvae), Miridae with a size of 5–10 mm, mirid larvae, Oxycarenidae. The zoophagous and seed feeder species of the previous taxa (Ceratocombus coleoptratus, Saldidae, Myrmedobia exilis, Rhyparochromus vulgaris) may occur directly on the ground, too. The species of the genus Acalypta are phytophagous, therefore they live mostly on their host plants and occur in different vegetal substrata. Our knowledge on the life habits of Cryptostemma pusillimum is insufficient, but according to our recent data, it is associated with humid vegetal substrata [4].
Most of the dominant species typical in leaf litter and debris belong to the family Rhyparochromidae (Drymus ryeii, D. brunneus, Eremocoris podagricus, Megalonotus sabulicola). In this type of substrata, the relative dominance of the Lygaeidae sensu lato larvae is the highest, whereas that of Acalypta musci and the Acalypta spp. larvae is low.
No species was found to be characteristic of tussocks or tufts of sedges. The relative dominances of the most dominant three species and species groups (Acalypta musci, Acalypta spp. larvae, Lygaeidae sensu lato larvae) are very low in these substrata.
No species was found to be characteristic of Sphagnum, either. Ceratocombus coleoptratus and Hebrus ruficeps have the highest relative dominance in this type of substrata; Cryptostemma pusillimum, the groups Saldidae and Miridae occurs here, too.
The similarity between the ground-living bug assemblage of this type of substratum and that of the other mosses is due to the low relative dominance of the Lygaeidae sensu lato larvae.
Furthermore, any high-dominance species have been proved to be characteristic of coats of different mosses. According to literature data [1], the species of lace bug genera Campylosteira and Acalypta are mostly muscicolous. However, most species of them were collected in a great number from many other substrata, too. More specimens of the Acalypta species were found in mosses than in any other substrata. On the other hand, only 16.2% of the adults of Campylosteira verna were collected from mosses; 61.6% of them were extracted from leaf litter. The following species and species groups can be collected in a great number from coats of different mosses: Campylosteira verna, Acalypta marginata, A. parvula, Loricula ruficeps, Plinthisus pusillus, Rhyparochromus vulgaris, mirids with a size of 5–10 mm, nabids with a size of 5–10 mm, Anthocoridae, pentatomids with a size of 5–10 mm.
Some species prefer a certain moss type. The moss coats growing on stones and rocks are preferred by Acalypta musci, the Acalypta spp. larvae and the Stygnocorini larvae. The mosses growing on tree trunks, on the ground and on other surfaces are preferred by Ceratocombus coleoptratus, both Cryptostemma as well as both Hebrus species and their larvae, the species Acalypta carinata, A. platycheila, Myrmedobia exilis. Furthermore the group obtained from the low-dominance species of Microphysidae, Piesma maculatum and the group obtained from the low-dominance species of Piesmatidae, the Lygaeidae sensu lato larvae and both species groups of rhyparochromid adults are characteristic in this type of substratum.
Differences between the heteropteran communities of the different moss types can be explained by the different circumstances in the coats of mosses. For example, the mosses growing on the ground are usually more humid than on tree trunks, and the mosses growing on stones and rocks are, as a rule, drier than the above mentioned two types. Consequently, a great number of the species preferring humid conditions can be generally found in mosses growing on the ground, on tree trunks, etc., but never in mosses growing on stones and rocks. The seed feeder rhyparochromid species, which move mostly on the ground, can be found usually in the mosses growing on the ground.
Comparison of ground-living heteropteran assemblages collected in different phytogeographical provinces of Hungary
The material
Loksa collected samples in all of the great phytogeographical provinces of Hungary (Table 10). The numbers of samples taken in the provinces Praeillyricum, Praenoricum and in the Arrabonicum district of province Eupannonicum are considerably lower than that of the other provinces. Therefore, only the samples collected in provinces Eupannonicum (except Arrabonicum), Bakonyicum and Matricum have been compared.
Table 10. The number of the samples taken by Loksa in different provinces or districts of Hungary and the number of heteropteran specimens found in this samples.
Provinces (districts) Number of
samples Number of specimens 1 Eupannonicum (except Arrabonicum) 731 1283
2 Bakonyicum 964 1225
3 Matricum 1444 1844
4 Praeillyricum 182 277
5 Eupannonicum (Arrabonicum) 20 12
6 Praenoricum 139 323
The patterns observed
The similarity pattern of the objects obtained from samples of the unfiltered data matrix by stochastic simulation is shown in Fig. 10.
Figure 10. The similarity pattern of the objects obtained by stochastic simulation from samples taken in the phytogeographical provinces 1–3 (unfiltered data matrix; see Table 10).
With t-test carried out on the obtained coordinates of the new objects generated, it can be proved that differences between any two provinces are significant at 0.01 level.
The similarity pattern of the objects obtained from different phytogeographical provinces of the filtered data matrix by stochastic simulation is shown in Fig. 11. It can be observed that this pattern is substantially identical to that obtained from the unfiltered data matrix (Fig. 10). By examining the data matrix, it can be established that the similarity pattern obtained is determined mostly by the dominance relations of the same species and species groups as the similarity pattern obtained from the unfiltered data matrix. With t-test carried out on the obtained coordinates of the new objects generated, it can be proved that the differences between any two provinces are significant at 0.01 level.
Figure 11. The similarity pattern of the objects obtained by stochastic simulation from samples taken in the phytogeographical provinces 1–3 (see Table 10).
By studying the diversity conditions of ground-living heteropteran assemblages by Rényi’s method, the diversity profiles shown in Fig. 12 have been obtained. It can be established that the diversity of the samples collected in the Bakonyicum is higher than that of the samples collected in the Matricum. Furthermore, at the begin of scale
Figure 12. The diversity profiles of the samples taken in different phytogeographical provinces in Hungary (Rényi-diversity). 1 = Eupannonicum (except Arrabonicum), 2 = Bakonyicum, 3 = Matricum.
parameter, in the section sensitive to rare species, the samples collected in the former two provinces are less diverse than the ones collected in the province Eupannonicum.
At the great values of scale parameter, in the section sensitive to frequent species, this relation is just the opposite.
Discussion of the patterns
By examining the unfiltered data matrix, it can be established that the similarity pattern obtained is determined mostly by the dominance relations of the four most dominant species and species groups: Hebrus ruficeps, Acalypta musci, larvae of Acalypta spp. and Lygaeidae sensu lato larvae. The relative dominance of the former three species and species group shows decrease parallel with the increase of the value of Axis 2. The relative dominance of Lygaeidae sensu lato larvae increases parallel with the increase of the value of Axis 1.
1 2
Figure 13. The direction of the increase of relative dominance of the most dominant four species and species group on the similarity pattern (Fig. 10). 1 = Lygaeidae sensu lato larvae, 2
= Hebrus ruficeps, Acalypta musci and Acalypta spp. larvae.
Regarding the individual heteropteran species, it can be observed that the majority of the species were collected in all of the three examined provinces of Hungary. The species Agramma confusum, Dimorphopterus spinolae and the families Piesmatidae, Cymidae and Geocoridae were found mostly in lowlands (province Eupannonicum).
The following ones were collected mostly in the hilly provinces (Bakonyicum and Matricum): Microvelia reticulata, Acalypta parvula, Megalonotus sabulicola, Rhyparochromus vulgaris, Eurygaster testudinaria, Sciocoris homalonotus.
Comparison of ground-living heteropteran assemblages collected in different seasons The material
For the sake of simplicity, we mean „spring” by the period between the 1st of March and 31st of May, „summer” between 1st of June and 31st of August, „autumn” between 1st of September and 30th of November, „winter” between 1st of December and 28/29th