Streaming in the Ameba
1NOBURO KAMIYA
Department of Biology, Faculty of Science, Osaka University, Osaka, Japan;
Department of Biology, Princeton University, Princeton, New Jersey;
and The Marine Biological Laboratory, Woods Hole, Massachusetts
The subject matter of the present study is concerned with motive force measurement of endoplasmic streaming in a free-living ameba, and motive force changes under normal and experimental conditions. For most of our experiments, Chaos chaos was used, but sometimes Amoeba proteus was used for comparison. They were fed with Tetrahymena and cultured in a medium of low ionic strength (Prescott and James, 1955).
The motive force responsible for protoplasmic streaming was first measured in the slime mold Physarum polycephalum by what we called the "double-chamber method" (Kamiya, 1940, 1942, 1953, 1959). T h e measurement was based on the null method; that is, the motive force was found from the counter pressure that just stopped endoplasmic streaming. In order to conduct such an experiment, a chamber divided into two compartments was constructed and the dumbbell-shaped myxo- mycete plasmodium was so placed that two plasmodial masses were con- nected with each other by a plasmodial strand penetrating the central partition.
The method used for slime mold is applicable, at least in principle, to other cells showing ameboid movement. However, amebae, even in the case of Chaos chaos, are much smaller than the plasmodium of Physarum, and we are inevitably confronted with the technical problem of how to construct a double chamber fitted to them.
Double Chambers Applicable for Studies on the Ameba In making such a chamber, I worked out several methods of which two are most convenient for many experimental purposes.
(a) Agar capillary method. One method is to construct an agar chamber. We first prepared a pair of glass capillaries, each of which had
1 This study was supported in part by a Research Grant (RG8691) from the Institute of General Medical Science, U.S. Public Health Service, administered by Dr. R. D. Allen of the Department of Biology, Princeton University.
257
an orifice constructed at the end by fire-polishing with a microflame (Fig. 1A). The tip was then ground off slightly into a flat end (Fig. IB).
Two such capillaries were placed so that they faced one another in a pair of glass sleeves mounted in a Lucite frame. Then, a glass fiber just
C
FIG. 1. (A) A fire-polished end of a glass capillary. (B) T h e same capillary after the tip (the dotted parts) was ground off. (C) T h e chamber in perspective before agar is poured. F—Lucite frame; S—glass sleeves to hold the capillaries (C1 and C4 >);
f—the central glass fiber penetrating the capillaries through their terminal constric- tions.
Β
FIG. 2. Vertical sections at the median plane of the chamber. (A) Before agar is poured. Black parts—Lucite frame; shadowed parts—glass sleeves to hold the glass capillaries (Cy C(>); f—central glass fiber. (B) After molten agar was poured and the central glass fiber and a pair of capillaries were removed. Dotted parts—agar gel;
L, R—left and right chambers, respectively.
small enough to fit through the holes was introduced through both capil- laries (Fig. IC, Fig. 2A). When the pair of capillaries had been brought in a proper position, molten agar (4% in Prescott-James solution) was poured into the frame, and a cover slip was placed on top.
After the agar had set into a stiff gel, the central glass fiber was pulled out first, and then the two glass capillaries. Two cylindrical hol- low spaces (L and R ) connected by a narrow channel were left behind in the agar gel (Fig. 2B); these spaces were then filled with Prescott- James solution. By this method, we can now make a narrow tunnel with uniform thickness and of any desired length between the two chambers.
An ameba is introduced from one end by applying an appropriate hydrostatic pressure difference (usually in the range of 20-80 mm water column) between the two sides, L and R. What is a suitable bore for the
Pressure Transducer and recorder
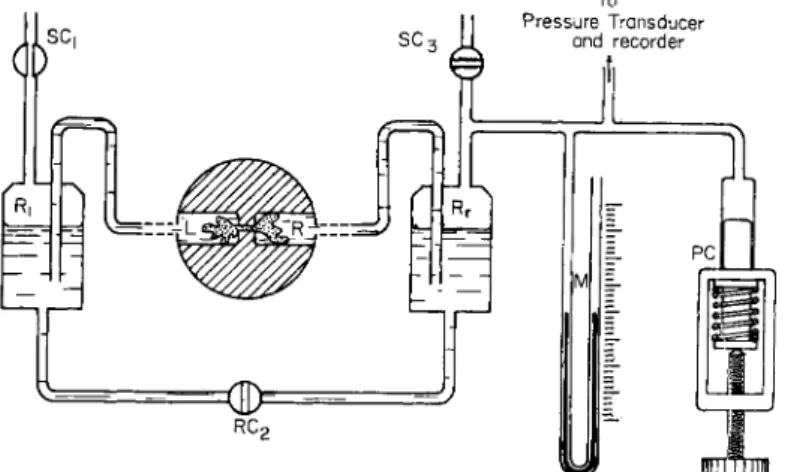
FIG. 3. A diagram of an arrangement for controlling and measuring the hydro- static pressure difference between the two chambers into which an ameba is sep- arated through a hole. T h e encircled, shadowed part is enlarged. L, R—left and right chambers, respectively; Rr Rr—left and right reservoirs, respectively; PC—pres- sure controller; M—manometer; S C ^ S C0, SC3—stopcocks.
channel depends naturally on the material used. For Chaos chaos, a channel with a bore of 50-130 μ is appropriate; for Amoeba proteus a suitable diameter is in the range of 30-60 μ.
In order to control and measure the hydrostatic pressure difference across the channel penetrating the central partition, chambers L and R are connected to reservoirs RL and Rr whose water level is kept exactly the same before the experiment by opening the stopcocks SCX, SC2, and SC3 (Fig. 3). As shown in the figure, Rr is connected to a vertical water manometer and pressure controller composed of a 10-ml injection syringe and a screw. Water reservoir R! is left open to the atmosphere. Pressure difference between the chambers L and R induced by the pressure con- troller manually is read from the manometer or recorded electrically by means of a pressure transducer on a recorder.
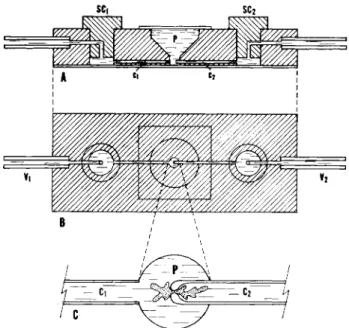
(b) Constricted orifice method. T h e other method which is partic- ularly convenient for certain physiological experiments is to use a glass capillary with a fire-polished constriction at its end (cf. Fig. 1A). First, a piece of Lucite block having a central pool (P) in the form of an in- verted cone and a pair of built-in stopcocks (SCV SC2) is prepared (Fig. 4A and B). The construction is such that a pair of glass capillaries (Cx and C2) connect the pool Ρ and small spaces under stopcocks SCX and SC2 respectively, the narrowed orifice of C2 being at the center near
SCi SC2
A * c'
/ \ / \ / \
FIG. 4. A Lucite chamber arranged for the constricted orifice method. ( A ) Side view. (B) Top view (about the actual size). (C) The bottom area of the pool with the constricted orifice of a capillary loaded with an ameba (enlarged). Ρ—pool; Cr C2— capillaries; SCV SC0—stopcocks; νχ, V2—vents.
the bottom of the pool; the bottom of the Lucite block is closed with a cover slip and sealed with epoxy resin. The entire volumes of the pool P, capillaries Cx and C2, and stopcocks (SCj and SC2) are filled with Prescott-James solution. The vents of the chamber, Vx and V2, are con- nected to reservoirs and Rr just as before (cf. Fig. 3).
After several amebae are introduced from the top, into this pool, the top of the pool is covered with a piece of cover slip. The amebae grad- ually sink to the bottom. If negative hydrostatic pressure is applied to capillary C2, the water in the pool Ρ starts flowing into C2. As soon as one of the amebae is carried with the water current toward the hole and blocks it, what appears to be a pseudopodium is induced to form into
the hole by the pressure gradient. Later, a considerable amount of endo- plasm is transported into the capillary C2. Thus, we have divided an ameba into two parts—one in the pool Ρ and the other in the capillary C2—the two being connected by a narrow neck of cytoplasm at the hole (Fig. 4C). While looking at the endoplasmic streaming at the neck by an inverted microscope from below, the hydrostatic pressure in the capillary (C2) is controlled and measured with the arrangement shown in Fig. 3.
This method is convenient for use in experiments which test the effect of various chemical reagents, since we can easily replace the greater part of a solution in the pool Ρ with another by using a pipette and closing the stopcocks and SC2 to keep the ameba in position.
It is also possible by this method with a pair of nonpolarizable electrodes to measure electrical potential differences between the two media to which two different parts of ameba are exposed.
Behavior of an Ameba under an External Pressure Gradient First, we shall discuss the behavior of an ameba in the double cham- ber under an external pressure gradient. For such observations the agar double chamber is more advantageous than the glass, since in the former, the connecting capillary is evenly thick and no shadow is formed be- cause of the small difference between the refractive indices of the 4 % agar gel and water. As soon as an ameba is carried by the current of water so that it closes the entrance of the agar capillary, a hyaline cap is formed toward the interior of the capillary. T h e endoplasm then
"pours" into the capillary to form an induced pseudopodium [Fig. 5(1)].
This induced pseudopodium formed in the agar capillary lengthens rapidly at first, but less rapidly later under the same external pressure gradient (for instance, 30 mm of hydrostatic head across 0.5-mm agar wall). When the pseudopodium has proceeded some distance into the agar capillary, it often ceases to advance or may even retract against the external pressure gradient as if the ameba were actually resisting the pressure imposed upon it from the outside. In such a case we need to apply greater pressure differences in order for further pseudopod forma- tion to occur.
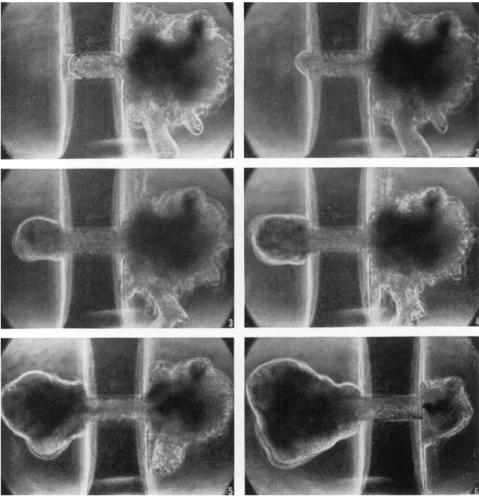
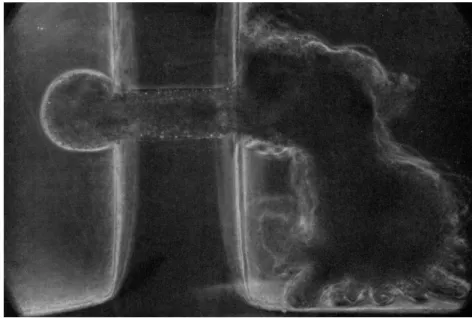
When the hemispherical advancing front of the pseudopodium reaches the exit of the narrow channel, a more-or-less spherical pseu- dopod is formed at the advancing front in the other chamber [Fig. 5(2) and (3); Fig. 6]. At this time the speed of endoplasmic inflow through the hole into that pseudopodium suddenly increases and is accompanied by an increase of its surface area. It is at this stage that the ameba is
most vulnerable to bursting at its front end. The external pressure gradient must then be made smaller so that a too rapid increase in the surface area of the front end is avoided. A series of pictures of Chaos chaos forced to move under pressure gradient from one chamber to the
FIG. 5. An ameba (Chaos chaos) being introduced into one chamber from the other through agar capillary under pressure gradient. Six photographs were taken at unequal intervals in 3 min. Hydrostatic pressure in the right chamber was higher than in the left, at first by 60 mm and later by 30 mm of water column. Diameter of the capillary—115 μ; wall thickness—280 μ.
other through a channel penetrating the central agar wall are shown in Fig. 5.
The pressure necessary to suck an ameba into a capillary varies greatly depending upon the morphological site at which the suction is
FIG. 6. Formation of spherical pseudopod (Chaos chaos) at the orifice of the capillary. T h e chamber used is the same as that in Fig. 5. Pressure difference—25 mm of water.
surface. Irrespective of what part of the ameba is first sucked from one end, or pushed from the other end, into the capillary, the artificially induced, endoplasmic streaming is usually accompanied by the forma- tion of a hyaline cap at the advancing front as was pointed out by Mast (1931a). Often this is also true of an ameba which is not confined in a capillary but has much greater free surface.
When such an ameba is divided nearly equally into two chambers with a narrow streaming channel in-between, one-half of the body of the ameba, toward which the endoplasm is made to stream artificially for an extended period, always takes the form of an advancing front, whereas the other half of the body, from which the endoplasm is re- moved, takes the form of the tail. If a considerable amount of endo- applied and also on the physiological condition of the animal. Amebae starved for several days are more resistant to bursting than those soon after feeding. Although an ameba can be sucked in from any part of the body, the advancing tip of the naturally formed pseudopodium can be sucked most easily with a minimum of pressure difference. If the side wall of a pseudopod or the tail region of the animal is brought into the capillary by pressure, this part is now converted into the advancing front which is characterized by a hyaline cap formation and a smooth
plasm is forced to move from one end to the other by external pressure, then, when the pressure is released, the endoplasm tends to "spring back" sometimes from the hyaline cap side, or the "head," toward the
"tail" characterized by a wrinkled surface. In this case, therefore, mor- phological characteristics and the direction of the motive force behind streaming are just the opposite to the normal ameboid movement. At any rate, an ameba always behaves in the experimental situation as if its morphological characteristics of the head and tail are a consequence of endoplasmic flow rather than its cause, since the front end of the endo- plasmic streaming, no matter whether it is spontaneous or induced by pressure gradient, invariably assumes the form of head and the rear end, the form of tail. Although the artificially induced head and tail were not identical in their organization with those formed under normal conditions, this fact may be significant in considering the cause and effect in the events involved in ameboid movement.
Measurement of the Motive Force
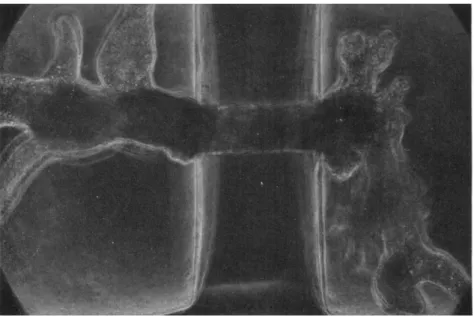
When a single ameba extends into both chambers across the central septum (Fig. 7) and when there is no pressure difference between the two, the endoplasm in the connecting channel moves toward one direc-
FIG. 7. A single ameba (Chaos chaos) divided into two chambers across the capillary in the central wall. T h e photograph was made after the endoplasm in the connecting strand had been kept at a standstill for several minutes. Note the formation of pseudopodia on both sides of the central wall.
tion or the other by the motive force generated in the living ameba.
Under such circumstances the endoplasm can be influenced extremely sensitively by the hydrostatic pressure difference established artificially between the two chambers. By controlling the direction and magnitude of the pressure gradient, it is possible to accelerate, retard, or reverse the natural endoplasmic flow along the connecting capillary. By this means, it is not difficult to find just how much pressure is necessary to keep the endoplasm in the connecting capillary at a standstill.
Keeping the endoplasm stationary in the connecting capillary is so delicate an operation that endoplasm starts flowing in either direction if the counter pressure is out of balance by as little as 0.5 mm of water or less. There is no perceptible "play" between the movement of the endoplasm and external pressure difference. Therefore the balance pressure can be determined extremely accurately. T h e counter pressure to keep the endoplasm at a standstill is usually less than 15 mm of water.
Allen and Roslansky (1959) introduced a pseudopodium of Chaos carolinensis into a glass capillary and applied a hydrostatic pressure inside the capillary against the advancing pseudopodium for a few sec- onds to stop the endoplasmic streaming. They found that the minimum value to stop the streaming was 1.10 cm which is very close to the value obtained by the double-chamber method.
Dynamoplasmograms
In order to keep the endoplasm in a channel between the two parts of the ameboid body, it is necessary to modify the counter pressure continuously. This is because the motive force generated in the ameba changes spontaneously under constant external conditions. By plotting a series of successive values of the balance pressure against time, or by recording the pressure change electrically using a pressure transducer, we obtained some rather complicated curves which denote exactly how the motive force behind the endoplasmic streaming in the connecting channel has changed.
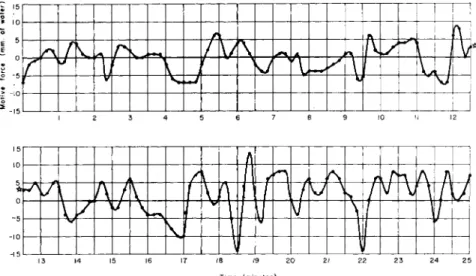
The curve representing the motive force of the protoplasmic stream- ing has been referred to by myself as a dynamoplasmogram (DPG) (Kamiya, 1942, 1953, 1959). Figure 8 shows an example of the dynamo- plasmogram of Chaos chaos. Circles plotted represent instantaneous values read by another observer every 10 sec from the manometer. It is shown here that the motive force has changed in the range of ± 1 5 mm.
The points where the curve intersects the baseline represent the mo- ments when the motive force was zero and its direction had reversed spontaneously. Generally, motive-force curves of the ameba do not mani-
fest themselves as regular waves, such as those in myxomycete plasmo- dium, but it is clear from this figure that the magnitude and direction of the force are constantly changing.
It is noted in this case that even though the endoplasm is kept quiet by this means in the connecting capillary, the two ends of the ameba, which are outside of the capillary, show normal and vigorous ameboid movement accompanied by endoplasmic streaming, and new pseudo- podia or tails are being constantly formed. Two parts of the ameba on the opposite sides of the central septum behave in this case as though
Λ h
/ r / \
A y/ν y \
f
jι π V f J \
y \ Λ
t
V 13 4 5 6 7 8 9 10 II 12
13 14 15 16 17 18 19 20 21 22 23 24 2 5 Time (minutes)
FIG. 8 . A dynamoplasmogram of Chaos chaos in a normal state (temperature, 2 3 ° C ) .
they are two independent amebae so long as the endoplasmic flow in the connecting capillary is kept immobile.
Motive Force at Different Sites of an Ameba
The motive force responsible for endoplasmic streaming in an ameba is generally not the same in different parts of the body.
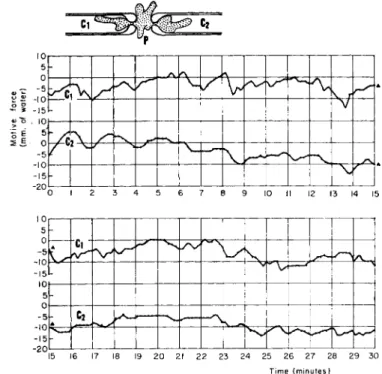
In order to measure the motive force at different sites of one and the same ameba simultaneously, we placed a pair of capillaries with fire-polished constrictions at their ends in such a way that the constricted ends closely faced each other at the bottom of the pool similar to that shown in Fig. 4. By this means, it is not difficult to load an ameba in a manner shown in the inset of Fig. 9. As is shown there, an ameba body is separated into three parts, capillary Clf pool P, and capillary C2
through two necks at the capillary ends. T h e pool Ρ (cf. Fig. 4) is un- covered in this case and its free water surface is well balanced with those of reservoirs Rt and Rr (cf. Fig. 3). Each of the capillaries, Ct and C2, is connected to an independent manometer and pressure controller. With this twin system, it is possible to keep the endoplasm at both necks im- mobile and thus to measure the motive force at the two different parts of the same ameba simultaneously.
0 1 2 3 4 5 6 7 8 9 10 II 12 13 14 15
15 16 17 18 19 20 21 22 23 24 25 26 27 28 29 30 T i m e ( m i n u t e s )
FIG. 9 . Dynamoplasmograms at two loci of one and the same ameba (Chaos chaos). T h e upper curve shows the balance pressure in CR and the lower curve that in C2.
Figure 9 shows an example of this kind of measurement. Balance pressures in and C2 were read alternately every 5 sec from the two manometers, i.e., successive values of the balance pressure in one of the two capillaries, Cx and C2, were determined at 10-sec intervals. T h e up- per curve in Fig. 9 shows the balance pressure in Cx in reference to P, and the lower curve that in C2. From this figure it can be seen that there is a general parallelism between the upper and lower curves. Since the upper and lower curves represent the hydrostatic pressures in the capillaries Cx and C2 which were just sufficient to keep the endoplasm at a standstill at the necks of the capillaries, the parallelism of the two
curves means that changes in motive-force generation occurred both distally or proximally relative to the central portion. This in turn may imply that the motive forces are governed in this case primarily by the central part of the ameba, that is, the part formed in the pool P.
The parallelism between the two curves, however, is true only in their general trend. If we compare the two in detail it is clear that they are by no means identical, showing that the force behind the endo- plasmic streaming is different in different portions of the cell.
Effect of ATP, AMP, and Pyrophosphate2
The ameba double-chamber method gives us a unique opportunity to study quantitatively the effect of various chemical and physical agents
10
Ι/Ι I0"3M ATP (one s i d e ) A T P r e m o v e d
Γ
, μ Γ" " " "
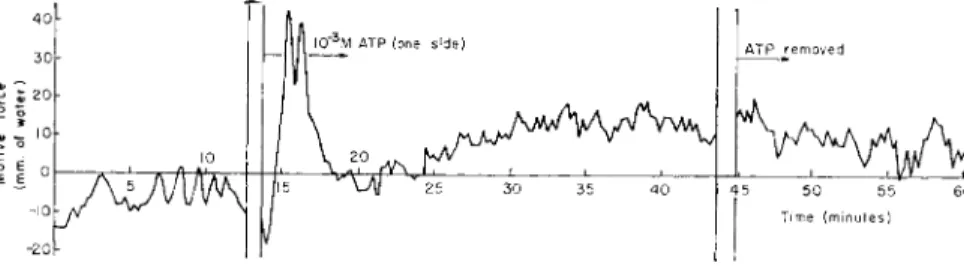
4 5 5 0 5 5 6 0 J Time ( m i n u t e s )FIG. 10. T h e effect of 10—3 M A T P on motive-force generation in Chaos chaos.
A T P dissolved in Prescott-James solution (adjusted to the pH of the original Prescott- James solution with NaOH) was administered to only one-half of the ameba (P in Fig. 4) whereas the other half ( C2 in Fig. 4) remained in the plain Prescott-James solution.
on the motive force. Now I would like to give some examples of the results obtained by this method.
In view of the paramount physiological importance of adenosine triphosphate (ATP) and related substances in mechanochemical systems involved in various cellular motions, we shall first consider how endo- plasmic streaming reacts when these substances are applied extra- cellularly. Figure 10 shows a dynamoplasmogram of an ameba when 1 0- 3 M A T P was applied to one side (pool side in Fig. 4) of the animal.
T h e initial part, up to 13 min, represents motive-force generation under the normal condition of an ameba. By admitting A T P thereafter, the motive force increased conspicuously for a few minutes. Since the pres- sure was controlled on the side (C2 in Fig. 4) where there was no ATP, the fact that more pressure was needed to stop the inflow of the endoplasm showed that endoplasm tended to flow predominantly from the A T P
2 I am indebted to Dr. H. Nakajima for his cooperation in these experiments.
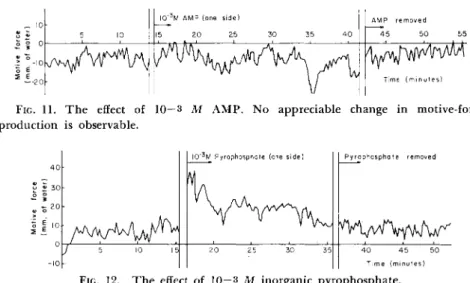
side toward the opposite side where no A T P was present. Although this does not necessarily mean that A T P would act in this case as an energy donor, this result confirms the observation of Goldacre and Lorch (1950) on microinjected ATP. Although the effect of A T P is transient, such a reaction is not observable with adenosine monophosphate (AMP) at the same concentration, as shown in Fig. 11. But it does occur as conspic-
5 10
I 0 "3M A MP (ONE S I D E)
15 20 25 30 35 40 Δ ΜΡ R E M O V ED
4 5 50 55
T I ME ( M I N U T E S)
FIG. 11. T h e effect of 10 — 3 M A M P . No appreciable change in motive-force production is observable.
I 0 "3M PYROPHOSPHATE (ONE S I D E) P Y R O P H O S P H A TE REMOVED
_/ 5 10 15 2 0 25 30 35 4 0 45 50 T I ME ( M I N U T E S)
FIG. 12. T h e effect of 10—3 M inorganic pyrophosphate.
uously with inorganic pyrophosphate as with A T P (Fig. 12). Ortho- phosphate has no effect.
Motive-Force Generation in Relation to Bioelectrical Phenomena Now I would like to discuss the relation of motive-force generation to some bioelectrical activities of the ameba. A series of experiments along this line have been performed in collaboration with Dr. Ichiji Tasaki.
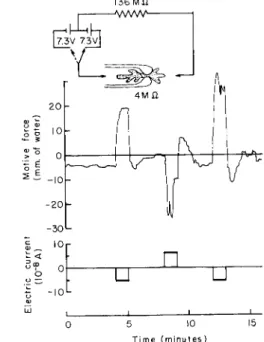
Figure 13 shows the effect of electric current on motive-force pro- duction. An ameba is placed in a glass capillary chamber so that two parts of the body are separated by the constriction at the capillary end, and a direct current of about 5 χ 1 0- 8 amp was applied through non- polarizable electrodes across the body of the ameba as is indicated by the inset. T h e dynamoplasmogram in the initial 4 min shows the motive- force generation under normal conditions. Contrary to the previous figures, the motive force is designated here (and also in Figs. 14 and 15) as plus when the balance pressure inside the capillary is negative, i.e., when the endoplasm tends to flow from the left to the right (cf. the inset of
5 -IOL
ω ι ι L Ι - Ο 5 10 15
Time (minutes )
FIG. 13. The effect of electric current through ameba (for details see text).
current is applied in the opposite direction, the motive force is im- mediately reversed as shown by the downward trend of the motive-force curve. The same process can be repeated many times. It must be noted in this case that the hyaline cap is invariably formed at the cathodal end (Mast, 1931b; Hahnert, 1932).
In the experiment shown in Fig. 14 the direction of the current was reversed every 2 min. T h e direction of the motive force was so changed without exception so that the endoplasm tended to move toward the cathode. Thus the cathodal galvanotaxis of ameba has been now firmly established on a quantitative and dynamic basis.
Instead of applying electric current through the ameba, it is also possible to measure and record the normal bioelectric potential dif- ference between the two ends of an ameba from the outside. In order to do this the two external media are connected to amplifying and re- Fig. 13), and as minus in the opposite case. T h e direction of the current is taken as positive when the outside of the capillary is anodal and nega- tive when it is cathodal. From Fig. 13, we see that as soon as the current is applied with the cathode on the right the ameba tends to move toward the cathode, since a positive pressure head of nearly 20 mm water is needed on that side to stop the flow. On breaking the current, the motive force shows a "rebound" before it returns to the original level. When the
136 M û
cording circuits through a pair of nonpolarizable electrodes (Ag-AgCl- agar).
By this means it was made clear, first of all, that the pressure-induced acceleration or reversal of the endoplasmic streaming does not alter the potential difference between the two ends of an ameba appreciably. In other words, there is no evidence to show the occurrence of a streaming potential in the ameba just as in the case of the slime mold (Kamiya and Abe, 1950).
I0r 0 -
-10-
0 5 10 15 20 25 30 35 40
Time (minutes)
FIG. 1 4 . T h e effect of electric current in the form of alternating square waves.
T h e extracellular potential difference between the two parts of one and the same ameba changes spontaneously even though the endoplasm in the connecting capillary is kept at a standstill. T h e upper curve in Fig. 15 is an example of the record of the extracellular potential change of Chaos chaos when the streaming was kept quiet at the connecting capillary. A characteristic feature of this curve is that there are numerous rapid and conspicuous potential changes, or "spike potentials," of vari- able amplitude, but the potential comes back quickly to the original level. Without going into the details of the physiological nature of these spike potentials, it suffices to say that they are accompanied by a temporary drop in membrane impedance and, second, that they are reversibly eliminated by anesthetics, such as cocaine and ether, and by the absence of bivalent cations.3 All these characteristics are in common with those of action potentials in nerve or muscle fibers, except that the
3 Details of the work will be dealt with elsewhere by I. Tasaki and N. Kamiya.
spike potential in ameba does not obey the "all-or-none" law. There seemed to be no clear correlation between production of spike potentials and pseudopod formation or other visible morphological changes.
Beside the rapid spike potentials it was noticed here that the resting potential level fluctuated spontaneously within the range of several millivolts. T h e lower wave train shows the spontaneous changes in the motive force as recorded simultaneously with a pressure transducer.
Here we see that there is some correlation between the two. In this graph, the upper curve represents the potential of pool Ρ (cf. Fig. 4) in reference to the inside of the capillary C2, and the lower curve shows the balance pressure in the pool in reference to the pressure inside the capillary.
, • 1 ' '
0 5 10 15 20 25 Time (minutes)
FIG. 15. Simultaneous records of extracellular potential difference and the motive force responsible for endoplasmic streaming in Chaos chaos (for details see text).
In the case of plasmodia, it was demonstrated some time ago (Kamiya and Abe, 1950) that the generation of the motive force is accompanied by changes in outside potential difference, and that the phase of the potential wave lags behind that of the dynamic wave. T h e relation between the electrical and dynamic activities in ameba seems to be similar to but not so distinct as that in the slime mold. The parallelism between the electrical and dynamic activities often ceases when the ameba is treated with monovalent and bivalent cations, anesthetics, etc.
The causal relations of the two activities remain to be analyzed.
Concluding Remarks
In the present work I have described the methods worked out for measuring the motive force of the endoplasmic streaming in free living
amebae and presented some facts revealed by taking advantage of the methods. The ameba double chamber should be applicable with some technical modifications to the study of motile systems of much smaller cells exhibiting ameboid movement and also for measuring extracellular potential differences of these cells.
Although the mechanism of ameboid movement has not been dis- cussed previously, it is my hope that experimental facts to be obtained by the previously described method will help one to understand the nature of the ameboid movement of a variety of cells from a new angle and to analyze this complicated phenomenon on a quantitative basis.
Summary
1. Methods were introduced for measuring the motive force re- sponsible for endoplasmic streaming in free-living amebae.
2. When a single ameba is loaded in an agar capillary double cham- ber, or in a glass capillary through its constricted end, an external hydro- static pressure gradient can counterbalance the endoplasmic streaming.
3. The balancing of the motive force with an external pressure gradient is so delicate that the endoplasm starts flowing in one direction or the other when the counter pressure deviates from the balancing points by less than 0.5 mm of water.
4. A new "pseudopod" is formed artificially in the hole by the externally applied pressure gradient.
5. When the endoplasm is forced to flow by the external pressure gradient, the advancing front always assumes the morphology of the head characterized by smooth surface and often by hyaline cap forma- tion. T h e rear region, on the contrary, shows the morphology of the tail characterized by a wrinkled surface.
6. Spontaneous changes in the motive force behind endoplasmic streaming are represented in an undulating curve (dynamoplasmogram) with variable periods and amplitudes. T h e motive force in Chaos chaos changes usually within the range of ± 1 5 mm of water under normal physiological conditions.
7. T h e motive forces can be measured simultaneously at different loci of the same ameba. They are correlated with each other, but not identical in pattern.
8. A T P ( 1 0 ~3 M) and inorganic pyrophosphate ( 1 0 ~3 M) augment the motive force conspicuously, whereas AMP and orthophosphate have no effect at the same concentration.
9. Motive-force changes during cathodal galvanotaxis were studied.
10. Pressure-induced artificial acceleration, retardation, or reversal
of the streaming is not accompanied by the perceptible potential change, i.e., there is no evidence of a streaming potential.
11. The extracellular potential difference between two regions on the ameba surface changes spontaneously. There are slowly fluctuating potential changes and rapid potential changes, or "spike potentials," of variable amplitudes. The causal relationships of the dynamic and elec- trical activities are still obscure.
ACKNOWLEDGMENTS
The present work was started in the summer of 1962 at T h e Marine Biological Laboratory at Woods Hole where I enjoyed the privileges of Senior Lalor Fellow through the courtesy of the Lalor Foundation. T h e major part of this work was developed and elaborated during my sojourn at the Department of Biology, Princeton University.
It is a pleasant duty for me to express my sincere gratitude to Dr. C. Lalor Burdick, the director of Lalor Foundation, Dr. Arthur K. Parpart, the Chairman of the Department of Biology, Princeton University, and especially to Dr. Robert D.
Allen for all the support and encouragement which made the present work possible.
REFERENCES
Allen, R. D., and Roslansky, J . D. (1959). / . Biophys. Biochem. Cytol. 6 , 437.
Goldacre, R. J . , and Lorch, I. J . (1950). Nature 1 6 6 , 497.
Hahnert, W. F. (1932). Physiol. Zool. 5 , 491.
Kamiya, N. (1940). Science 9 2 , 462.
Kamiya, N. (1942). In "The Structure of Protoplasm" (W. Seifriz, ed.), pp. 199-244.
Monogr. Am. Soc. Plant Physiol., Ames, Iowa.
Kamiya, N. (1953). Ann. Rept. Sei. Works, Fac. Sei. Osaka Univ. 1, 53.
Kamiya, N. (1959). Protoplasmatologia 8 , 3a.
Kamiya, N., and Abe, S. (1950). Colloid Sei. 5 , 149.
Mast, S. O. (1931a). Protoplasma 1 4 , 321.
Mast, S. O. (1931b). Z. Vergleich. Physiol. 1 5 , 309.
Prescott, D. M., and James, T . W. (1955). Exptl. Cell Res. 8 , 256.
DISCUSSION
DR. WOLPERT: I just wondered to what extent you feel your work fits in with the work of Bingley and Thompson.
DR. KAMIYA: They measured potential difference between the two loci of the interior of the ameba, using one or two microelectrodes. Recently, Dr. Tasaki and I studied some electrical characteristics of Chaos chaos. In some of our work we used microelectrodes. Using two microelectrodes, we could also detect fluctuations of the potential difference within a single ameba, but we are not certain what kind of potential difference it is we are measuring, since the tip of the microelectrode is so easily covered with a coagulum in the ameba cell. In such a case, a potential dif- ference measured between the exterior and interior, which is at first as high as 100 mv in Prescott-James solution, is unstable and tends to become smaller. Further- more, when the electrode is pulled out of the cell, there remains some potential difference. Bingley and Thompson did not say anything in their paper about this point.
According to our work (Tasaki and Kamiya, unpublished), the ohmic resistance of the membrane is about the same order as that of the neuronal or muscle fiber membrane. T h e resistance of the ameba is of the order of one-tenth of that of Prescott-James solution. If there is an ohmic current within the ameba body, as Bingley and Thompson insist, there must be a rather high external potential differ- ence when measured with the constricted orifice method which I have just described.
But actually the external potential difference between two electrically insulated halves of the ameba is only of the order of a few millivolts. This is decisive evidence showing that the occurrence of the internal current postulated by Bingley and Thompson would not actually be the case. T h e microelectrode method is very advantageous if it is adequately used for proper materials, but at the same time we must be cautious in interpreting what we have measured with microelectrodes, especially in an organism such as ameba or slime mold.
CHAIRMAN D E BRUYN: Does your microelectrode penetrate the mucopolysac- charide layer?
DR. KAMIYA: Yes.
DR. ZIMMERMAN: Some time ago, Drs. Marsland and Landau and I reported that A T P increases pseudopodial stability in amebae. Your data with A T P seem to confirm this very well. T h e question I should like to ask you is: Have you tried using low concentrations of ATP? We found that when higher concentrations of A T P were applied to cells, there was a generalized contraction of the entire cell. When we used lower concentrations of A T P , in the range of 5 χ 10—4 M, the cells moved in apparently normal fashion, but when tested with pressure, they had an increased pseudopodial stability.
DR. KAMIYA: W e tried, so far, 1 χ 1 0- 4 M and 2 χ 1 0- 4 M A T P in the low- concentration range. At 2 χ 10—4 M A T P , temporary augmentation of the motive force is clearly observed. Even at 1 χ 10 — 4 M the moderate effect of A T P is still perceptible.
DR. ZIMMERMAN: We suggested at that time that A T P could be the energy source for ameboid locomotion.
DR. HIRSHFIELD: I noticed from the films that, as the cytoplasm poured through the bridge, the side that emerged was rounded and then pseudopods formed later.
How long did it take before the reappearance of the normal pseudopods was noted?
DR. KAMIYA: Only a couple of minutes.
DR. HIRSHFIELD: DO you think there is any particular significance to the initial rounding as it emerged through the port?
DR. KAMIYA: I think it is a noteworthy fact. T h e ameba invariably forms a spherical or oval head when it emerges through the pore under pressure. I suppose this is caused by the stretching of the surface layer or membrane which has a certain amount of tensile strength, which in turn resists mechanically the increase in the sur- face area brought forth by the inflow of the endoplasm. This is probably why the advancing front takes a spherical form. As a matter of fact, the advancing front is most vulnerable to bursting when the rate of increase in surface area is at its maxi- mum, i.e., at the moment when it reaches the orifice of the capillary and starts in- creasing in surface area.
DR. HIRSHFIELD: When it becomes the tail, does it assume the pseudopodial characteristics as it emerges on the other side? Is it rounded again? Will it do this at will and continue to do so?
DR. KAMIYA: Yes.
DR. ANDREW G . SZENT-GYÖRGYI: W h a t is the concentration of A T P in the ameba?
DR. KAMIYA: I don't know the concentration of A T P in Chaos. In the slime mold (Physarum), a normal average content of A T P is 0.4 μ M/gm, according to Hatano and Takeuchi.
DR. ANDREW G . SZENT-GYÖRGYI: I would be very careful to interpret the experi- ments where addition of A T P to the intact cell leads to contraction. Such an observation does not necessarily mean that A T P serves as the energy source or even that the contraction mechanism is similar to that of muscle. Let us take the analogy of muscle. A T P has been tried on intact muscle fiber and caused contraction; this experiment was cited as proof for a direct role of A T P in muscle contraction. In fact, contraction was accompanied by an action potential and action of A T P was, there- fore, not a direct one on the contractile proteins. When A T P was microinjected, the muscle did not respond with contraction, and this is what is expected since the con- centration of A T P in muscle is high, about 6 μΜ/gm. Its action in resting muscle is prevented by the relaxing factor system.
I do not know how to interpret those systems where addition or injection of ATP leads to contraction. It may mean that these systems work quite differently from muscle, or that the regulatory systems are quite different, or that there is no ATP present at rest. T h e system is still much too complicated, and the various possibilities should be sorted out experimentally. If A T P is a part of the con- tractile mechanism and serves as direct source of energy, then there must be some type of mechanism which prevents its action when the system is not contracting.
These control mechanisms should be destroyed or inactivated for A T P to act if its function is similar to that of muscle. A T P should act on killed cells but not on an intact system.
DR. KAMIYA: At present I am not in a position to insist on anything definite about the mechanism of A T P effect on the motive-force production in ameba except to say that A T P and inorganic pyrophosphate are specifically effective and AMP and orthophosphate have no effect at all. Some experiments conducted on the slime mold, however, are instructive in this connection. If A T P is applied externally to the slime mold at the concentration of 5 χ 10—3 M, the motive force gets gradually stronger in the first 10 min or so until it reaches a definite level which is much higher than the normal. On the other hand, when 10—3 M A T P of one-tenth the volume of the plasmodium is microinjected into a slime mold, augmentation of the motive force is immediate and conspicuous. According to an unpublished result of Takata, it is likely that the motive force of streaming becomes greatest when the ATP content of the mold is made higher than the normal level by about 10 —4 M.
When the A T P level becomes still higher, the motive force of the streaming begins to decrease. These experiments are in conformity with the view that the A T P is the direct energy source of the streaming and the normal level of A T P available for the movement in the slime mold is suboptimal. Whether or not this is true of ameba is still to be dealt with.
DR. ALLEN: As I understand it, when you cause an induced pseudopod to go through one of these channels, when it comes out the other side it is spherical. Is that right?
DR. KAMIYA: Always.
DR. ALLEN: This is the point I was trying to bring up this morning. I don't see why a pseudopod should always take on a cylindrical shape if the endoplasm flowed by hydrostatic pressure. One would then have to postulate some additional mechanism for laying down the gel wall in a cylindrical pattern.
Perhaps it should be pointed out in connection with Dr. Kamiya's experiments that an increase in motive force on treatment with A T P may not necessarily mean that chemical energy of A T P has been utilized. T h e cell normally moves against an internal resistance. Lowering that resistance without lowering the contractile tension would also cause an increase in the net motive force as he measures it.
DR. GOLDACRE: I think the experiment you are referring to is this: first, the pseudopod was spherical, and when it reached its normal diameter it continued on as a cylinder.
DR. KAMIYA: Cylindrical pseudopodia are formed when artificially induced rapid inflow of endoplasm is stopped. As long as the artificial inflow continues, an ameba rarely forms cylindrical pseudopodia.
DR. ZIMMERMAN: T O consider one point, I have recently shown that the surface of amebae has ATPase activity; furthermore the data strongly suggest that A T P can also enter the cell. Independently, Sells, Six, and Brächet (Exptl. Cell Res. 2 2 , 246, 1961) have also reported that amebae can split A T P presumably by means of enzyme localized at the cell surface. Their methods of analysis were entirely different from those which I employed. Thus in two different laboratories evidence indicates that amebae can hydrolyze exogenous A T P .
DR. ANDREW G . SZENT-GYÖRGYI: I am not for or against the particular proposals dis- cussed here. I think, though, that one ought to measure how much A T P an ameba contains and what is the reason that this A T P , if there is any, does not act in the resting condition. T h e A T P either has to be compartmentalized and effectively separated from the contractile component, or present in an "inactive form," which I doubt a great deal. There must be some reason that injected A T P acts differ- ently from A T P present originally. What is the control mechanism which prevents its action? Of course it is also possible that there is no A T P in the ameba, though such a result would be rather surprising.
DR. BOVEE: I just wanted to make one short comment to the effect that in many kinds of amebae the initial pseudopodial form is always a hemisphere. It then may become extremely long and tenuous, sometimes twisted, and sometimes with a conical tip. This seems to be generally true, but I have no explanation for it.