The Determination of the Fat-Soluble Vitamins:
A, D, E, and Κ
JAMES ALLEN OLSON Department of Biochemistry College of Medicine
University of Florida Gainesville, Florida
I. Introduction 345 II. The Vitamin A Group and Its Derivatives 346
A. Nomenclature and Structure 346
B. Analytical Methods 348 C. Purification Procedures 357 D. Isotopically Labeled Compounds 360
III. The Vitamin D Group 360 A. Nomenclature and Structure 360
B. Analytical Methods 362 C. Purification Procedures 366 D. Isotopically Labeled Compounds 367
IV. The Vitamin Ε Group 370 A. Nomenclature and Structure 370
B. Analytical Methods 372 C. Purification Procedures 378 D. Isotopically Labeled Compounds 381
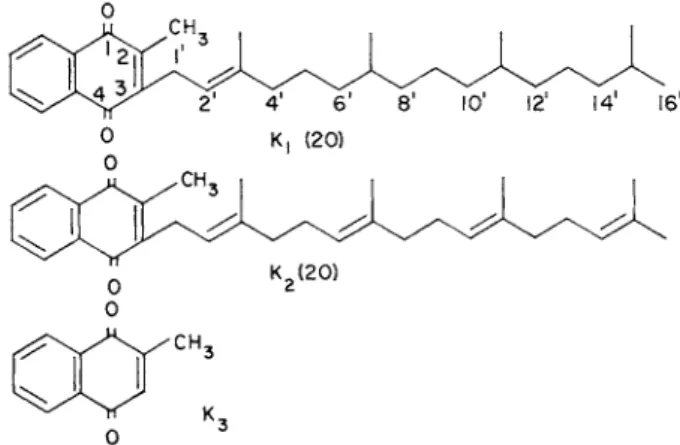
V. The Vitamin Κ Group 382 A. Nomenclature and Structure 382
B. Analytical Methods 384 C. Purification Procedures 389 D. Isotopically Labeled Compounds 391
References 393 I . INTRODUCTION
Since vitamins A, D, E, and Κ were first found to be essential nutri
tional factors for vertebrates (1-4) and their structures were determined (5-8), many procedures have been devised to determine the amount of these vitamins present in various materials and to ascertain their biologi
cal effects. Simple bioassay procedures were first used, and later, as the structure and properties of the vitamins became better known, rapid and sensitive physical and chemical procedures were developed. In contrast to the long and rather costly bioassay techniques, physical and chemical methods were rapid and inexpensive, but often lacked specificity and were affected by other substances present in biological extracts.
345
Unfortunately, these disadvantages of physical and chemical methods are extremely important. Since only small quantities of the fat-soluble vitamins are required to support growth and to allow optimal life ex- pectancy in animals, the physiological levels of these vitamins are often low, and large amounts of interfering substances are present in biological extracts. In addition, these vitamins, and particularly vitamins A and E, are easily oxidized or destroyed, and the artifacts produced from them not only do not assay as the parent compound, but also interfere in other analyses. Hence, long and complex procedures for purifying a given vita- min before analysis have been devised. As interest has grown in their molecular function and metabolism, the need for accurate and highly specific methods for these vitamins and their metabolic derivatives has become painfully clear.
In the last few years, considerable effort has been given to the devel- opment of new methods for the analysis of the fat-soluble vitamins. The synthesis of pure radioactive substrates with known labeling patterns has allowed the metabolic transformations of these compounds to be studied more effectively. The application of modern techniques of chro- matography, particularly gas-liquid chromatography and thin-layer chromatography, has been avidly pursued. The physical-chemical proper- ties of these substances have been better defined and new colorimetric tests devised, but the increase in knowledge about each of these vitamins has brought complexity as well as clarity. Each biologically active vita- min is really a group of isomers, homologs, and derivatives rather than a single substance, and hence, the analyst must have methods for the detection of specific components of a class as well as the total amount of a given factor.
In the present chapter, I wish to define briefly the physical properties of the major compounds in each class of fat-soluble vitamins and their use in assay or characterization, to discuss new and currently used colorimetric methods, to point out the use of gas-liquid chromatography and thin-layer chromatography as well as the more common adsorbent and partition systems, and to mention recent developments in the syn- thesis and analysis of radioactive fat-soluble vitamins. Hopefully, a better methodology for studying these substances will lead to a more rapici elucidation of their metabolic pathways and specific functions.
I I . T H E VITAMIN A GROUP AND ITS DERIVATIVES
A. Nomenclature and Structure
In 1957 the Commission on the Nomenclature of Biological Chemistry of the International Union of Pure and Applied Chemistry recommended
changes in the naming and numbering of vitamin A and its derivatives (9). The parent compound, vitamin Ai, was designated "retinol," and the corresponding aldehyde and acid were termed "retinal" and "retinoic acid," respectively. In addition, the numbering systems for carotenoids and retinol were brought into line, with number 1 assigned to the gem- dimethyl carbon of the β-ionone ring and number 15 to the terminal
TABLE I
NOMENCLATURE OF RETINOL DERIVATIVES
Present designation Other names
Retinol Vitamin Ai
Retinal Vitamin Ai aldehyde
Retinoic acid Vitamin Ai acid
3-Dehydroretinol Vitamin A2
Anhydroretinol Anhydrovitamin Ai
Retroretinol Rehydrovitamin Ai
3-Ethoxyretroretinol Rehydrovitamin A2
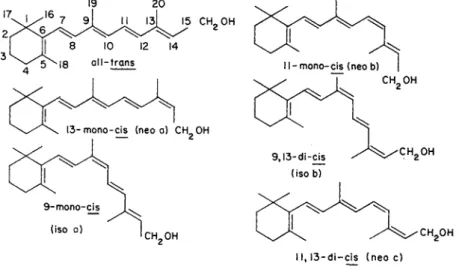
carbon of the side chain. The new designations and previous names are given in Table I. In addition to the sill-trans isomer of retinol and its derivatives, a number of cis isomers exist. Of the thirty-two theoretically possible isomers which might form with five unhindered double bonds, only six exist naturally or have been synthesized. These are given in Fig. 1. All of the cis isomers of retinol have biological activity, although the all-trans isomer is most active. Corresponding isomers of retinal and retinoic acid exist.
1 1 , 1 3 - d i —cis ( n e o c )
FIG. 1. Isomers of retinol.
B. Analytical Methods
1. Physical Measurements
a. Ultraviolet Spectra. Since Morton called attention to the intense ultraviolet absorption band of retinol over 35 years ago (10), many investigators have been attracted to the use of this physical property of retinol for its quantitative measurement. A summary of the absorption maxima and extinction coefficients for various isomers of retinol and its derivatives is given in Table II. These values are taken largely from the
T A B L E II
ULTRAVIOLET ABSORPTION SPECTRA OF RETINOL DERIVATIVES IN ETHANOL 13-cis ll-cis 11,13-cis 9-cis 9,13-a's Compound 2>X\rtrans (neo a) (neo b) (neo c) (iso a) (iso b) Retinol
Xmax ( Π ΐ μ ) 325 328 319 311 323 324
Ει cm1 % 1,832 1,686 1,220 908 1,477 1,379
e 52,480 48,300 34,900 26,000 42,300 39,500
Retinol acetate
Xmax (ηΐμ) 325-26 328 320-21 310-11 323 324
E1 cm!% 1,560 1,430 973 859 1,200 1,100
£ 51,180 47,000 31,960 28,220 39,400 36,500
Retinal
Xmax (ni/i) 381 375 376 373 373 368
E, e mi% 1,530 1,250 878 700 1,270 1,140
43,400 35,600 24,900 19,900 36,100 32,400 Retinoic acid
Xmax (ηΐμ) 350 354 — — 345 346
Ei c mi % 1,500 1,320 — — 1,230 1,150
6 45,200 39,800 — — 36,900 34,500
3-Dehydroretinol
Xmax (ηΐμ) 351 352 — — 348 350
# 1 c m1 % 1,450 1,376 — — 1,143 1,030
6 41,250 39,150 — — 35,520 29,300
3-Dehydroretinoic acid
Xmax (ηΐμ) 370 372 — — 369 366
1,395 1,300 — — 1,240 1,107
€ 41,640 38,800 — — 37,010 33,040
work of Robeson and of Schweiter (11-13) and have been reviewed by Kofler and Rubin (14). The esters of retinoic acid absorb maximally 4-6 m/x toward the red with respect to the free acids. The molecular extinction coefficients of retinol derivatives are high, approximately 50,000 for the all-trans compounds, and their peak absorption occurs at wavelengths which are somewhat removed from the large ultraviolet-end
absorption which is characteristic of many lipid extracts. Hence, the ultraviolet spectrum has been useful in detecting and characterizing retinol and its derivatives in biological materials. As seen in Table II, the cis isomers are hypochromic with respect to the sM-trans compounds, and in general they have maximum absorption peaks at shorter wave
lengths. An exception is the 13-os derivative which is hypochromic, but has a higher Am a x than the εΛΙ-trans isomer. Robeson has pointed out that this bathochromatic shift is also characteristic of other compounds in which the cis double bond is ally lie to an alcohol group (11). In the carotenoid series as well, cis isomers generally have absorption maxima at shorter wavelengths than the all-irans isomer (15). Upon treatment of retinol with dilute hydrochloric acid, retinol is dehydrated to form a hexaene with three peaks, the largest of which occurs at 371 τημ (Table III). Anhydroretinol has a retro structure (16, 17) in which a double
T A B L E I I I
ULTRAVIOLET ABSORPTION SPECTRA OF ANHYDRORETINOL AND ITS DERIVATIVES IN ETHANOL
Compound Maxima Anhydroretinol
Xmax (m/x) 351 371 392
2,500 3,650 3,180
6 67,000 97,800 85,200
Retroretinol methyl ether
Xmax (m/x) 332 348 366
#1 c m1 % 1,400 1,790 1,320
€ 42,100 53,700 39,600
3-Ethoxyretroanhydroretinol
Xmax (m/i) 352 370 391
2,040 3,040 2,740
€ 63,800 95,000 85,600
bond is inserted at the 14,15-position, and the remaining conjugated system shifts into conjugation with it. The retro system, once formed, does not shift back to the normal conjugated system of vitamin A, al
though hydration of the terminal double bond may take place. The ab
sorption maxima and molecular extinction coefficients for retroretinol methyl ether and 3-ethoxyretroanhydroretinol, derived from vitamin A2, are also given in Table III (14).
The most immediate use of these absorption spectra is the assay of fairly pure preparations of retinol and its derivatives. Since the inter
national unit of retinol is equal to 0.300 μg, 1 gm of retinol would contain 3,333,333 I.U. Since the Ex c m 1 % of a\\-trans retinol at 325 τημ in ethanol
is 1832, a factor which relates the international units to the ultraviolet absorption measurement is defined by the following formula:
ρ — I-U- P^r gram
~ E i c m1% at Xmax
For ail-trans retinol, F = 1820. Naturally, the value of the conversion factor in any instance depends on the given isomer, the solvent used, and the temperature, as well as the resolution of the spectrophotometer employed.
Since most lipid extracts of biological material contain ultraviolet- absorbing materials in addition to retinol, correction factors must be em
ployed in order to obtain a reasonable estimate of the retinol present. The best-known method for correcting for so-called "irrelevant absorption"
is that of Morton and Stubbs (18, 19). By the selection of wavelengths on either side of the peak wavelength and by assuming that irrelevant absorption is linear over this span of wavelengths, suitable values for the absorbancy due to retinol may be obtained. Obviously, this correction system becomes less useful as the irrelevant absorption increases. In tissues in which the retinol content is low or in which the ultraviolet absorption of other substances is great, this correction procedure is not applicable, and purification of retinol prior to spectral analysis or the use of other methods is necessary.
Two other aspects of the ultraviolet spectra might be mentioned. Cis- Isomers generally have a more or less distinct peak in the ultraviolet
region (250 to 290 m^) which is absent in the all-trans compound (20).
In addition, the main absorption peak shifts toward longer wavelengths at very low temperatures, and the extinction value distinctly increases (21).
b. Infrared Spectra. Five isomers of retinol and retinal have been studied by infrared spectroscopy (11, 12). Partially on the basis of infrared studies with carotenoid pigments, the assignments of certain absorption bands to specific structures may be made: unmethylated cis double bonds = 12.84 to 12.95 μ, unmethylated trans double bonds = 10.35 μ, methylated cis double bonds = 7.25 μ, and the carbonyl-stretch- ing band = 5.99 to 6.01 μ (22). However, differences among the various
cis isomers are small, and specific structural assignments are difficult on the basis of infrared data alone.
c. Polarography. Since conjugated hydrocarbons are known to be reduced at the dropping-mercury electrode (23), the reduction of retinol during polarography might be expected. Although early work was some
what uncertain, the production of half -wave potentials for retinol and retinol acetate in an acetonitrile-benzene mixture was clearly demon-
strated by Takahashi (24). Kuta has extended this work by analyzing various isomers of retinol (25). In a solution of 10% aqueous dioxane containing either 0.1 Ν tetrabutyl ammonium hydroxide or chloride, a number of half-wave potentials were produced during the analysis of retinol derivatives and ^-carotene. A minimum of three double bonds in conjugation was needed before a reduction wave could be observed, however, and the half-wave potential was lower when many conjugated double bonds were present in the molecule. The 13-cis isomer was reduced somewhat more readily than the all-ircms compound.
d. Fluorescent Measurements. The yellowish-green fluorescence of vitamin A and its esters, which appears when the compound is illumi
nated with light of less than 395 ιημ, has been used to show qualitatively the presence of retinol in various tissues. In a careful quantitative study of retinol fluorescence, Sobotka (26, 27) found that the fluorescent optical density was proportional to the concentration of retinol ester in the range from 0.03 to 1.5 ,/xg per ml when the solvent was ethyl alcohol. The fluorescence reached a peak in 5 to 10 minutes and then rapidly faded.
The palmitate ester faded least rapidly, whereas the acetate ester faded most quickly. Removal of oxygen from the system decreased the rate of
fading, but did not entirely eliminate it. In these early experiments, vitamin A alcohol had very little fluorescence in alcohol. In applying fluorescent measurements to biological extracts, Sobotka found that the method worked quite well for extracts of rat liver, but was less useful for analyzing vitamin A in serum. In the latter case, carotenoids and other chromophores interfered. With the development of more elegant instru
mentation for spectrophotofluorometry, the possibility of measuring retinol to a sensitivity of 0.01 jug per ml was reported (28). In this survey, the activation wavelength for retinol was 325 τημ and the fluores
cence maximum was found to be 470 m/x when the reaction was carried out in 99% ethyl alcohol. Recently fluorometric analyses for retinol and retinol ester have been employed in the analysis of extracts of the retina (29). The excitation wavelength was 325 πΐμ,, and the emission wave
length was 470 τημ. Vitamin A palmitate was employed as a standard.
Care was taken to use only reagents and solvents that were sufficiently free of fluorescent impurities. 3-Dehydroretinol is not estimated by this procedure. Although precise details for carrying out this assay were not given, it apparently is a rapid and effective method of analysis (29).
Further studies on the fluorometric analysis of retinol compounds would be welcome.
e. Other Physical Methods. Proton resonance spectra were obtained with five isomers of retinol at an oscillator frequency of 56.4 megacycles per second with tetramethylsilane as an internal standard (14). Various
protons of the different isomers were assigned specific resonance values.
In the same paper, X-ray powder diagrams of various retinol isomers were given (14).
2. Chemical Analyses
a. The Carr-Price Reaction. The polyenes, which include the carote- noids and vitamin A group, react with acids, metal halides, and other substances to form transiently colored products. The most common reac
tion employed for the analysis of retinol is the Carr-Price reaction, in which antimony trichloride and vitamin A form a complex which gives a transient, but intense, blue color (30). In all probability, the blue color which appears is a result of the resonating positive ion which is formed from the polyene and the Lewis acid, antimony trichloride (31). Other metal halides, such as arsenic trichloride and stannous chloride, also give colored reaction products with retinol, β-carotene, and many other poly
enes. These colored complexes are all of the charge-resonance type (32, 33). In spite of the generality of this reaction among polyenes, some specificity for a given compound does exist in a precise absorption maxi
mum and the rate of formation and fading. The Carr-Price reaction has been immensely valuable in nutritional studies because of its high sensi
tivity and its relative freedom from disturbance by nonpolyenic contami
nants in the lipid extract. Caution must be exercised, however, in presum
ing that the Carr-Price color obtained with solutions containing little retinol and appreciable quantities of other polyenic substances is truly a measure of the retinol present. A summary of the characteristics of the Carr-Price reaction for various retinol derivatives is given in Table IV.
Different values of Ex c m 1 % found for the same compound by various in-
T A B L E IV
EXTINCTION COEFFICIENTS OF RETINOL DERIVATIVES IN THE CARR-PRICE REACTION
Compound
Acetic
anhydride Time (sec) Xmax (ηΐμ) # l c m1 % Reference
Retinol + 15-30 620 5000 34, 35
Retinal
-
20-80 666 4150 35+ ca. 15 666 3780 36
+ 90-120 664 3820 37
— 30 664 3470 12
Retinoic acid + 60-80 572 ca. 1000 38
3-Dehydroretinol + 15-30 693 3520 35
+ — 693 4400 39
3-Dehydroretinal
-
30-45 741 4200 40+ — Variable — 40
+ — 730 ->705 3750 39
vestigators are probably due to variations in procedure rather than to the purity of samples of retinol and its derivatives (34-40). Hence, the individual investigator should standardize his method against good prep
arations of known compounds.
In addition to low specificity, the Carr-Price reaction has other dis
advantages. In the presence of water the insoluble SbOCl forms, which causes turbidity as well as opaque films on the glass. Acetic anhydride is added to act as a scavenger for water, but it may also influence the nature of the retinol complex. For example, when acetic anhydride is present, 3-dehydroretinal gives a variable peak between 700 and 740 τημ which is not linear with the amount of dehydroretinal present (40).
Turbidity is particularly difficult to handle in microscale determinations, and hence a microspectrophotometric method (41) has been widely used, but also severely criticized (42). In addition, the antimony trichloride color for a given amount of retinol may vary from tissue to tissue (43).
A belated advantage of the low specificity of the reaction is that various isomers of retinol or retinal give the same complex as the all-trans com
pound (36, 44, 45). In spite of these considerations, the Carr-Price reac
tion has remained the method of choice for most nutritional investiga
tions.
b. Trifluoroacetic Acid. In studying the complexes which formed be
tween retinol and a number of Lewis acids, Dugan and Frigerio found that trifluoroacetic acid (TFA) gave complexes of vitamin A which were identical in spectra and extinction coefficient to those produced by SbCl3 (46, 47). The procedure employed was similar to that used in the Carr- Price reaction: 1.5 ml of a chloroform solution of retinol or its deriva
tives in the concentration range of 3 to 12 χ Ι Ο6 Μ are placed in a test tube, and an equal volume of trifluoroacetic acid is added by syringe or rapid-delivery pipette. The absorbancy is measured 10 seconds after delivery of the reagent at 616 τημ in a Spectronic 20 or other suitable colorimeter. A calibration curve is prepared, and samples of biological materials are assayed in the usual manner. The properties of complexes formed by this procedure are given in Table V. The wavelength of peak absorption is indeed identical with that of the Carr-Price complex, but the reported extinction coefficients for retinal and retinoic acid are some
what different. /^-Carotene, which is often present in lipid extracts, reacts with trifluoroacetic acid as well as with SbCl3 to give a peak at 585 τημ.
The absorption maximum, however, is at 780 τημ with e > 120,000 after a 30-minute incubation period. Both the Carr-Price and TFA methods give similar results for extracts of saponified and nonsaponified oils.
With nonsaponified oils, however, both methods gave low values.
Technical problems, such as turbidity, toxicity, and cleansing glass-
ware, are less distressing with TFA than with antimony trichloride, with the possible exception that chloroform solutions of TFA decay over a period of days and become useless. The stability of the blue color depends on the method of analysis; in the absence of oxygen it was relatively stable, whereas in test tubes containing large surfaces, it was quickly transformed to a pink species. In all probability, the positively charged
T A B L E V
EXTINCTION COEFFICIENTS OF RETINOL DERIVATIVES IN THE TRIFLUOROACETIC ACID REACTION
Compound Xmax (m/z) e (liter-mole per cm)
Retinol 616 5070 145,000
Retinol acetate 616 4420 145,000
Retinol palmitate 616 2760 145,000
Retinal 664 3340 95,000
Retinoic acid 574 1770 53,000
complex attracts oxygen avidly which leads to the formation of peroxides and disrupts the conjugated system. These workers also explored the use of trifluoroacetic anhydride, which is relatively specific for the alcohol and its esters, and reacts less well with retinal, retinoic acid, and β-carotene. The molecular extinction coefficient for these species is about two-thirds that of the trifluoroacetic acid complex.
Trifluoroacetic acid has also been used for the analysis of retinol in plasma at a microlevel (48). The procedure is similar to that already described, except that readings were taken at 30 seconds. Since carotene complexes also absorb at 620 τημ, suitable correction factors must be employed in sera containing reasonable quantities of carotene. Indeed, when large amounts of carotene are present, as in bovine plasma, TFA values were appreciably higher than those obtained with antimony tri
chloride. In other respects, however, the two methods gave similar results for the plasma and serum of several species. The authors feel that the TFA method is most advantageous for microlevel studies and discuss the difficulties and disadvantages of the Bessey microspectrophotometric pro
cedure (41). It seems likely that trifluoroacetic acid will be extensively used in the future in the analysis of biological materials.
c. Other Colorimetric Tests. Various other procedures have been de
vised over the last 40 years for the measurement of retinol and its deriv
atives. One of the earliest procedures, which depended on the reaction of sulfuric acid with retinol (49), has recently appeared in new garb (50).
Glycerol dichlorohydrin (51), particularly after activation with strong
Lewis acids (52), has often been used, and ferrous sulfate in glacial acetic acid, which yields a color with cholesterol, also reacts with retinol
(53). The complexes formed with these reagents are more stable than the TFA or SbCl3 complexes, but they absorb at shorter wavelengths and have much lower molecular extinction coefficients. Indeed, they closely resemble the pink colors which result in these latter assays after the fading of the blue color (47).
d. Dehydration of Retinol to Anhydroretinol. In the presence of alco
holic hydrogen chloride, retinol is rapidly dehydrated to form retro- anhydroretinol (54). Anhydroretinol has a spectrum with three peaks and with maximal intense absorption at 371 τημ in ethanol (Table I I I ) . The production of this compound has served as a basis of a test (55) which has recently been modified (56). In the latter paper, tissue extracts were saponified in ethanolic KOH in the presence of hydroquinone.
Retinol was extracted by shaking with benzene, and the benzene extract was washed and dried. After measurement of carotene at 465 τημ, equal volumes of the benzene extract and of 10% HC1 in ethanol were mixed in a dark-colored test tube and kept at 15°C for 15 minutes. Thereafter, the solution was neutralized with NaOH, extracted with benzene, and the absorbancy was determined at 377 τημ, the absorption maximum of anhydroretinol in benzene. Small corrections were necessary for the carotene present. The method was successfully applied to the analysis of retinol in rat-liver extracts. A semimicroscale procedure is also described.
Both the esters of retinol and free retinol react to completion under proper conditions of assay. This method, which has not been extensively used in the past, may become of greater utility in view of the ready isolation of anhydroretinol by gas chromatography (57).
e. Thiobarbituric Acid. Thiobarbituric acid has recently been em
ployed for the measurement of retinal in the retina (58). This pyrimidine derivative has been extensively used for the measurement of malonic aldehyde which arises from the oxidation of unsaturated fat or of deoxy sugars, but has not been generally employed for the measurement of other allylic aldehydes. The procedure consists of treating a 90% etha
nolic solution of a tissue extract with 4% thiourea in glacial acetic acid and with 0.6% thiobarbituric acid in absolute ethanol. After mixing, the solution is left in the dark for 30 minutes, and the absorbancy is meas
ured at 530 τημ. All isomers tested, namely the all-frans-, 9-cis-, and 13-cis-retinal gave molecular extinction coefficients of 58,000 at 530 τημ.
All-irans-retinol and ^-carotene, for all practical purposes, did not inter
fere with the reaction. The presence of excess water in the solution re
tards color development and shifts the absorption maximum. The method is particularly useful for the analysis of retinal in the retina, where its
concentration is high. In other tissues, prior chromatographic separation of retinal from retinol and carotenoid pigments may be necessary.
f. Maleic Anhydride Adducts. Maleic anhydride reacts with conju
gated diene systems by a classical Diels-Alder reaction to give adducts with a cyclohexene ring (59). In the case of retinol, both the 11- and 13- double bonds must be trans for maximal reactivity. Thus, as studied by Robeson and Baxter (11, 45), the four isomers containing 11- or 13-as double bonds react very slowly, whereas the two isomers, the all-trans and the 9-cis, react rapidly. Under proper conditions, the fast-reacting species can quantitatively form adducts, whereas the slow-reacting iso
mers are essentially unchanged (60). In general, the amount of 11- and 13-cis isomers in a mixture is determined by measuring either the ultra
violet spectrum of the isomer mixture before and after reaction with maleic anhydride or the disappearance in Carr-Price reactivity.
g. Opsin Test. The 9-cis-, 11-as-, and 9,13-di-cis-retinals, under proper conditions, will react with opsin isolated from the retina to yield rhodopsin, with an absorption maximum at 500 τημ, or isorhodopsin, with an absorption maximum at 487 ταμ. This method was first proposed by Hubbard et al. in 1953 (36), described further in 1959 (61), and further modified for the 9-cis- and 9,13-di-cis-retinals in 1962 (62). The proce
dure given in the last paper is somewhat complex and must be followed with care. In essence, however, tissues are extracted with diethyl ether, and the extract is concentrated, saponified, and freed of most sterols in a dry ice-acetone bath. The supernatant solution in hexane is chromato- graphed on water-deactivated alumina, and the retinol fraction is oxi
dized by activated M n 02 to retinal. The retinal is suspended in aqueous digitonin, opsin solution is added, and the solution is incubated in the dark at room temperature. Two hours are required for 11-cis- and 9-cis- retinal, whereas 6 hours are needed for 9,13-di-cis-retinal. The amount of rhodopsin or isorhodopsin formed is determined by spectrophotometry, and the amount of 9-cis- or 9,13-di-cis-retinal in the mixture is calcu
lated from suitable equations. The sll-trans- and 13-cis-retinals do not react to an appreciable degree under these conditions, and little or no isomerization occurred during the analysis. The total amount of 9-cis isomers in a group of liver oils varied from 1 to 30% of the total vitamin A content, and hence, the importance of having suitable methods for the detection of individual isomers in vitamin A extracts was clearly demon
strated.
3. Biological Assay
Biological tests have a utility and practicality which cannot be re
placed by specific chemical or physical methods. The physiological re-
sponse of a species to various provitamins, metabolites, isomers, and synthetic compounds which are present in various foodstuffs can only be assessed by over-all physiological response. In addition, the complexities of absorption, inactivation, metabolism, and storage in a given species, all of which affect the relative biological activity of a compound, cannot be predicted by simple chemical tests. Hence, biological assay procedures and chemical or physical methods abet rather than replace each other.
The most commonly used biological methods for retinol are growth- response tests, liver-storage assays in rats and chicks, and the vaginal smear technique. These methods have been reviewed thoroughly by Harris (63) and will not be discussed here. An interesting new procedure termed the electroretinogram technique has been devised to measure the visual threshold of animals (64). By this technique the minimal lumi- nance of a one-fiftieth second flash which just produces a detectable potential from the retina of an experimental animal is measured. Since animals fed diets which are deficient in retinol or are supplemented with retinoic acid quickly show an increase in visual thresholds (65), this procedure is particularly useful in studying the early stages of retinol deficiency.
C. Purification Procedures
1. Extraction Methods
In tissues, lipids are usually present in a conjugated form with pro- tein, carbohydrate, or other cellular elements. For the isolation of intact lipoproteins, which contain retinol and its derivatives, serum or plasma may be fractionated by sedimentation-flotation procedures (66) or sub- mitted to electrophoresis (67). For intracellular retinol derivatives, cells must be ruptured by mild means and various organelles may be frac- tionated by the classical procedures of Hogeboom and Schneider (68).
Further analysis involves isolation of the lipid from other cellular com- ponents by the use of extraction procedures. A number of these proce- dures have been reviewed by Alfin-Slater and Shull in the first volume of this series (69). A commonly used procedure for the extraction of total lipids from a tissue is the chloroform-methanol method of Folch (70, 71).
For the extraction of carotenoids and retinol from serum or plasma, light petroleum-ethanol (2:1) is generally used (48, 72). In conjunction with ethanol, other solvents such as dichloroethane, ethyl acetate, and ether have also been used for the extraction of retinol and its derivatives.
Direct analysis of these extracts by spectrophotometric and colorimetric means is possible, but often saponification with methanolic KOH is ad- visable to remove interfering substances. Recently benzene and cyclo-
hexane have been employed for extraction by Japanese workers (73, 74).
Retinoic acid is not extracted from neutral or alkaline solutions by nonpolar solvents, but is extracted by acetone (38). After acidification of neutral or alkaline solutions, ether, chloroform, or a variety of other solvents may be used for the quantitative extraction of retinoic acid
(38). In general, the extraction and isolation of retinol and carotenoids should be conducted rapidly and with care; dim light, nitrogen, peroxide-
free solvents, and added antioxidants all help to reduce the ever present problems of oxidative destruction and isomerization.
2. Adsorption Chromatography
Columns. Since lipid extracts invariably contain hosts of materials, purification of retinol prior to analysis is often preferable, if not ab
solutely necessary. A large array of adsorbents have been employed for this purpose, which include alumina, calcium carbonate, calcium phos
phate, magnesium oxide, magnesium carbonate, magnesium hydroxide, sodium carbonate, silicic acid, Kieselguhr, bone meal, and calcium hy
droxide (75). Alumina and dicalcium phosphate have been most exten
sively employed for the separation of various carotene classes and of various isomers of retinol, respectively. In the case of alumina, deactiva
tion with water yields the most suitable adsorbent. In general, the sepa
ration of hydrocarbons, retinol ester, retinal, and retinol is best when the alumina is greatly deactivated and hexane and other nonpolar solvents are employed. Alumina may be deactivated in many ways (75). A useful procedure consists of shaking commercial chromatographic alumina
(grade 2) with a suitable portion of water, usually 10% by weight, which is suspended in a large volume of hexane. After 2 hours of shaking, the alumina is filtered and spread on brown paper for evaporation of the organic solvent. The drying time is rather critical, and the alumina should be bottled when it runs freely, but is not completely free of organic solvent (76). On 6% water-deactivated alumina, ^-carotene is eluted with hexane, vitamin A ester with additional hexane, retinal with 1 to 2% acetone in hexane, retinol with 3 to 5% acetone in hexane, and other polar compounds with acetone or more polar solvents (76). Yields from this column are above 80%, which is increased to almost 100% by the addition of γ-tocopherol to the column (62, 77).
Columns of dicalcium phosphate were introduced largely by Hjarde and have been used extensively by his group for the separation of various isomers of retinol and retinol ester (78-81). Satisfactory preparations of dicalcium phosphate would retain retinol from hexane solution, but would release it in the presence of 2 to 7% ether in hexane. In addition, the granulation size must be carefully selected to allow adequate solvent
flow. The activity of the dicalcium phosphate can be reduced by ex
posure to air at room temperature, or it can be increased by heating at 100° to 110°C. The yield of retinol from the column was nearly 100%.
Isomers of both retinol and 3-dehydroretinol could be separated by this column. The elution of retinol isomers occurs in the following order:
11,13-di-as; 11-cis; 13-as; 9,13-di-as; and all-trans. Similarly, the ll-c£s-3-dehydroretinol is eluted before the all-trans isomer.
As might be expected, thin-layer chromatography is also useful for the separation of retinol derivatives. Planta et al. (82) have used plates of silica gel G developed with light petroleum-methylheptenone (11:2) for the separation of various isomers of retinol and 3-dehydroretinol.
Alumina may also be spread on glass plates and developed with a series of organic solvents (83). In the latter case, Brockman Grade 3 to 4 alumina was employed, and samples of various fat-soluble vitamins were visualized after development by treatment with H2S 04 or HC104.
3. Partition Chromatography
Several systems have been devised for the separation of retinol from other components by partition chromatography. Polyethylene granules, Fluoropak 80 and Celite 545 which were impregnated with petroleum ether, isoctane, or polyethylene glycol have been used as the stationary phase (84r-86). Sharp peaks were eluted with little destruction. Paper, impregnated with silicone fluid, paraffin, or Vaseline, has also been em
ployed for the isolation of retinol esters and various oxidized derivatives (87-89). Relatively polar solvents are used to develop these columns and chromatograms. Retinol and 3-dehydroretinol derivatives could also be separated by this procedure (89). Various retinol esters could also be separated by conventional paper chromatography (90).
4. Gas-Liquid Chromatography
Early attempts to isolate retinol and its derivatives by gas-liquid chromatography were unsuccessful, largely due to the formation of an
hydroretinol (91). Under proper conditions, however, methyl retinoate and retinal can be isolated with little destruction, and retinol and retinol acetate are eluted with only minimal conversion to the anhydro form
(57). The most suitable column is 1% SE-30 on silanized 60 to 80 mesh Gaschrom Ρ which has been conditioned at 250° C and treated with β- carotene or some other antioxidant. The column temperature is 150°C and the argon flow rate is about 150 ml per minute. Anhydroretinol and methyl retinoate are quite stable and can be studied at higher tempera
tures with more efficient columns, whereas retinol and retinol acetate must be handled carefully at 150°C and with high flow rates. Different
retention times were observed for various derivatives of retinol. Certainly this tool will be used extensively in the future in studying retinol and its derivatives.
5. Other Methods
For the isolation of retinoic acid, ion-exchange resins such as DEAE- cellulose and Biorad AG2-X8 have been employed (87, 92). Nonionic derivatives pass quickly through the column, whereas retinoic acid is only eluted by acidic solvents.
D. Isotopically Labeled Compounds
Elegant methods for the synthesis of labeled retinol have been devel
oped in the Hoffman-LaRoche Laboratories and are reviewed by Isler (93). The most commonly used labeled retinol derivatives contain C1 4 in the 6,7-positions, or in the 15-position. ^-Carotene labeled with C1 4 in the 6- and 6'-positions or in the 15- and 15'-positions has also been syn
thesized, and many other C1 4- and tritium-labeled carotenoids and β- apocarotenals might be produced by established routes of synthesis (93).
Although labeled retinol cannot readily be prepared by biological means, its most effective precursor in mammalian systems, β-carotene, can easily be biosynthesized from simple radioactive precursors. Uniformly labeled β-carotene has been synthesized from C1 402 by a photosynthetic blue- green alga (94), by Chlorella (76), and by barley seedlings (95). /?-Caro- tene has also been synthesized from carbon-labeled and tritiated acetate by cultures of Phycomyces blakesleeanus (96, 97). These latter materials are purified from lipid extracts by chromatography, removal of sterols, and crystallization of the carotene to constant specific activity. In general, the conversion of radioactivity in acetate to carotene is approxi
mately 0.5 to 1%. Obviously, the presence of a radioactive label in a compound provides a new dimension in following its metabolism, as well as in making chromatographic separations more rigorous. Indeed, the combination of radioactivity measurements with column chromatography, the preparation of derivatives, and gas-liquid chromatography has al
ready been employed (57, 76). Since retinol derivatives are colored, care must be taken in counting them in liquid scintillation systems (98).
Oxidation of the chromophore to colorless substances is often advisable before counting.
III. T H E VITAMIN D GROUP
A. Nomenclature and Structure
A prototype of biologically active compounds in the vitamin D group is given in Fig. 2, and the side-chain structures of the six major vita-
mins D are defined in Table VI. All contain a triene system in a specific configuration and differ only in the nature of the substituent at C-17.
Since the provitamins all contain a 3/?-hydroxy 5-6, 7-8 diene system, the resultant D vitamins derive their nomenclature from the parent sterols. To denote the opening of ring Β between C-9 and C-10, the prefix 9,10-seco is employed, and the position of the hydrogen at C-6
21 22
FIG. 2. The basic structure of the vitamin D group.
is given to define the geometrical isomerism of the 5,6 double bond. In natural vitamins D, the hydrogen at C-6 is on the same side as the 4,5 single bond, and is denoted cis. The 7,8 double bond is essentially parallel to the 5,6 double bond, a configuration which is denoted by the letter "S." Thus, the cleavage product of ergosterol, or vitamin D2,
TABLE V I
BIOLOGICALLY ACTIVE COMPOUNDS OF THE VITAMIN D GROUP
Double bond between
Vitamin C-22 and C-23 R at C-24
D2 Unsaturated CH3
D3 Saturated Η
D4« Saturated CH3
DO Saturated C2H5
D6 Unsaturated C2H5
D7« Saturated CH3
α Isomeric at C-24.
is 3^-hydroxy-9,10-seco-6-cis-6,7-/S-irans-ergosta-5,7,10 (19) ,22-tetraene.
Other products are denoted similarly from the parent substance. The accepted generic name for vitamin D2 is ergocalciferol, and for vitamin D3 the name is cholecalciferol (9). Vitamin D active compounds arise from irradiation of the parent sterol with ultraviolet light. In the case of ergosterol, the first product which can be isolated is pre-ergocalciferol,
which contains a 5:10, 6:7, 8:9 triene system with an open Β ring.
By double bond rearrangement, ergocalciferol, or vitamin D2, is formed.
In addition, side reactions give rise to tachysterol2, lumisterol2, and additional products (99). An excellent summary of the chemistry, syn
thesis, and photochemical reactions of these compounds is given by
Ergosterol over
irradiation/
Ergocalciferol
Lumisterolj— - Tachysterolj, Pyroergocalciferol Isopyroergocalciferol Toxisterol2
Suprasterol-jl Suprasterol2II
DIAGRAM 1. Presumed pathway for the photochemical interconversion of ergo
sterol, ergocalciferol, and other products.
Wagner and Folkers (100), and the mechanism of the reaction is dis
cussed by Havinga et al. (101, 102). The pathway for the conversion of ergosterol into vitamin D2 and other products is given in Diagram 1.
Presumably the activation of other provitamins occurs by a similar mechanism.
B. Analytical Methods
1. Physical Measurements
Some physical properties of members of the vitamin D group, their provitamins, and photochemical intermediates are given in Table VII.
These values were drawn from several sources, but largely from com
pendia (103, 104). All active D vitamins possess a fcrans-triene system and absorb maximally at 265 nut. Provitamins and photochemical inter
mediates also absorb in this region of the ultraviolet spectrum, and the
Ex c m 1 % for all derivatives is between 200 and 700. Although the vitamin
D group does have characteristic spectra, many other biological com
pounds absorb strongly in the same region and completely obscure the vitamin D spectrum of biological extracts. Hence, the direct use of spectra is only warranted with pure substances or highly purified prepa
rations of vitamin D. When excited at wavelengths around 250 τημ, vita
min D fluoresces between 300 and 400 τημ (101), but this quality is also characteristic of many other compounds which absorb in the ultraviolet region.
The infrared spectra of vitamin D2 and D3 have certain like char
acteristics, namely an OH-absorbing band at 2.9 μ, a triene-absorbing
system at 6.05 and 6.14 μ} and a strong band at 10.4 μ. In addition, vita
min D2, which contains a double bond at C-22, has a strong peak at 10.31 μ which is absent in the saturated vitamin D3 (105, 106). Since vitamin D3 is active for both the rat and chick, whereas vitamin D2 is largely effective only for the rat, the relative amount of these two forms of vitamin D is important in pharmaceuticals and food supplements.
T A B L E VII
PHYSICAL PROPERTIES OF THE VITAMIN D GROUP, THEIR PROVITAMINS, AND RELATED COMPOUNDS
Compound Xmax ( Π ΐ μ ) MD2 0 M.p. (°C) Ergocalciferol (D2) 264.5 459 + 102.5°« 115-118
+82.6°*
Cholecalciferol (Da) 264.5 473 +84.8°* 84-85 22-Dihydroergocalciferol (D4) 265 459 +89.3°* 96-98
Ergosterol 271 253 - 1 3 2 . 0 °c 168
282 295
293 153
7-Dehydrocholesterol 271 271 - 1 2 2 . 5 °d 149-150
282 280
293 160
Pre-ergocaleiferol 265 250 — —
Lumisterol2 265 ca. 220 +192.0°* 118
279 226
Tachysterol2 268 280 ca. 463 - 7 0 . 0 ° * —
705 294 ca. 463
Toxisterol2 248 460 - 1 6 . 0 ° ' 50
Suprasterol2I <250 — - 7 6 . 0 °c 104
Suprasterol2H <250 — +63.0°* 110
° In alcohol.
6 In acetone.
< In CHCla.
d In C6H6.
Hence, Morris et al. (107) devised an analytical method for determining the percentage of vitamin D2 by infrared analyses of the 10 to 11 μ area.
A biological sample is saponified, extracted, run through one to four columns of absorbents to remove interfering substances, and then the eluate is evaporated, dissolved in carbon disulfide, and spectra are run.
By a calibration curve which plots the ratio of the relative absorption at 10.31 μ and 10.4 μ against D2 concentration, the percentage of vitamin D2 in the sample may be calculated.
Like retinol, vitamin D is reduced at the dropping-mercury electrode,
and it has a half-wave potential of —2.2 volts in 10% aqueous 0.1 Ν tetrabutyl ammonium hydroxide (25). As might be expected, only a single wave is observed in contrast to compounds having more extensive conjugated systems.
2. Chemical Analyses
a. Antimony Trichloride Reaction. Antimony trichloride reacts with the vitamin D group to give a transient color at 500 τημ with an Et c m 1 %
of 1800 to 2200, depending on the solvent used (108). The presence of acetyl chloride in the assay improves its sensitivity and reproducibility, and the use of ethylene dichloride rather than chloroform has a stabilizing effect on the chromophore (108, 109). The major problem in obtaining valid results is the separation of vitamin D from other interfering substances, which are mainly retinol and its oxidation products. To this end, extracts have been chromatographed on various adsorbents prior to analysis. In re-examining the applicability of the antimony trichloride reaction to pharmaceutical products, Wilkie et al. observed that acetic anhydride quantitatively inhibited the color reaction with vitamin D, while not appreciably affecting the reaction with retinol and other in
terfering substances (110). In Wilkie's procedure, samples of vitamin D are saponified and extracted with ether in the presence of ethanol.
The ether extract is washed with water, dried, evaporated, and dis
solved in a small volume of petroleum ether. The extract is then chromatographed successively on MgO-Hyflo Supercel (5:1) and then on a column of MgO-Hyflo Supercel (1:1). The final eluant in ethylene dichloride is treated with antimony trichloride in the presence of acetyl chloride, and the optical density at 500 τημ is read 30 seconds after the addition of the reagent. The same reaction is conducted in the presence of acetic anhydride, and suitable controls are also run. By the use of suitable formulas, the amount of vitamin D in the sample can be calculated. When the concentration of vitamin D in the original sample is relatively high, the analytical result agrees well with the bioassay analysis. The procedure is much less suitable, however, for biological materials which contain small amounts of vitamin D. Nevertheless, the antimony trichloride procedure is the standard method of choice for chemical analysis of vitamin D content (111).
b. Glycerol Dichlorohydrin. Activated glycerol dichlorohydrin reacts with vitamin D in the presence of acetyl chloride to give a stable chromophore which adsorbs maximally at 410 τημ. In the original procedure, the optical density was read at 625 τη,μ, 15 minutes after the initiation of the reaction (112). In a modified procedure, the optical density at 410 τημ is read 30 minutes after mixing, which yields an
Elcm1% of about 360 (113). Campbell made a careful study of factors
which influence color formation (113). Although the extinction coeffi
cient is only 20% of that obtained with antimony trichloride, oils and pharmaceutical preparations of high vitamin D potency can be readily analyzed by this procedure. Again, when low concentrations of vitamin D are present, interfering substances become critically important. Further modifications of this reaction have recently been made (114).
c. Other Colorimetric Methods. Other procedures have also been employed for the analysis of the vitamin D group. In the presence of perchloric acid, vitamin D forms a carbenium ion which will react with aromatic aldehydes to yield colored end products (115). In addition, the triene system of vitamin D will react with iodine trichloride to liber
ate molecular iodine which adsorbs strongly at 518 ταμ in chloroform (116). Sulfuric acid in the presence of acetic anhydride and dioxane gives a relatively stable green color with vitamin D, which is analogous to the Liebermann reaction with sterols (117). In all cases, the chromo- phore is not specific for vitamin D and is not particularly intense. Hence, as with other methods, interfering substances are an ever present prob
lem. Maleic anhydride will react with the triene system to yield the usual Diels-Alder adduct, and the rate of reaction varies with different photochemical products. Hence, this reaction has been helpful in elucidating the pathway of vitamin D formation from the provitamins
(99, 101).
3. Biological Assay
In view of the lack of specificity in chemical tests, biological proce
dures have been invaluable in the analysis of vitamin D, in spite of the time, expense, and tedium of the procedures. These methods have been thoroughly reviewed (118). Procedures have been defined for the rat, which responds equally to both vitamin D2 and D3, and the chick, which responds to D3, but only 1 to 3% as well with vitamin D2. The most common procedure for the rat is the so-called "line" test (119). In this procedure, depleted rats are fed one to three doses of small amounts of vitamin D, and after a suitable period, the tibias of the animals are removed and scored for calcification. The score is proportional to the log dose. The most common method for chicks is the tibia-ash proce
dure (120). Chicks are given small doses of vitamin D for a 3- to 6-week period. Thereafter, the tibias are removed, extracted with ethanol, dried, and ashed at high temperatures. The ratio of the weight of ash to the dry weight of tissue is proportional to the logarithm of the dose. Other procedures involve comparative analysis of the knee joint by X-ray after the depletion and treatment period or the incorporation of P3 2 into bones of the paw. The growth test is fairly accurate when the chick is employed, but the rat growth test is not too satisfactory (118).
C. Purification Procedures
1. Extraction Methods
When information about the association of vitamin D with some cellular organelle, protein, or lipoprotein is desired, careful fractionation methods for these entities must be employed (66, 68). In the past, how- ever, most interest has been elicited in the isolation of a lipid extract and the analysis of its content of vitamin D. A number of common lipid extractants may be used for this purpose such as chloroform- methanol (70, 71), ethanol-ether (110), or other similar systems, either before or after saponification. Since vitamin D contains an unsaturated conjugated system, care must be taken to avoid oxidation during its iso- lation and analysis. The incorporation of antioxidants in solvents and in columns is a useful precaution (110).
2. Adsorption Chromatography
In view of the lack of specificity of colorimetric tests and the presence of retinol and other interfering chromophores in most biological and pharmaceutical extracts, column chromatography on a variety of adsorb- ents has been extensively explored. These adsorbents include alumina
(121, 122), superfiltrol, an activated bentonite clay (123), and floridin earth (124-126). Although magnesium oxide by itself is not too useful (108), various mixtures of magnesium oxide with Celite of Hyfio Supercel have been extensively used (107, 108, 110, 127-129). Mixtures of alumina and superfiltrol have also been employed (130), as well as a number of other systems. Celite with polyethylene glycol 600 as a stationary phase has also been employed for the separation of vitamin D and vitamin A (107, 131). Filter paper which is impregnated with alumina, calcium phosphate, magnesium sulfate, or stearatochromic chloride (Quilon) has also been employed for the separation of the D group from other lipids (132-135). Most of the above methods have been useful in separating the vitamin D group from other classes of lipids. By use of columns of silicic acid, however, Norman and DeLuca were able to separate mixtures of vitamin D2, ergosterol, and tachy- sterol2 (136). In this system, the sample is applied in Skellysolve B, and the chromatogram is developed with 10% ether in Skellysolve B.
Compounds were eluted in this order: an unknown, vitamin D2, tachy- sterol2, and ergosterol.
It is not surprising that thin-layer chromatography has also been applied to the problems of vitamin D separation. For example, vitamin D can be separated from carotenoids and sterols on silica gel G which is developed with hexane, 10% ethyl acetate in hexane, or chloroform. The
compounds were visualized by spraying with 20% phosphotungstic acid followed by heating (137). Vitamin D may also be separated from vitamin A and other substances on alumina plates (83). Products of ergosterol irradiation are separated on thin-layer plates of Cab-O-Sil silica gel which is developed with 5% or 10% acetone in Skellysolve Β or with chloroform. Six distinct spots were evident, of which three were ergosterol, vitamin D2, and tachysterol2 (136). Undoubtedly many addi
tional systems will be defined to aid in the resolution of specific prob
lems of isolation.
3. Partition Chromatography
Paper impregnated with paraffin oil (138, 139) or olive oil (140) allows the separation of the vitamin D group from lipid impurities.
Fluoropak 80, which is impregnated with isoctane and developed with 90% methanol, is useful for the separation of vitamin D from vitamin A and other lipids (86).
4. Gas-Liquid Chromatography
When vitamin D2 is applied to a 6 ft X 4 mm column of 0.75%
SE-30 silicone on 100-140 Gas Chrom Ρ at 222°C, two distinct peaks appear in the effluent (141). The retention times for these peaks is identical with those of the thermocyclization products of vitamin D, pyrocalciferol and isopyrocalciferol. In addition, the ultraviolet and infrared spectra of the eluted compounds are the same as the pyrocal
ciferol derivatives. The ratio of pyrocalciferol to isopyrocalciferol was 1.8 at a series of temperatures. Vitamin D2 behaved similarly on a neopentyl glycol succinate column, and vitamin D3 gave analogous breakdown products (141). When trifluoroacetate or trimethyl silane derivatives of vitamin D are used, two peaks result from vitamin D2 and two others from vitamin D3 (142). The peaks obtained from D2 and D3 partially overlap. Although the use of gas-liquid chromatography for the isolation of vitamin D from tissues is possible, great difficulty is experienced in removing the relatively large amounts of cholesterol which are present (142). Since relatively high temperatures are re
quired to volatilize these substances, it is difficult to imagine a suitable procedure for inhibiting these cyclization reactions.
D. Isotopically Labeled Compounds
In view of the difficulties of biological assay, the nonspecificity of color reactions, and the low nutritional requirement for vitamin D, the development of methods for the production of radioactive vitamin D is most welcome. Certainly studies on the metabolism and molecular func-
tion of vitamin D will be greatly abetted by the availability of labeled vitamins with high specific activity. In connection with studies on the photoisomerization of ergosterol, Havinga and Botts first prepared 3-C1 4- ergocalciferol by chemical synthesis (143). With the intention of preparing vitamin D2 for metabolic studies, Kodicek grew Saccharomyces cere
visiae LK2-G12 on l-C1 4-acetate, purified the resultant OMabeled ergos
terol (144), irradiated the solution, and isolated vitamin D2. Although this material had a specific activity of only 0.01 μα per mg, Kodicek was able to follow the distribution, excretion, and transport of vitamin D2 in the mammal (145-148). Labeled vitamin D2 with a specific activity of over 1 ,/xc per mg was also prepared and studied (146). A summary of methods for the synthesis of labeled vitamin D is given in Table VIII. A
T A B L E V I I I
METHODS FOR THE SYNTHESIS OF LABELED VITAMIN D
Specific
Labeled activity
Compound atom Method Guc/mg) Reference
Ergocalciferol 3-C1 4 Chemical synthesis 0.007 143 C1 4 Irradiated biosynthetic C1 4- 0.01 144
ergosterol 1.15 146
U-C1 4 Irradiated biosynthetic U-C14-ergosterol
10.0 149
H3 Tritium gas exchange with ergosterol
8.0 151
Cholecalciferol 4-C1 4 Not given Not given 86
7-H3 Not given ca. 0.02 86
H3 Tritium gas exchange with 7-dehydrocholesterol
18.8 151
H3 Tritium gas exchange with cholecalciferol (-198°)
216.0 154
H3 Exchange of tritiated acetic 3.0 154a acid with cholecalciferol
similar procedure was used by Schaltegger in preparing a more radioactive compound (149). Uniformly labeled ergosterol, which was grown at the Radiochemical Center in Amersham, England, on uniformly labeled sugar, was irradiated with ultraviolet light. The resultant ergocalciferol was carefully purified by chromatography on alumina, preparation of the 3,5-dinitrobenzoate ester, rechromatography on alumina, hydrolysis of the ester, chromatography again on alumina, and crystallization to a constant specific activity from acetone. The final product was pure by several criteria and was obtained in 13% yield. This material, which has