Introduction
The agricultural sector in Kosovo is highly subsidised.
The Ministry of Agriculture, Forestry and Rural Develop- ment (MAFRD) has been implementing the Direct Payments (DP) Program since 2009. This policy involves several direct payment schemes, such as a subsidy per head (referred to later as the Subsidy per Head Scheme (SPHS)) and subsidy per hectare of planted grains and subsidy on milk quality (MAFRD, 2010). All these subsidies are coupled and are intended to help Kosovo dairy farmers a) increase income, milk production and quality; b) intensify the use of currently unused land and pastures; c) improve input quality, food safety and food quality standards; and d) develop a manage- ment capacity compliant with European Union (EU) require- ments. Over the past years, agricultural economists have been concerned with the effects of direct payments (Bajrami and Ostapchuk, 2019). A number of empirical studies have shown efforts to estimate their effect, predominantly on farm level outcomes, such as productivity (Guan and Oude Lan- sink 2006; Bezlepkina and Oude Lansink, 2006; McCloud and Kumbhakar, 2008; Henningsen et al., 2009; Rizov et al.
2013), farm structure (Kim et al., 2005; Ahearn et al., 2006), and farm income (Dewbre and Mishra, 2007).
Empirical findings on subsidies` effects on these out- comes are mixed. Several studies have shown that subsidies positively affect farm productivity (Guan and Oude Lansink 2006; McCloud and Kumbhakar, 2008), while some other studies have found a negative relationship between subsidy and production (Bezlepkina and Oude Lansink, 2006; Hen- ningsen et al., 2009). In line with the productivity findings, a number of studies also agree that subsidies contribute to farm income (Pufahl and Weiss, 2009; Bojnec and Fertő, 2019).
Overall, there has been less research on the effects of cou- pled direct payments. This might be due to the decoupling of direct payments, which occurred in many countries, spe- cifically across the EU. However, coupled direct payments
are still applied, particularly across some pre-candidate and EU candidate countries. Their continued application might result in substantial disadvantages for farm development.
Among the main drawbacks, the literature highlights that coupled payments might hinder further farm investments, disincentivize farm size growth, productivity improvement and diversification, and lessen support for small farms since most support is intended for large farms. There is consid- erable empirical evidence showing that coupled payments negatively affect productivity (Karagiannis and Sarris, 2005;
Zhengfei and Oude Lansink, 2006; Rizov et al. 2013).
For example, Rizov et al. (2013) investigated the impact of the Common Agricultural Policy (CAP) on the total EU commercial farm productivity and found that subsidies nega- tively impacted farm productivity. Henningsen et al. (2009) showed that coupled subsidies have a considerable effect on input use and output level. In terms of farm size growth and structural transformation, Edmeades et al. (2019) has ana- lysed the effects of coupled payments on the agricultural sec- tor of Croatia. The report highlights that coupled payments have slowed down the structural transformation process of Croatian agriculture since large farms absorb the majority of support.
Although subsidies` effects have been studied by a plethora of authors, there is little evidence on the observable effects of coupled direct payments on the livestock sector.
Furthermore, the literature gap is wider with regard to pre- candidate countries for the EU. In this paper, we examine empirically the actual effects of a coupled subsidy program.
For this purpose, the livestock sector of a pre-candidate country - Kosovo - was chosen.
Over the years, Kosovo’s livestock sector has been one of the key drivers of agricultural development. However, this sector suffered severe damage during the 1998–1999 war.
More than half of the livestock were killed or stolen, and about 40% of infrastructure and machinery was destroyed (MAFRD, 2003). Nevertheless, during the post-war period, Egzon BAJRAMI*, Eric J. WAILES**, Bruce L. DIXON**, Arben MUSLIU*** and Alvaro DURAND-MORAT**
Do coupled subsidies increase milk productivity, land use, herd size and income? Evidence from Kosovo
This study assesses the effectiveness of the Subsidy per Head Scheme (SPHS) in increasing milk productivity, land use, herd size and income in dairy farms across the seven regions of Kosovo. SPHS represents one of the largest coupled subsidy programs in the agricultural sector of Kosovo in terms of farmer participation and budget allocation. We use a Propensity Score Matching approach to assess the impact of this program by comparing a group of participants with a group of non-participants during the 2013–2014 farming seasons. We test the robustness of the impact results using four different matching algorithms.
Results reveal SPHS was not effective in increasing land use, gross income and farm size (number of cows), although SPHS had a limited impact on improving milk productivity. In addition, the study highlights the need to reformulate coupled subsidies and develop new, complementary strategies that address farmers’ needs more efficiently.
Keywords: coupled subsidy, propensity score matching, impact evaluation, Kosovo JEL classification: Q18
* PhD Student, Leibniz Institute of Agricultural Development in Transition Economies (IAMO). Theodor-Lieser-Straße 2, 06120 Halle (Saale), Germany.
Corresponding author: bajrami@iamo.de
** Department of Agricultural Economics and Agribusiness, University of Arkansas, USA
*** Department of Agricultural Economics, Faculty of Agriculture and Veterinary, University of Prishtina, Kosovo Received: 19 July 2019, Revised: 14 October 2019, Accepted: 21 October 2019.
the livestock sector, specifically dairy, has emerged as one of the most important agricultural sectors, contributing about 10% to the total national GDP (Bytyqi et al., 2014).
In 2015, there were over 258 thousand cattle in Kosovo, distributed across more than 63 thousand households, with an average herd size of four cows (MAFRD, 2016). Most of Kosovo`s dairy farms are characterized by low milk produc- tivity, poor infrastructure and inefficient land use (Miftari et al., 2014). Milk yields per cow are low compared to other European countries. In 2014, the estimated average milk yield per cow in Kosovo was 2,075 litres per year (MAFRD, 2015), while the EU-28 average was 6,727 litres (European Commission, 2015). Primary dairy products are produced predominantly by the large number of subsistence and semi- subsistence dairy farms in the country. During the post-war period, dairy farmers in Kosovo faced the challenges posed by small-scale dairy farms, characterized by low milk pro- ductivity, traditional breed genetics, poor feeding, poor hygiene and breeding conditions and fragmented land use.
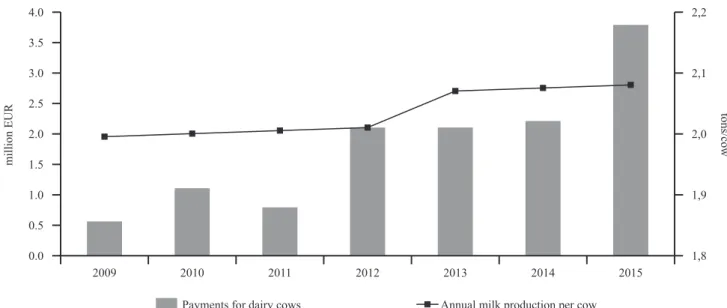
These challenges caused low efficiency (Bajrami et al., 2017) even though the dairy sector was heavily subsidised from 2009 to 2016, mainly by direct payment schemes from the government (Figure 1).
One of the main objectives of the SPHS is to increase milk production. Although annual milk production per cow increased 0.7% a year in the period 2009–2015, Kosovo’s cattle inventory decreased drastically over the same period.
Dairy cow numbers declined by 5% annually, and total milk production declined by an annual average of 4.3%.
MAFRD spent over €50 million to implement all (crop and livestock) schemes of the DP program from 2009 to 2014. In addition, since 2009 MAFRD has been allocat- ing a significant portion of its budget to implementing the SPHS, where over €3.7 million was allocated in 2015, a 71%
budget increase for this scheme as compared to 2014 (Figure 1). Although significant budget has been allocated to SPHS, to date there has not been any systematic evaluation of this programs actual impact on the Kosovo dairy sector, particu-
larly in terms of increasing land use, income, herd size and improving production.
The present study addresses this gap in the literature by investigating the effects resulting from the SPHS policy on Kosovo’s dairy sector. We assess the impact of SPHS using survey data. Specifically, we use farm-level survey data col- lected from randomly selected dairy farmers (n = 327) to esti- mate the SPHS effects on its main three objectives (increas- ing milk production, intensifying land use, improving farm income) and the SPHS specific objective of increasing herd size (farm structure). The survey data are analysed using a Propensity Score Matching (PSM) model. We assess the robustness of the estimated results by employing four alter- native matching algorithms.
Material and methods
A survey instrument was developed, pre-tested and administered to dairy farmers in Kosovo during a period of two months, specifically from mid-July to mid-September 2015. Primary data on farmer socio-economic characteristics (e.g., age, gender, education, farming experience, household size), their dairy activity (farm size, farm assets, milk pro- duction and quality, dairy product sales) and participation status in different governmental programs were collected from 327 randomly selected dairy households across all the seven regions of Kosovo.
In order to estimate the impact of SPHS on milk produc- tivity, land use, farm structure and farm income, two groups of dairy farmers (participants and non-participants in the SPHS) were randomly selected for the study. In most of the reviewed studies using the PSM approach, the non-partici- pants’ groups are at least twice as large as the participants’
group, mainly due to better chances to obtain more matched observations with members of the participant’s group (Pufahl and Weiss, 2009; Becerril and Abdulai, 2010; Birol et al., 2011; Kabunga, 2014). Therefore, for this study, a proportion
0.0 0.5 1.0 1.5 2.0 2.5 3.0 3.5 4.0
Payments for dairy cows
2015 2014
2013 2012
2011 2010
2009
1,8 1,9 2,0 2,1 2,2
Annual milk production per cow
million EUR tons/cow
Figure 1: Budget allocation for SPHS (€) and annual milk productivity per cow (t).
Source: Constructed by authors using data retrieved from MAFRD (2016).
size of 1:3 (participants to non-participants) across the seven sampled regions was used to increase the chances of hav- ing more matched observations. Subsequently, the number of respondents per region was estimated using a weighting technique on the population list of participant farmers in the SPHS in 2014. All sampled farmers were listed on MAFRD records as having five1 or more dairy cows in 2014, which is also the SPHS support eligibility criteria MAFRD applies.
In contrast to the EU, where farmers receive subsidies non- exclusively linked to production (Takácsné-György and Takács, 2012), SPHS is a subsidy coupled to the number of dairy cows.
In order to isolate the effect of SPHS, only those obser- vations that received support exclusively from SPHS were included. Ninety out of the 327 sampled dairy farmers were supported by more than one direct payment scheme and, therefore, were removed from the analysis. Eighty-eight observations were dropped due to missing data, leaving a total of 149 observations for further analysis, precisely 40 participants and 109 non-participants.
Specification of the PSM Impact Evaluation Model
Estimating the effect of participating in a specific pro- gram is the main goal of evaluation studies. A number of evaluation techniques can be utilized to estimate treatment effects. According to Pufahl and Weiss (2009), evaluation studies estimate the mean effect of participating in a pro- gram. Among a plethora of techniques, PSM is a widely used approach in evaluation studies. It can be used as a combi- nation of methods; however, it is also commonly used as a single approach (see: Becerril and Abdulai, 2010; Birol et al., 2011; Kabunga, 2014). Our PSM impact evaluation model estimates the mean effect (impact) of the SPHS on milk productivity, land use, farm structure and farm income.
Following Kabunga (2014), this impact is estimated as the average treatment effect on the treated (ATT) participants in the SPHS program:
,
ATT E y y D E y D E y D
1 1
1
i i i i i
i i
1 0 1
0
= - = = = -
- = h
h h
6
6 6 (1)
where E is the expectations operator, y1i is the observed out- come of farmer i (participant), y0i is the observed outcome of the same farmer i (non-participant) and Di = 1/0 denotes whether the farmer participated in the SPHS or not.
Missing data in the counterfactual is a major issue in evaluation studies since we cannot observe the outcomes of participating farmers (treated) had they not been treated (y1i | Di = 1). Therefore, the mean effect of program participa- tion is estimated by constructing a control group similar to the treated group, which enables measuring the outcome that would have been observed for the treated group if they had not been treated. While a simple comparison of the mean outcomes between treated and non-treated groups seems
1 Due to random selection, some of the visited farmers had fewer or more cows compared to the number of cows recorded on the list. Between the period that they were registered in the program and our visit, they decreased or increased their number of cows.
intuitive, it can lead to biased results. One potential source of bias is that treated and non-treated farmers may differ in terms of observed characteristics (covariates) such as experi- ence in milk production, formal education, age of the farm manager, corn planted area, whether the farmer uses grazing or not and whether they keep farm records. A second source of bias between these two groups might be the differences in unobserved characteristics such as motivation and manage- rial skills. Rosenbaum and Rubin (1983) introduced the PSM to control for the observed characteristics and subsequently estimate the mean outcomes of participants and non-partici- pants, respectively.
A set of observable covariates must be chosen for the purposes of matching prior to applying the matching pro- cedures and constructing comparison groups. Caliendo and Kopeinig (2008) emphasize that only covariates that simulta- neously influence the participation decision and the outcome covariate should be included, while covariates that might be affected by the treatment should not be included. Eco- nomic theory and the previous knowledge of the researcher regarding the program and observed units should be used in specifying the model (Sianesi, 2004; Smith and Todd, 2005).
Experience in milk production, corn planted area, formal years of education, farm manager age, a binary variable indicating if the farm manager keeps farm records or not and a binary variable for grazing or non-grazing production systems were used as observed covariates to conduct match- ing. It is assumed covariates simultaneously could affect the outcome and the participation decision.
Following Kabunga (2014), the observable impact of SPHS was measured in two stages. In the first stage, pro- pensity scores P(xi) for each individual farmer were gener- ated using a probit model. The propensity score indicates the probability of a dairy farmer joining the SPHS program given the observed covariates, xi:
( )
Pr^P1=1 xih=p xi, (2) The control (non-participants) group was constructed by matching the participants with non-participant farmers based on their propensity score values. Observations without an appropriate match were dropped from further analysis.
Subsequently, prior to estimating the ATT, two conditions must be satisfied: the assumption of Conditional Independ- ence and the assumption of Common Support. Following Rosenbaum and Rubin (1983), the Conditional Independ- ence Assumption (CIA) can be specified as follows:
( , )y y1 0 =D X, (3)
stating that a given set of observable covariates X are not affected by treatment, and potential outcomes y are inde- pendent of treatment assignment D (Khandker et al., 2010).
As noted in Khandker et al. (2010), Rosenbaum and Rubin (1983) called this assumption “un-confoundedness”, imply- ing that uptake of the program is based entirely on observed covariates. This assumption reduces bias when the untreated units are constructed.
Following Khandker et al. (2010), the Common Support assumption, which can be specified as
( ) , P D X
01 =1 11 (4)
allows that treatment observations have comparison observa- tions “nearby” in the propensity score distribution (Heckman et al., 1999). Basically, this assumption ensures that partici- pants and non-participants have an equal chance of being either an adopter or non-adopter; therefore, participation in the treatment is not exclusively controlled by an unobserv- able variable(s) (covariate(s)). When these two assumptions are satisfied, the treatment assignment is said to be strongly ignorable (Rosenbaum and Rubin, 1983), allowing for unbi- ased mean comparisons.
In the second stage, the ATT of SPHS was estimated.
We measure the impact of SPHS on four outcome variables:
milk productivity per cow per day (y1), land use (y2), gross income (y3) and farm size (number of cows (y4)). The impact of SPHS was measured separately for each of these four outcome variables. Given that CIA and Common Support assumptions hold, following Kabunga (2014), the PSM esti- mator for ATT was measured as follows:
, ( ) , ( ) , ATT E y D p x
E y D p x 1 0
psm i i i
i i i
1 0
= = -
- 6 =
6
@
@ (5)
where ATTpsm measures the mean difference of the outcome of interest (e.g., milk productivity per cow) between the par- ticipants and non-participant farmers with similar propensity scores, p(xi). The variable p(xi) denotes the estimated propen- sity score for farmer i. These observations are balanced on their propensity score and lie within the region of common support (Kabunga, 2014). In other words, the PSM estimator is simply the mean difference in outcomes over the common support, properly weighted by the propensity score distribu- tion of participants (Caliendo and Kopeinig, 2008).
Before estimating the ATT, treated farmers must be matched with non-treated farmers (control). Treated units must be similar to non-treated units in terms of observed characteristics unaffected by participation. Therefore, some non-treated units might be dropped to ensure comparability (Khandker et al., 2010).
Treated units were matched with non-treated units based on the estimated propensity scores, constructed by the selected observed covariates listed above. In total, four matching methods were used to match treated with non- treated farmers: the Nearest Neighbour Matching (NNM), Caliper or Radius Matching, Stratification and Interval Matching, and Kernel-based Matching method (KBM). The different matching methods were used to measure the robust- ness of the results to the matching method (Kabunga, 2014).
In NNM, each treatment unit is matched to a compari- son unit with the closest propensity score. The number of matched units (n) is set up prior to matching (usually n = 5 is used). NNM can be conducted with or without replace- ment, where with replacement approach indicates that the same non-participants (non-treated farmers) can be used as a match for different participants (treated farmers). Following Khandker et al. (2010), NNM can be specified as follows:
min , p p
k D p p
i j 0 i k
- = !
= -
" ," , (6)
where pi denotes the propensity score of treated farmer i, and pj denotes propensity score of the non-treated farmer. The difference in propensity scores for a participant and its clos- est non-participant neighbour may be very high with NNM.
Therefore, this matching method may result in poor matches.
The Caliper or Radius Matching method addresses the issue of large differences in propensity scores between matches by imposing a threshold “tolerance” or caliper on the maximum propensity distance2. Therefore, caliper pro- vides a certain range where treated units can be matched (with replacement) with non-treated units (Khandker et al., 2010). Caliper or Radius Matching (E) can be specified as follows (Heinrich et al., 2010):
, E Y N1 Y Y
( )
i j i
i N
1 0
1
D = -
=
^ h
/
6 r @ (7)where , E Y N1 Y Y
( )
i j i
i N
1 0
1
D = -
=
^ h
/
6 r @ denotes the average outcome for all comparison units who are matched with case iE Y N1 , Y Y ,( )
i j i
i N
1 0
1
D = -
=
^ h
/
6 is the outcome for case r @ i, and N is the number of treated cases. Therefore, this approach does not limit the number of matches with a given participating dairy farmer, as long as the units are “close”enough (Heinrich et al., 2010).
Stratification and Interval Matching divide the common support of the propensity score into a set of intervals (strata) and afterwards, the mean outcome difference (impact) between treated and non-treated group within each interval is calculated. One of the main issues with this approach is selecting the number of strata to use. As cited in Caliendo and Kopeinig (2008), Cochran (1968) demonstrated that five subclasses are often enough to remove 95% of the bias asso- ciated with a given, single covariate. According to Aakvik (2001), one way to justify the number of strata used is to check the balance of the propensity score or the covariates within each stratum, implying that the estimated propensity score is appropriate only if it balances covariates.
Finally, the KBM method uses a weighted average of the propensity scores of all non-participants to construct the counterfactual match for each participant. KBM assigns weights to each non-participant farmer and subsequently, farmers are matched based on these weights. Following Khandker et al. (2010), KBM can be specified as follows:
( , )i j ,
K Pa P K a
P P
KBM
k C n
k i
n
j j
~
R
= -
-
!
a a
k
k (8)
where ω denotes the estimated weight, Pi denotes the pro- pensity score for participant i, Pj is the propensity score for the non-participant j, K denotes the Kernel function and αn denotes the bandwidth parameter.
These matching procedures need to be checked for bal- ance within the distribution of the observed covariates in both treated and non-treated groups (Kabunga, 2014). Basi- cally, this procedure compares the covariates that are used
2 Caliper represents the maximum tolerance level or maximum propensity score dis- tance by which a match can be made (Heinrich et al., 2010). As noted by Smith and Todd (2005), a possible drawback of caliper matching is that it is difficult to know a priori what value for the tolerance level is reasonable.
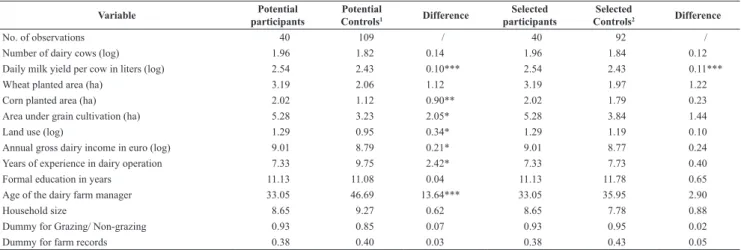
groups (participants and non-participants). After matching, there should be no statistical mean differences for the selected covariates between these groups. Therefore, to examine mean differences in observed characteristics between participants and non-participants, t-tests were performed (see Table 3).
Dairy farmers (SPHS participants and non-participants) differed in terms of number of dairy cows, land use, gross dairy income, experience, age and education (see Table 3).
On average, participants had 15% more dairy cows, and 2.05 more planted hectares with grains compared to non-partici- pants. In contrast, non-participants had on average 2.42 more years of experience in dairy operation and were on average 14 years older compared to participants. However, partici- pant dairy farmers were better off in several other character- istics compared to non-participants. Specifically, participants had, on average, more years of education, higher annual gross dairy income, and most importantly, even for the four outcome variables (daily milk yield per cow, land use, gross income and number of dairy cows), SPHS participants were better off. Daily milk yield per cow for the participants (non- participants) group was estimated at 12.7 (11.4) litres on average, their farms averaged €8,185 (€6,568) annual gross income from the dairy operation, were using on average 3.6 ha (2.6 ha) for grains and other crops and had, on average, 7.1 (6.2) number of cows. Prior to matching, significant differences were found for daily milk yield per cow, corn planted area, total grains planted area, total land use, annual for matching, before and after matching to check for any
remaining differences after conditioning on the propensity score (Caliendo and Kopeinig, 2008). For example, formal education in years is compared prior to matching and after matching. Stata was utilized for estimation purposes.
Results and discussion
Table 1 reports the summary statistics for farm and household characteristics of sampled dairy farmers.
Estimated average daily milk production per cow is 11.88 litres per cow, amounting to 3,623 litres of annual produc- tion over 305 days of lactation. This average differs mark- edly from MAFRD (2015), where average annual milk pro- duction per cow in Kosovo in 2014 was estimated at 2,075 litres per cow. However, this difference is expected since the MAFRD estimate included all dairy farms in Kosovo, while our sample includes only the farms that are or potentially could be SPHS participants. These farms are considered to be commercial and semi-commercial, indicating their pro- duction levels might be higher due to market participation.
Nushi and Selimi (2009) report milk yields in Kosovo vary from 1,500 to 6,000 litres per cow, depending on the farm and breed. A minimum of five dairy cows owned is a condi- tion for participating in the SPHS program. Dairy farmers in the selected sample have an average of 7.06 dairy cows.3 According to MAFRD (2015), the average number of cattle in agricultural households in Kosovo is four.
Dairy operations average €8,030 in annual gross income.
This mean is very similar to the average annual gross income for all agricultural household types in Kosovo which MAFRD (2015) estimates at €8,466. In terms of experience, dairy farmers in this sample had an average of nine years of experience in dairy operations. Further, they averaged 11 years of formal education.
Results from Propensity Score Matching (PSM) Since SPHS was implemented in both years 2013 and 2014, two groups of farmers (participants and non-partici- pants) were formed. Participants were SPHS participants only in 2014, while non-participants could be from 2013 and/or 2014. Farmers were proportionally distributed among the seven regions based on the number of dairy farmers per region (Table 2).
Twenty-six per cent of these dairy farmers were partici- pants, while the majority, more than 73%, were non-partici- pants in SPHS. At the regional level, farmers from Prishtina and Peja constitute the highest share of the sample, while Ferizaj and Gjakova constitute the lowest participation num- bers. From the total sample of 149 dairy farmers, a sample of 132 was used for matching purposes – since the 17 omitted observations (non-participants) did not satisfy the common support criteria.
This sample was selected based on several covariates (experience, education, age, corn planted area, farm records and grazing) that help to increase the balance between the two
3 PSM sample was truncated at four cows per farm since MAFRD supported also farmers with four cows in 2014.
Table 1: Summary Statistics: Farm and Household characteristics.
Variable Description Mean S.D.1
Nocows Number of dairy cows per dairy farm 7.06 3.51 Mcowday Daily milk production per cow
(liters/cow) 11.88 1.98
Mcowyear Annual milk production per cow (liters/
cow) 3,623.97 604.90
Dailycons Daily milk consumption per person (kg/
person) 0.61 0.13
Grains Area planted with grains (ha) 3.78 4.41
Wheat Area planted with wheat (ha) 2.36 3.14
Corn Area planted with corn (ha) 1.36 1.81
Landuse Total land use (ha) 4.00 4.54
Dairyincome Annual gross dairy income (€) 8,030.59 4,949.23 Experience Experience in years in dairy operation 9.10 6.06
Education Formal education in years 11.09 2.83
Age Age in years 43.03 17.85
Household Number of household members 9.10 4.84
Grazing If the farmer uses grazing (yes=1) 0.87 0.33 Barn If the farmer keeps cows tied in the barn
(yes=1) 0.97 0.16
Frecords If the farmer keeps farm records (yes=1) 0.40 0.49 N = 149.
1S.D. - Standard Deviation.
Source: authors
Table 2: Number of sampled participant and non-participant dairy farmers by region.
Region
Ferizaj Gjakova Gjilan Mitrovica Peja Prishtina Prizren Total
Participants 1 3 1 2 14 12 7 40
Non-participants 2 4 15 8 24 34 22 109
Total 3 7 16 10 38 46 29 149
Source: authors
gross income, experience in dairy operation and age of the farm manager. In contrast, means of demographics such as education and household size did not differ significantly between potential participants and potential non-participants (see Table 3).
The initial differences between SPHS participants and non-participants are a potential source of biased estimates of program impact. Therefore, eliminating the initial statistical differences implies, for example, better-off farmers are not more likely to participate in the program; thus, all the dairy farmers in the selected sample have an equal chance of being an adopter or non-adopter relative to their propensity scores.
As noted in Kabunga (2014), this suggests that there is no positive selection bias in adoption behaviour. The summary statistics from Table 3 suggest there is no statistical differ- ence between selected participants and selected controls (non-participants) on selected covariates for matching.
Results from PSM for daily milk production, land use, number of cows and gross income
The selection of matching covariates was based on the previous studies in the dairy sector in Kosovo (Musliu et al., 2009; Miftari et al., 2010), previous studies of impact assess- ments using PSM in the dairy sector (Kirchweger and Kan- telhardt, 2012; Kabunga, 2014; Rawlins et al., 2014; Alemu and Adesina, 2015) and the relevant theory and institutional settings following Smith and Todd (2005). In addition, the selected variables were tested for correlation with the treat- ment variable (SPHS participation).
Propensity scores for each observation were generated by an estimated Probit model. The dependent variable is par- ticipation/non-participation coded as 1 for participants and 0 otherwise (see Equation 2). Estimated Probit coefficients are reported in Table 4.
This Probit model was used to measure the impact of the SPHS on the four outcomes discussed above. For the esti- mated Probit model, the pseudo-R2 is above 0.14, indicating a good model fit (Kabunga, 2014). Caliendo and Kopeinig (2008) argue that the pseudo-R2 indicates how well the regressors explain the participation probability and its value
should be fairly low. Second, most variables included in the model have the expected signs. Farmers with more experi- ence, more years of education, older farmers and those who keep farm records are less likely to join the SPHS program.
In contrast, farmers using grazing and growing corn are more likely to participate in SPHS. Among these variables, age is highly significant (p < 0.01). Corn is statistically significant (p < 0.05), implying farmers planting more corn are more likely to join the program. There was no significant relation- ship between SPHS participation and experience, education, grazing and farm records.
King and Nielsen (2019) critique propensity score matching for producing biased estimates and being less efficient than other matching methods. Much of the cause for PSM inferiority results from “pruning”, in other words discarding observations that do not match well with other observations. With this in mind, we note that after discard- ing the 17 observations that lack common support, the means of the independent variables in the Probit model show no statistically significant differences (p<0.05) which implies some balance between treated and control observations.
King and Nielsen (2019) note that reducing imbalance leads to less biased estimates.We also note that two of the match- ing methods used - stratification matching and KBM - use all 132 observations, thus avoiding some of the bias induced by pruning.
Table 3: Difference in mean for the matching and outcome variables for potential and selected participants and non-participants (controls).
Variable Potential
participants Potential
Controls1 Difference Selected
participants Selected
Controls2 Difference
No. of observations 40 109 / 40 92 /
Number of dairy cows (log) 1.96 1.82 0.14 1.96 1.84 0.12
Daily milk yield per cow in liters (log) 2.54 2.43 0.10*** 2.54 2.43 0.11***
Wheat planted area (ha) 3.19 2.06 1.12 3.19 1.97 1.22
Corn planted area (ha) 2.02 1.12 0.90** 2.02 1.79 0.23
Area under grain cultivation (ha) 5.28 3.23 2.05* 5.28 3.84 1.44
Land use (log) 1.29 0.95 0.34* 1.29 1.19 0.10
Annual gross dairy income in euro (log) 9.01 8.79 0.21* 9.01 8.77 0.24
Years of experience in dairy operation 7.33 9.75 2.42* 7.33 7.73 0.40
Formal education in years 11.13 11.08 0.04 11.13 11.78 0.65
Age of the dairy farm manager 33.05 46.69 13.64*** 33.05 35.95 2.90
Household size 8.65 9.27 0.62 8.65 7.78 0.88
Dummy for Grazing/ Non-grazing 0.93 0.85 0.07 0.93 0.95 0.02
Dummy for farm records 0.38 0.40 0.03 0.38 0.43 0.05
Significance levels: * p<0.05, ** p<0.01, *** p<0.001;
1Potential controls – Potential non-participants;
2Selected controls – Selected non-participants.
Source: authors
Table 4: Probit coefficient estimates for the PSM.
Dependent variable is SPHS 1/0 Coefficient S.E.1
Experience -0.01 0.02
Corn 0.16* 0.08
Records -0.22 0.25
Education -0.02 0.04
Grazing 0.79 0.45
Age -0.03** 0.01
Constant -0.12 0.70
N 149
LR χ2 24.95
Pseudo-R^2 0.14
Significance levels: * p < 0.05, ** p < 0.01, *** p < 0.001.
1S.E. - Standard Error Source: authors
The impact of the SPHS program on milk productivity per cow, land use, gross income and number of dairy cows was estimated subsequent to imposing the common support condition, i.e., matching participants with non-participants in the region of common support (Sianesi, 2004). The PSM framework matches participants with non-participants on a single dimension-propensity score. Similar propensity scores were generated from similar covariates. Balancing tests after the matching process indicated no statistical differences in the observed covariates between the two groups. As noted in Kabunga (2014), the overall matching quality before and after propensity score estimation is shown also by the rela- tively low pseudo-R2, implying that there are no systematic differences in the distribution of covariates.
After the matching procedures, the net impact (ATT) of the SPHS on daily milk productivity, land use, gross income and number of dairy cows is estimated using Equation 5.
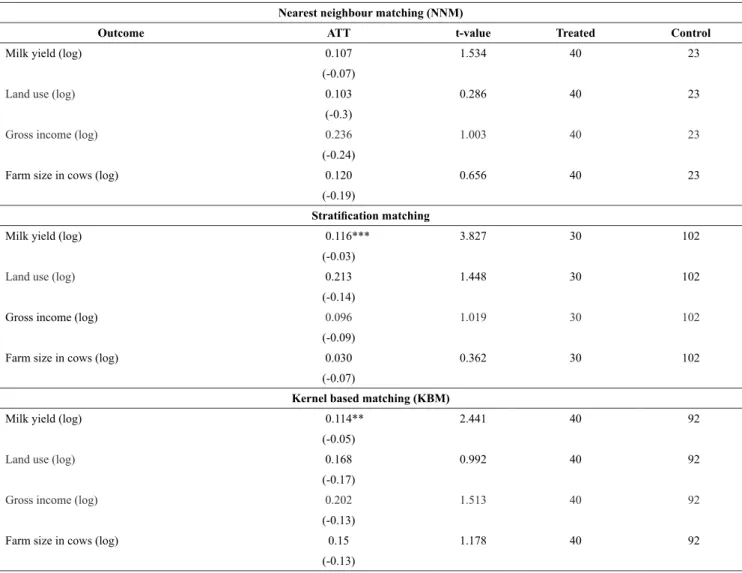
All the outcome variables were measured in logs to reflect percentage changes. The results of the estimations based on NNM, Stratification matching, and KBM are presented in Table 54.
4 We also estimated Radius Matching algorithm, however the method resulted in using only 24 observations, which is such a small size for a PSM study that we deemed the results irrelevant.
The milk productivity outcome is the log of daily milk production per cow per farm and the other three depend- ent variables are also logged. Thus, the estimated ATT are continuous percentage change rates. Participation in SPHS results in increases in milk productivity of 10.7%, 11.6%, and 11.4% with NNM, Stratification, and KBM matching methods, respectively. The impact of SPHS is statistically significant under the stratification and KBM methods but not statistically different from zero with the NNM method.
One of the main objectives of the SPHS is to increase the use of currently unused land and pastures. Therefore, the land use outcome was measured as the land area used by the farmer for intensive crop production, including grains and other crops. All three matching algorithms (NNM, Stratifica- tion Matching, and KBM) revealed insignificant ATT, indi- cating that SPHS did not have any effect on increasing land use among the program participants.
Gross income of dairy farmers from the dairy operation was measured as the total annual gross income combined from different income sources of the dairy operation such as income received from milk sales, secondary dairy products sales such as cheese, cottage cheese, income from animal sales, and manure sales. All three matching algorithms dis- played insignificant ATT (Table 5).
Table 5: Average treatment effects of SPHS on treated (ATT) from three matching algorithms.
Nearest neighbour matching (NNM)
Outcome ATT t-value Treated Control
Milk yield (log) 0.107 1.534 40 23
(-0.07)
Land use (log) 0.103 0.286 40 23
(-0.3)
Gross income (log) 0.236 1.003 40 23
(-0.24)
Farm size in cows (log) 0.120 0.656 40 23
(-0.19)
Stratification matching
Milk yield (log) 0.116*** 3.827 30 102
(-0.03)
Land use (log) 0.213 1.448 30 102
(-0.14)
Gross income (log) 0.096 1.019 30 102
(-0.09)
Farm size in cows (log) 0.030 0.362 30 102
(-0.07)
Kernel based matching (KBM)
Milk yield (log) 0.114** 2.441 40 92
(-0.05)
Land use (log) 0.168 0.992 40 92
(-0.17)
Gross income (log) 0.202 1.513 40 92
(-0.13)
Farm size in cows (log) 0.15 1.178 40 92
(-0.13) Standard errors are in parentheses.
Source: authors
Increasing the average number of dairy cows is another objective of SPHS; therefore, the farm size outcome was measured as the total number of dairy cows in the barn.
Similar to the results for land use, three of the matching algorithms showed insignificant impacts on increasing the number of dairy cows for the participant farms.
Discussion
Direct payments in the agricultural sector constitute a frequently used policy tool, especially across European countries. Subsequently, the evaluation of this policy scheme has been greatly emphasized over the last years. A special focus has been given to coupled direct payments, where their effects have been questionable in the literature. Therefore, our study contributes to the emerging literature by evaluating a coupled, direct payment program in Kosovo.
The results do not provide robust evidence for the first policy objective (milk production per cow) across match- ing algorithms. The findings from NNM are consistent with Bajrami et al. (2016) and GAP (2016), who concluded that the MAFRD subsidies did not show any positive effect on increasing production. However, results are robust for the other three objectives, revealing that SPHS did not increase land use, gross income and farm size (number of cows).
The lack of statistically significant average treatment effects confirms results from previous studies (Bajrami et al., 2016;
GAP, 2016) that SPHS did not have any significant effect on increasing land use, farm size and gross income for dairy farmers who participated in the program.
For land use, these results might be expected, consid- ering that the majority of farms are small, and they tend to use the same amount of land area over time. Similarly, Kastner International and AWI (2012) claimed that due to the application of thresholds being used as eligibility criteria for direct payments, small farms are motivated to continue farming and not release their land for use by bigger farms that could produce at a lower cost.
For gross income, GAP (2016) found that the SPHS increases farmer income in the short run. Contrary to the findings of GAP (2016), we did not find any effect on improving dairy farmers’ income. Nevertheless, GAP (2016) also claimed that in the long run, this scheme prevents the development of the dairy sector, since it supports and keeps less productive farmers from terminating production.
Lastly, an important focus of policy analysis in agriculture is their effect on farm size. According to MAFRD (2015), small farms (1–9 cows) constitute 65% of cattle inventory in Kosovo. Therefore, we examined the effects of SPHS on farm size as the number of dairy cows. Results revealed that SPHS did not have any statistically significant effect on increasing farm size. Furthermore, one of the matching algo- rithms revealed negative effects, suggesting SPHS reduced the number of dairy cows on supported farms. Findings of GAP (2016) showed that this policy impacted the farm struc- ture, with 94.2% being family farms (1–5 milking cows).
These findings are important. Since the SPHS program was initiated in 2009, MAFRD has spent over €8 million funding it. Furthermore, over the same period, MAFRD has increased its budget allocation for this program by an annual average of 47%. In 2014, over €2.2 million was expended by MAFRD to implement the SPHS. The results from this impact assessment suggest SPHS has not been effective in reaching its objectives. Four alternative matching algo- rithms tested the robustness of results; one of the first stud- ies employing this technique to evaluate direct payment’s effects.
Conclusions
Our findings suggest that SPHS has had a slightly posi- tive impact on milk productivity and a generally insignifi- cant impact on land use, gross income and farm size. Direct payments are considered inefficient measures for promoting growth, since their effect tends to diminish over many years (Kastner International and AWI, 2012). Likewise, our find- ings suggest the SPHS needs to be reformulated or replaced with a program that more effectively and efficiently achieves the objective of improving the competitiveness of the Kos- ovo’s dairy sector. Perhaps budget could be reallocated to upgrading the genetic potential of dairy cows and improv- ing research and extension services to enhance management skills.
Our use of a Propensity Score Matching approach with four matching algorithms is a more rigorous test of policy effectiveness than done in most similar past studies. The results of this study can be generalized beyond Kosovo by highlighting the ineffectiveness of coupled direct payments and the need to formulate new strategies that address farm- ers’ needs more effectively.
This study shed light on the ineffectiveness of coupled direct payments to address the needs of small-scale farmers.
One concern about the findings of this study is that assess- ment is based on recall observations for only two years, 2013 and 2014 (recall data). However, some dairy programs tend to have long-term objectives; therefore, an ideal dataset would have had a longitude of five years (2009–2014). Nev- ertheless, research with a larger sample over a longer period would be desirable particularly if data were collected from producers after each year. Additionally, the number of obser- vations used in the PSM models is small, so results must be evaluated with this caveat in mind. However, we generally find no persuasive evidence of SPHS effectiveness, which is more defensible than if the results had led to statistically significant findings.
Acknowledgment
This research was financially supported by the United States Department of Agriculture (USDA), National Institute of Food and Agriculture (NIFA), Hatch Project ARK02426.
References
Aakvik, A. (2001): Bounding a Matching Estimator: The Case of a Norwegian Training Program. Oxford Bulletin of Econom- ics and Statistics, 63, 115–143. https://doi.org/ 10.1111/1468- 0084.00211
Ahearn, M. C., El-Osta, H. and Dewbre, J. (2006): The impact of coupled and decoupled government subsidies on off-farm labor participation of U.S. farm operators. American Journal of Ag- ricultural Economics, 88 (2), 393–408. https://doi.org/10.1111/
j.1467-8276.2006.00866.x
Alemu, AE. and Adesina, J. (2015): Effects of co-operatives and contracts on rural income and production in the dairy supply chains: Evidence from Northern Ethiopia. African Journal of Agricultural and Resource Economics, 10, 312–327. https://
doi.org/10.22004/ag.econ.229812
Bezlepkina, I. V. and Oude Lansink, A. (2006): Impact of debts and subsidies on agricultural production: Farm-data evidence.
Quarterly Journal of International Agriculture, 45, 7–34.
Becerril, J. and Abdulai, A. (2010): The Impact of Improved Maize Varieties on Poverty in Mexico: A Propensity Score-Matching Approach. World Development, 38, 1024–1035. https://doi.
org/10.1016/j.worlddev.2009.11.017
Birol, E., Ndirangu, L., Roy, D. and Yakhshilikov, Y. (2011): As- sessing the Livelihood Impacts of a Livestock Disease Out- break: An Alternative Approach. IFPRI Discussion Paper 01081. IFPRI, Washington DC, USA.
Bytyqi, H., Thaqi, M., Hoxha, F., Misini, A., Haxhija, B., Mehmeti, H. and Cabrera, E.V. (2014): Economic assessment of dairy farm production in Kosovo. In: International Farming Systems Association, The 11th European IFSA Symposium. Berlin, Germany, 1-4 April 2014.
Bajrami, E., Wailes, E., Dixon, B. and Musliu, A. (2016): Are dairy subsidies effective to increase milk productivity and income in Kosovo? A Propensity Score Matching Approach. Selected Poster prepared for presentation at the 2016 Agricultural & Ap- plied Economics Association Annual Meeting, Boston, MA, July 31- Aug. 2.
Bajrami, E., Wailes, E., Dixon, B., Musliu, A. and Durand-Morat, A. (2017): Factors affecting the technical efficiency of dairy farms in Kosovo. Journal of Central European Agriculture, 18 (4), 823-840. https://doi.org/10.5513/JCEA01/18.4.1964 Bojnec, Š. and Fertő, I. (2019): Do CAP subsidies stabilise farm
income in Hungary and Slovenia? Agric. Econ. – Czech, 65, 103-111. https://doi.org/10.17221/190/2018-AGRICECON Bajrami, E. and Ostapchuk, I. (2019): Evaluating the Effects of
Coupled Direct Payments on Farm Income Using Dose Re- sponse Function. Evidence from Kosovo. Paper prepared for presentation at the 171st EAAE Seminar “Measuring and evalu- ating farm income and well-being of farm families in Europe -Towards a shared and broader approach for analysis and policy design”, 5th – 6th September 2019, Taenikon, Switzerland.
Caliendo, M. and Kopeinig, S. (2008): Some practical guidance for the implementation of propensity score matching. Journal of Economic Surveys, 22, 31–72. https://doi.org/10.1111/j.1467- 6419.2007.00527.x
Cochran, W. (1968): The effectiveness of adjustment by subclas- sification in removing bias in observational studies. Biometrics, 24, 295–314.
Dewbre, J. and Mishra, A. K. (2007): Impact of program payments on time allocation and farm household income. Journal of Ag- ricultural and Applied Economics, 39 (3), 489–505. https://doi.
org/10.1017/S1074070800023221
European Commission (2015): Short-Term Outlook for EU arable crops, dairy and meat markets in 2015 and 2016. Brussels, Belgium.
Edmeades, S., Psaltopoulos, D., Lee, D., Tsekouras, K., Varangis, P., Božić, M., Horvat, H., Van Der Celen, P., Felix, E. R., Bu- cher, A. E., Lapres, B. E., Bilandzija, J., Lampietti, J. A. and Capannelli, E. (2019): Sector Diagnostic and Analysis of Public Spending in Agriculture and Rural Development (English).
Washington, D.C.: World Bank Group., USA
Guan, Z. and Oude Lansink, A. (2006): The source of product in Dutch agriculture –a perspective from finance. American Jour- nal of Agricultural Economics, 88, 644–656.
Gap Institute - GAP (2016): Policy brief: A brief assessment of the dairy industry in Kosovo. Available at: http://www.instituti- gap.org/documents/48456_Dairy%20products%20ENG..pdf (Accessed in March 2019)
Heckman, JJ., LaLonde, R. and Smith, J. (1999): The Econom- ics and Econometrics of Active Labor Market Programs. In:
Ashenfelter, O. and Card, D. (eds.) (1999): Handbook of Labor Economics, vol. 3. Amsterdam: North-Holland.
Henningsen, A., Kumbhakar, S. and Lien, G. (2009): Economet- ric Analysis of the Effects of Subsidies on Farm Production in Case of Endogenous Input Quantities. Selected Paper prepared for presentation at the Agricultural & Applied Economics As- sociation 2009. AAEA & ACCI Joint Annual Meeting, Milwau- kee, Wisconsin, July 26-29, 2009.
Heinrich, C., Maffioli, A. and Vázquez, G. (2010): A Primer for Applying Propensity-Score Matching. Impact-Evaluation Guidelines, Technical Notes. No. IDB-TN-161. Office of Stra- tegic Planning and Development Effectiveness, Inter-American Development Bank. Available at: http://idbdocs.iadb.org/ws- docs/getdocument.aspx?docnum=35320229 (Accessed in May 2019)
Karagiannis, G. and Sarris, A. (2005): Measuring and explaining scale efficiency with the parametric approach: The case of Greek tobacco growers. Agricultural Economics, 33, 441–451.
https://doi.org/10.1111/j.1574-0864.2005.00084.x
Kim, C.S., Schluter, G., Schaible, G., Mishra, A.K. and Hallahan, C. (2005): A decomposed negative binominal model of struc- tural change: a theoretical and empirical application to U.S.
agriculture. Canadian Journal of Agricultural Economics, 53, 161-176. https://doi.org/10.1111/j.1744-7976.2005.00396.x Khandker, SR., Koolwal, GB. and Samad, HA. (2010): Handbook on
Impact Evaluation: Quantitative Methods and Practices. World Bank. Washington DC, USA. ISBN: 978-0-8213-8028-4.
Kastner International and the Federal Institute of Agricultural Economics - AWI (2012): Mid-Term Evaluation Report of the ARDP 2007-2013 Republic of Kosovo. Available at: http://
app.seerural.org/wp-content/uploads/2013/08/Kosovo-Mid- Term-Evaluation-Report-of-the-ADRP-2007-2013-September- 2012-ENGr.pdf (Accessed in May 2019)
Kirchweger, S. and Kantelhardt, J. (2012): Improving Farm Com- petitiveness through Farm-Investment Support: a Propensity Score Matching Approach. Paper prepared for presentation at the 131st EAAE Seminar ‘Innovation for Agricultural Com- petitiveness and Sustainability of Rural Areas’, Prague, Czech Republic, September 18-19, 2012.
Kabunga, N. (2014): Improved Dairy Cows in Uganda: Pathways to Poverty Alleviation and Improved Child Nutrition. Interna- tional Food Policy Research Institute (IFPRI). IFPRI Discus- sion Paper 01328. IFPRI, Washington DC, USA.
King, G. and Nielsen, R. (2019): Why Propensity Scores Should Not Be Used for Matching. Political Analysis, 27, 4. Available at: http://j.mp/2ovYGsW (Accessed in June 2019)
Ministry of Agriculture, Forestry and Rural Development - MA- FRD (2003): The Kosovo Green Book: A Strategy for Sustain- able Agriculture and Rural Development. Provisional Institu- tions of Self-Government, Ministry of Agriculture, Forestry and Rural Development (MAFRD), Pristina, Kosovo. Available
at: http://www.agrowebcee.net/fileadmin/content/aw-kosovo/
files/Greenbook_1_.pdf (Accessed in March 2019)
McCloud, N. and Kumbhakar, S. (2008): Do subsidies drive pro- ductivity? A cross-country analysis of Nordic dairy farms. In Chib, S., Griffiths, W., Koop, G. and Terrell, D. (eds.) (2008):
Bayesian Econometrics (Advances in Econometrics, Vol. 23), Emerald Group Publishing Limited, Bingley, pp. 245-274.
https://doi.org/10.1016/S0731-9053(08)23008-2
Musliu, A., Gjonbalaj, M., Sherifi, K. and Meqe, M. (2009): Eco- nomic losses related to raw milk quality on commercial daily farms in Kosovo. New Medit: A Mediterranean Journal of Eco- nomics, Agriculture and Environment, 8, 49–53.
Miftari, I,, Gjonbalaj, M. and Johnsen, HF. (2010): The estimation of Kosovo consumer expenditures for milk and dairy products:
the role of demographic and socio-economic factors. In: Uni- versity of IASI Faculty of Economics and Business Adminis- tration, The eco-economic challenges for XXI Century. Iasi, Romania, 5-6 March 2010, Iasi: Techno press.
Ministry of Agriculture, Forestry and Rural Development - MA- FRD (2010): Agricultural and Rural Development Plan 2010-13. Available at: http://www.seerural.org/wp-content/
uploads/2009/05/ARDP_2010-13_FINAeng1702011.pdf (Ac- cessed in March 2019)
Miftari, I., Waldhardt, R., Bajrami, E. and Gjonbalaj, M. (2014):
Supply scale and demand for agricultural advisory services in Kosovo. Poster paper prepared for presentation at the EAAE 2014 Congress ‘Agri-Food and Rural Innovations for Healthier Societies’, August 26-29, 2014, Ljubljana, Slovenia.
Ministry of Agriculture, Forestry and Rural Development – MA- FRD (2015): Green report 2015. Prepared by the Department of Economic Analysis and Agricultural Statistics (DEAAS).
Available at: https://www.mbpzhr-ks.net/repository/docs/
Raporti_i_Gjelber_2015_final.pdf (Accessed in March 2019) Ministry of Agriculture, Forestry and Rural Development - MAFRD
(2016): Green Report 2016. Prepared by the Department of Eco- nomic Analysis and Agricultural Statistics (DEAAS). Available at: http://www.mbpzhr-ks.net/repository/docs/Green_Report_
Kosovo_2016_Final_050417.pdf (Accessed in March 2019)
Nushi, M. and Selimi, F. (2009): An assessment of the competi- tiveness of the dairy food chain in Kosovo. AgriPolicy - En- largement Network for Agripolicy Analysis. Available at:
https://docplayer.net/38176802-An-assessment-of-the-compet- itiveness-of-the-dairy-food-chain-in-kosovo.html (Accessed in April 2019)
Pufahl, A. and Weiss, C.R. (2009): Evaluating the effects of farm programmes: results from propensity score matching. European Review of Agricultural Economics, 36 (1), 79–101. https://doi.
org/10.1093/erae/jbp001
Rosenbaum, PR. and Rubin, DB. (1983): The central role of the propensity score in observational studies for causal effects.
Biometrika, 70, 41–55. https://doi.org/10.1093/biomet/70.1.41 Rizov, M., Pokrivcak, J. and Ciaian, P. (2013): CAP subsidies and
productivity of the EU farms. Journal of Agricultural Econom- ics, 64, 537–557. https://doi.org/10.1111/1477-9552.12030 Rawlins, R., Pimkina, S., Barrett, C. B., Pedersen, S. and Wydick,
B. (2014): Got milk? The impact of Heifer International’s live- stock donation programs in Rwanda on nutritional outcomes.
Food Policy, 44, 202–213. https://doi.org/10.1016/j.food- pol.2013.12.003
Sianesi, B. (2004): An evaluation of the Swedish system of active labor market programs in the 1990s. Review of Economics and Statistics, 86, 133–155. https://doi.
org/10.1162/003465304323023723
Smith, J. and Todd, P. (2005): Does Matching Overcome La- Londe’s Critique of Nonexperimental Estimators? Journal of Econometrics, 125, 305–353. https://doi.org/10.1016/j.
jeconom.2004.04.011
Takácsné-György, K. and Takács, I. (2012): Changes in cereal land use and production level in the European Union during the pe- riod 1999-2009, focusing on New Member States. Studies in Agricultural Economics, 114, 24–30.
Zhengfei, G. and Oude Lansink, A. (2006): The source of produc- tivity growth in Dutch agriculture: A perspective from finance.
American Journal of Agricultural Economics, 88 (3), 644–656.
https://doi.org/10.1111/j.1467-8276.2006.00885.x