0139–3006 © 2019 Akadémiai Kiadó, Budapest DOI: 10.1556/066.2019.48.1.7
NANOFIBRE ENCAPSULATION OF LIMONENE AND MODELLING ITS RELEASE MECHANISMS
S. DEDEa, and F. LOKUMCU ALTAYb*
aDepartment of Food Engineering, Faculty of Agricultural, Mustafa Kemal University, Hatay, 31000. Turkey
bDepartment of Food Engineering, Faculty of Chemical and Metallurgical, Istanbul Technical University, Istanbul, 34469. Turkey
(Received: 16 January 2018; accepted: 25 June 2018)
In this study, limonene was encapsulated by using gelatine, Na-alginate, polyvinyl alcohol, lactalbumin or xanthan gum with the uniaxial electrospinning process. The highest encapsulation effi ciency was obtained for the sample containing polyvinyl alcohol. The release kinetic studies of nanofi bre encapsulated limonene were carried out at 5.5, 20, and 38.5 ºC. The Peppas equation expressed the release behavior of limonene for all systems very well, indicating quasi-Fickian diffusion. The modelling data suggested that maybe more than one mechanism was involved for the release at 20 ºC. The activation energy for releasing limonene from the electrospun polyvinyl alcohol-alginate encapsulation system was found to be 6.2 kJ mol–1 from the Arrhenius equation.
Keywords: nanoencapsulation, volatile components, nanofi bres, release kinetics, food process modelling, biopolymers
Limonene (LM) is a non-polar fl avouring compound of citrus fruit. Volatile materials with antimicrobial properties, such as LM, are of great interest for the active packaging industry, and their effective encapsulation and release kinetics have a great importance due to their high sensitivity to ambient conditions. It has bactericidal, antioxidant, and therapeutic properties, thus it is used in cosmetics, foods, and other consumer products (LI & CHIANG, 2012).
Electrospinning is a simple, versatile, top-down process and an encapsulation method to produce nanofi bres easily and cost effectively (ANU BHUSHANI & ANANDHARAMAKRISHNAN, 2014; OKUTAN et al., 2014). When core and wall materials are mixed and pumped through the same tip to the electrical fi eld, electrospun nanofi bre is in the uniaxial form (Altay & Okutan, 2015). High encapsulation effi ciency (EE), sustained release of encapsulated material, suitable encapsulation method for heat-labile compounds, improved protection from detrimental conditions, enhanced stability and functionality of encapsulated material are the main advantages of the electrospinning procedure (ANU BHUSHANI & ANANDHARAMAKRISHNAN, 2014).
Gelatine (GL) is a widely used polymer and is approved as wall material in encapsulation (GOURDEL & TRONEL, 2001). Alginate (ALG) is a linear polysaccharide used as wall material due to its mechanical stability (BHATTARAI et al., 2006). Polyvinyl alcohol (PVA) is cheap, biocompatible, and used as wall material due to its stability under most physiological conditions (LEVI et al., 2011). Lactalbumin (LA) is a good stabilizer due to its good emulsifying property and high biocompatibility (VIJAYARAGAVAN et al., 2014). Xanthan gum (XG) is a
* To whom correspondence should be addressed.
Phone: +902122856948; e-mail: lokumcu@itu.edu.tr
polysaccharide used as a wall material for encapsulation (RUTZ et al., 2013). There are fi ve different release mechanisms of the encapsulated material: 1) fracturation; 2) diffusion; 3) swelling and dissolution; 4) eroding and biodegradation; and 5) osmosis (KO & GUNASEKARAN, 2014).
The objectives of this study were to nanoencapsulate LM by uniaxial electrospinning using PVA, GL, ALG, LA, or XG; to characterize electrospun fi bres and to modell the release kinetics of the GL nanofi bre encapsulated LM at different temperatures by various mathematical equations.
1. Materials and methods
1.1. Materials
LM (Alfa Aesar Co., Germany), ethanol (Sigma-Aldrich Co., Germany), type B gelatine powder from bovine skin (Sigma, Germany), PVA (ZAG, Turkey), XG (Sigma, Germany), Na-alginate E-401 (FMC-Biopolymer, US), LA (Sigma, Germany), and acetic acid (Merck, US) were purchased. The feed solutions, their composition and preparation are given in Table 1. All samples were mixed at 300 r.p.m.
Table1. Preparation and compositions of feed solutions Sample
no
Wall polymer(s)
Polymer ratio (w/w)
Total polymer concentration in
the feed (wt %)
Solvent Mixing time (h)
Temperature (ºC)
1 PVA 8 8 Distilled water 1 80
2 PVA+ALG 32:0.15 11 Distilled water 1 80
3 GL 20 20 50% acetic acid 2 60
4 GL+ALG 19:1 20 50% acetic acid 2 60
5 GL+LA 19:1 20 50% acetic acid 2 60
6 GL+XG 8:0.05 11 50% acetic acid
+ distilled water
2 60
Limonene to polymer solution ratio (v/v) was 1:9 for all samples; PVA: polyvinyl alcohol; LM: limonene; ALG:
alginate; XG: xanthan gum; LA: lactalbumin
1.2. Methods
1.2.1. Electrospinning and characterization. The uniaxial electrospun encapsulation was performed by using electrospinning equipment (Inovenso NE100, Turkey) at 25 ºC. The applied voltage, the feed rate, and the distance to the collector plate were 25 kV, 0.5 ml h–1, and 10 cm, respectively.
The scanning electron microscope (SEM) (JEOL JSM-5500LV, Japan) was operated at an acceleration voltage of 10 kV for morphological imaging of samples.
The translational diffusion coeffi cient measurement of dispersions containing electrospun nanofi bre samples was carried out using a dynamic light scattering instrument (Malvern Zetasizer Nano ZS, Worcestershire, UK) at 25 ºC in triplicate. Ethanol or distilled water were used as dispersants and nanofi bres were dispersed at 0.1% (w/v) (OKUTAN et al., 2014). The dynamic contact angles of samples were measured using a tensiometer
(Dataphysics DCAT 11EC, Germany) by the Wilhelmy plate method at 25 ºC. A sample with an area of 1 cm × 1 cm and 1 mm height was placed onto a special holder of the tensiometer.
The sample was brougth in contact with water and the contact angle value was read from the software (SCAT 11EC, Germany).
1.2.2. Encapsulation effi ciency. After preparing a calibration curve of LM (R2=0.9995), all encapsulated samples were weighed out between 5.1 mg and 14 mg and dissolved in 5 ml ethanol. Then, 1 μl of each solution was injected in duplication into a gas chromatograph (GC) (Shimadzu GC 2010, Kyoto, Japan) to be captured in fl ame ionization detector (FID) compared to standard LM reference injected previously. Calculations were carried out by using external standard method. A polar capillary column (HP-Innowax 30 m × 0.25 mm i.d
× 0.25 μm fi lm thickness J&W Scientifi c) was used for analyses (For working conditions:
Supplementary data available at authors). The EE was calculated according to Eq. 1:
LM amount captured by FID in GC
EE = _______________________________ (Eq. 1) LM amount in the feed solution
This calculation is based on the ratio of the actual LM content in the fi bre to theoretical LM content (WANG et al., 2017). The theoretical LM content in the electrospun fi bres was the amount of LM added to the feed solution prior to the electrospinning.
1.2.3. Modelling of release mechanisms of LM. All electrospun samples (twice for each) were weighed and put into 5 ml ethanol fi lled air tight tubes separately and stored at different temperatures (5.5±1.5, 20±1.0, 38.5±1.5 ºC). One microlitre of the sample from each tube was taken and injected to GC at 0th, 2nd, 4th, and 6th days to be captured in FID according to standard LM reference. Ethanol is a good simulant for fatty foods, easy to work with analytically (BANER et al., 1992), and can be used as release medium.
The release kinetics were modelled with various equations, such as the Peppas equation (RITGER & PEPPAS, 1987), zero-order, fi rst-order, Higuchi and Hixson-Crowell models (Supplementary data available from authors) (NEO et al., 2013; WANG et al., 2017). In this study, the Hixson-Crowell model was modifi ed as follows according to Eq. 2:
(Eq. 2) The temperature dependency of the model parameter (k) from the Peppas equation was expressed by the Arrhenius equation (Supplementary data from authors).
Excel 2016 (Microsoft, WA, USA) was employed for statistical analysis. The results of sample mean diameter were evaluated by the one-way analysis of variance (ANOVA) (α=0.05). The results of diffusion coeffi cients and contact angle were evaluated by the two- way ANOVA (α=0.05). Signifi cant differences among samples were determined by the least signifi cant difference comparison by the Student’s paired t-test, and t-test probability limits of P<0.05 were used for two-sided testing in evaluation.
2. Results and discussions
2.1. Electrospinnability and characterization of electrospun samples
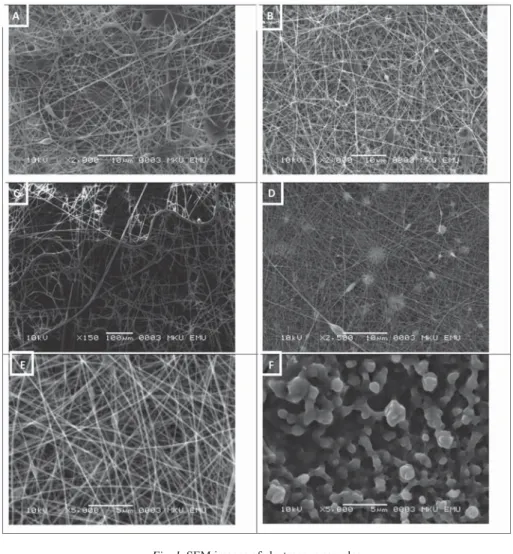
The SEM images of electrospun samples are given in Figure 1. All samples appear to be fi bre except for sample 6 containing GL and XG. It is probably the complex and brunched structure of XG that inhibits electrospinnability.
Fig. 1. SEM images of electrospun samples
A: Sample 1 (PVA+LM); B: Sample 2 (PVA+ALG+LM); C: Sample 3 (GL+LM);
D: Sample 4 (GL+ALG+LM); E: Sample 5 (GL+LA+LM); F: Sample 6 (GL+XG+LM) PVA: polyvinyl alcohol; LM: limonene; ALG: alginate; XG: xanthan gum; LA: lactalbumin
The mean diameters of electrospun samples are listed in Table 2. Only sample 4 had the diameter lower than 100 nm, which can be considered as nanofi bre-encapsulated. The addition of ALG to the solutions of PVA or GL decreased the mean diameters of electrospun samples. It was also observed that the mean diameter of the sample containing GL (sample 3), having the highest diameter, decreased with the additions of LA or XG as well. CAMERLO and
co-workers (2014) reported that diameters of electrospun nanofi bres containing 9% PVA and LM were in the range of 100–300 nm depending on the environmental conditions of electrospinning process. In our study we have found that the diameter of electrospun nanofi bres with PVA-LM was 435.86±171.86 nm.
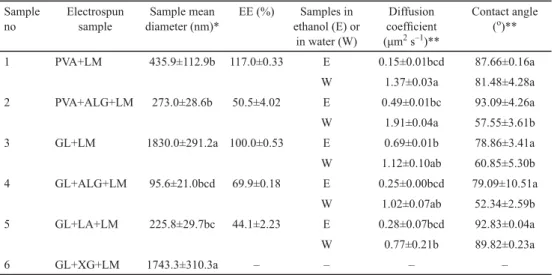
Table 2. Mean diameters, encapsulation effi ciencies (EE), diffusion coeffi cients, and contact angles of electrospun samples
Sample no
Electrospun sample
Sample mean diameter (nm)*
EE (%) Samples in ethanol (E) or
in water (W)
Diffusion coeffi cient (μm2 s–1)**
Contact angle (o)**
1 PVA+LM 435.9±112.9b 117.0±0.33 E 0.15±0.01bcd 87.66±0.16a
W 1.37±0.03a 81.48±4.28a
2 PVA+ALG+LM 273.0±28.6b 50.5±4.02 E 0.49±0.01bc 93.09±4.26a
W 1.91±0.04a 57.55±3.61b
3 GL+LM 1830.0±291.2a 100.0±0.53 E 0.69±0.01b 78.86±3.41a
W 1.12±0.10ab 60.85±5.30b
4 GL+ALG+LM 95.6±21.0bcd 69.9±0.18 E 0.25±0.00bcd 79.09±10.51a
W 1.02±0.07ab 52.34±2.59b
5 GL+LA+LM 225.8±29.7bc 44.1±2.23 E 0.28±0.07bcd 92.83±0.04a
W 0.77±0.21b 89.82±0.23a
6 GL+XG+LM 1743.3±310.3a – – – –
* Means±SD (n=3); values within each group followed by the same letter (in column, sample number) are not signifi cantly different (P≤0.05)
**Means±SD (n=3); values within each group followed by the same letter (in column, sample number, and samples in ethanol or water) are not signifi cantly different (P≥0.05)
PVA: polyvinyl alcohol; LM: limonene; ALG: alginate; XG: xanthan gum
Diffusion coeffi cients (OKUTAN et al., 2014) and contact angle values (DONG et al., 2018) of electrospun nanofi bres have been used for characterization (Table 2). Diffusion coeffi cient values of samples in water were higher than that of samples in ethanol for the samples containing PVA. It is probably due to the hydrophilic character of PVA, leading easy diffusion of samples to aquatic system.
All contact angle values showed that samples in water had relatively hydrophilic character compared to samples in ethanol. The contact angle values of sample 2, 3, and 4 decreased in water compared to the values in ethanol, meaning these samples showed more hydrophobic character (i.e. decreased wetting properties) in ethanol. The addition of LA increased the hydrophobicity of sample 5 in water compared to sample 3 and 4.
2.2. Encapsulation effi ciency
The EE of LM was determined as between 44.12% and 117%, which confi rms that the electrospinning encapsulation was successful (Table 2). While the addition of LA to GL resulted in the lowest effi ciency, the EE values of LM were obtained as 117±0.33%, 50.5±4.02%, 100±0.53%, and 69.91±0.18% for PVA, PVA+ALG, GL, and GL+ALG, respectively. It appears that addition of ALG to PVA or GL decreased the EE.
Retention and release values of encapsulated anthocyanins exceeding 100% were explained as interference with the analysis due to the alcoholic extraction methods that do not include a chloroform extraction step to remove nonpolar compounds (FLORES et al., 2014).
VENTURINI and co-workers (2011) calculated the EE as varying from 97.8±2.8% to 101.6.±0.5% (w/w), although the concentration of the drug loading was constant, and explained it was due to drugs’ lipophilicity, leading to high EE. Similarly, ethanol extraction of the samples may lead to interference in our analyses.
2.3. Modelling of release mechanism
The cumulative release profi les of LM versus time are given in Supplementary data, available at authors. Generally, a gradually increased release was observed for all samples if the timeline is considered, especially at 5.5 ºC (Supplementary data). This was probably because longer time was needed for the encapsulated LM in the electrospun sample to be released through a longer pathway (WANG et al., 2017).
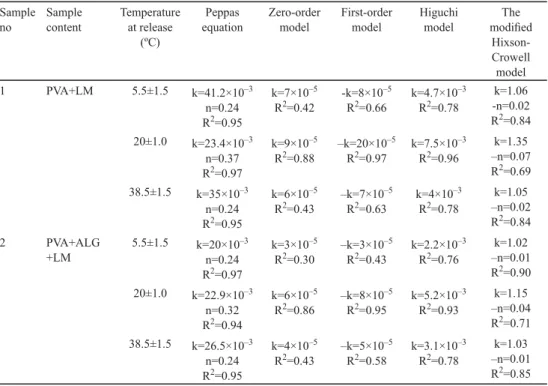
The release kinetics of LM in ethanol were modelled and their model parameters are presented in Table 3. It appears that the Peppas equation expressed the release of LM from each polymer at all temperatures very well. The values of n were lower than 0.5, indicating quasi-Fickian diffusion (EL-LEITHY et al., 2010), where LM was supposed to fi nd its way out through interconnected small pores, spontaneously (BUENO et al., 2012). It means that the release mechanism was diffusion controlled (i.e. the release was caused by the concentration gradient between fi bres and releasing medium) (BASAK et al., 2008) and stereoselective (because of n<0.5) (BUENO et al., 2012).
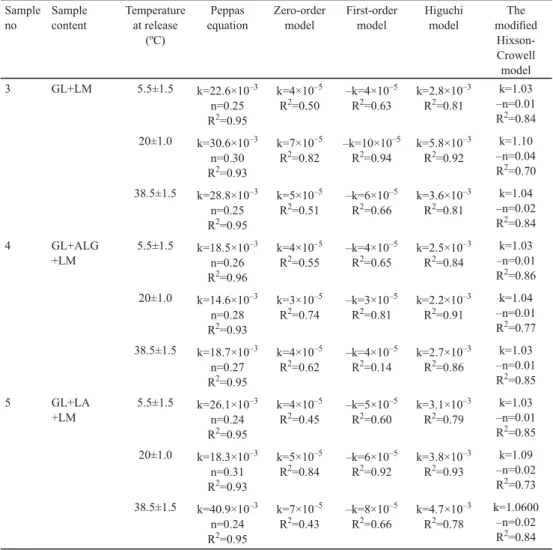
Table 3. The kinetic models for release of LM Sample
no
Sample content
Temperature at release
(ºC)
Peppas equation
Zero-order model
First-order model
Higuchi model
The modifi ed
Hixson- Crowell
model
1 PVA+LM 5.5±1.5 k=41.2×10⁻³
n=0.24 R2=0.95
k=7×10⁻⁵ R2=0.42
-k=8×10⁻⁵ R2=0.66
k=4.7×10⁻³ R2=0.78
k=1.06 -n=0.02 R2=0.84 20±1.0 k=23.4×10⁻³
n=0.37 R2=0.97
k=9×10⁻⁵ R2=0.88
–k=20×10–5 R2=0.97
k=7.5×10⁻³ R2=0.96
k=1.35 –n=0.07 R2=0.69 38.5±1.5 k=35×10–3
n=0.24 R2=0.95
k=6×10⁻⁵ R2=0.43
–k=7×10⁻⁵ R2=0.63
k=4×10⁻³ R2=0.78
k=1.05 –n=0.02 R2=0.84
2 PVA+ALG
+LM
5.5±1.5 k=20×10–3 n=0.24 R2=0.97
k=3×10⁻⁵ R2=0.30
–k=3×10⁻⁵ R2=0.43
k=2.2×10⁻³ R2=0.76
k=1.02 –n=0.01 R2=0.90 20±1.0 k=22.9×10⁻³
n=0.32 R2=0.94
k=6×10⁻⁵ R2=0.86
–k=8×10⁻⁵ R2=0.95
k=5.2×10⁻³ R2=0.93
k=1.15 –n=0.04 R2=0.71 38.5±1.5 k=26.5×10⁻³
n=0.24 R2=0.95
k=4×10⁻⁵ R2=0.43
–k=5×10⁻⁵ R2=0.58
k=3.1×10⁻³ R2=0.78
k=1.03 –n=0.01 R2=0.85
Sample no
Sample content
Temperature at release
(ºC)
Peppas equation
Zero-order model
First-order model
Higuchi model
The modifi ed
Hixson- Crowell
model
3 GL+LM 5.5±1.5 k=22.6×10⁻³
n=0.25 R2=0.95
k=4×10⁻⁵ R2=0.50
–k=4×10⁻⁵ R2=0.63
k=2.8×10⁻³ R2=0.81
k=1.03 –n=0.01 R2=0.84 20±1.0 k=30.6×10⁻³
n=0.30 R2=0.93
k=7×10⁻⁵ R2=0.82
–k=10×10–5 R2=0.94
k=5.8×10⁻³ R2=0.92
k=1.10 –n=0.04 R2=0.70 38.5±1.5 k=28.8×10⁻³
n=0.25 R2=0.95
k=5×10⁻⁵ R2=0.51
–k=6×10⁻⁵ R2=0.66
k=3.6×10⁻³ R2=0.81
k=1.04 –n=0.02 R2=0.84
4 GL+ALG
+LM
5.5±1.5 k=18.5×10⁻³ n=0.26 R2=0.96
k=4×10⁻⁵ R2=0.55
–k=4×10⁻⁵ R2=0.65
k=2.5×10⁻³ R2=0.84
k=1.03 –n=0.01 R2=0.86 20±1.0 k=14.6×10⁻³
n=0.28 R2=0.93
k=3×10⁻⁵ R2=0.74
–k=3×10⁻⁵ R2=0.81
k=2.2×10⁻³ R2=0.91
k=1.04 –n=0.01 R2=0.77 38.5±1.5 k=18.7×10⁻³
n=0.27 R2=0.95
k=4×10⁻⁵ R2=0.62
–k=4×10⁻⁵ R2=0.14
k=2.7×10⁻³ R2=0.86
k=1.03 –n=0.01 R2=0.85
5 GL+LA
+LM
5.5±1.5 k=26.1×10⁻³ n=0.24 R2=0.95
k=4×10⁻⁵ R2=0.45
–k=5×10⁻⁵ R2=0.60
k=3.1×10⁻³ R2=0.79
k=1.03 –n=0.01 R2=0.85 20±1.0 k=18.3×10⁻³
n=0.31 R2=0.93
k=5×10⁻⁵ R2=0.84
–k=6×10⁻⁵ R2=0.92
k=3.8×10⁻³ R2=0.93
k=1.09 –n=0.02 R2=0.73 38.5±1.5 k=40.9×10⁻³
n=0.24 R2=0.95
k=7×10⁻⁵ R2=0.43
–k=8×10⁻⁵ R2=0.66
k=4.7×10⁻³ R2=0.78
k=1.0600 –n=0.02 R2=0.84 PVA: polyvinyl alcohol; LM: limonene; ALG: alginate; LA: lactalbumin
The Higuchi model exhibited good correlation for all polymers at only 20 ºC, indicating the release rate of LM decreased proportionally to the square root of time at 20 ºC. The fi rst- order model had the same results at 20 ºC, except for sample 4. The fi rst-order model indicates that the transport might be rate-limiting step (WANG et al., 2017). The modifi ed Hixson- Crowell model showed good fi t for only sample 2 at 5.5 ºC, whereas the zero-order model did not show any good correlation compared to the other models.
The values of R2 for the Peppas equation decreased as the temperature increased from 5.5 ºC to 20 ºC and then increased with further increases in temperature, except for sample 1.
The Higuchi model, which suggests the release mechanism might be different from quasi- Fickian at 20 ºC, fi tted well only at 20 ºC. However, since the values of R2 for the Peppas
Table 3 cont.
equation were higher than the values of R2 for the Higuchi model at 20 ºC, the release mechanism was Fickian (MEHTA et al., 2017). Probably, more than one mechanism was involved in the release. The different release kinetics can be explained by various factors including interactions between wall and core materials, the encapsulation methods, behaviour of wall polymers in release media, and different size of fi bres (KO & GUNASEKARAN, 2014).
Interestingly, higher release amounts were determined at 20 ºC compared to the amounts released at 38.5 ºC (Supplementary data). It may be attributed to the nature of the structure of the protein-made wall polymers at high temperatures (except for samples 1 and 2). The temperature dependency of LM release was modelled by the Arrhenius equation. Only sample 2 (without protein wall polymer) obeyed the Arrhenius kinetic, which may indicate that for the other samples with protein the mechanisms were different as temperature increased. The Arrhenius constant and the activation energy for LM from the PVA+ALG encapsulation system were found as 0.28 and 6.2 kJ mol–1, respectively.
The release rate of antimicrobial compound plays an important role in maintaining food quality and safety. When the release rate of the antimicrobial agent is very slow, microbial growth might occur before the agent could inhibit it. When the release rate is too fast, the agent may diffuse into food and may not be available at the food surface to inhibit microbial growth (UZ & ALTINKAYA, 2011). Delivery systems working with quasi-Fickian diffusion may provide solution for hydrophilic and volatile core materials (BASAK et al., 2008) like LM.
Active food packaging provides inert barrier including antimicrobial bioactive compounds such as LM. Using electrospun fi bres as active packaging material is preferred due to its submicron diameters, high sensitivity to changes, and suitability for encapsulation of heat-sensitive compunds (VEGA-LUGO & LIM, 2009; ANU BHUSHANI &
ANANDHARAMAKRISHNAN, 2014). LM, as a natural and non-toxic product with good fl avour (LI
& CHIANG, 2012), is acceptable to be a food contact packaging material (NEO et al., 2013).
The parameters of electrospinning for encapsulation of active compounds have been studied by VEGA-LUGO & LIM (2009).
The gradual release of electrospun encapsulated LM by various polymers appears to be applicable to active food packaging, however, more studies, especially application for food products is needed.
3. Conclusions
In conclusion, the encapsulation of LM was succesfully achieved by uniaxial electrospinning using PVA or GL, which presented the two highest EE, as wall materials. Release kinetics of uniaxial electrospun encapsulated LM was fi tted by the Peppas equation at all temperatures, indicating quasi-Fickian diffusion. Especially the gradual release of LM would be benefi cial in active food packaging for its antibacterial properties. The outcomes of this work would be benefi cial for future studies on release kinetics of bioactive materials from electrospun systems used in active food packaging.
*
Dr. Filiz Altay acknowledges the fi nancial support from TUBITAK for the project no:113O491. Mr. Dede thanks Nagihan Okutan and Büşra Bakır for their help on electrospinning, dls and contact angle measurements. Mr. Dede also thanks Prof. Dr. Yahya Kemal Avsar for chromatographical analyses.
References
ALTAY, F. & OKUTAN, N. (2015): Nanofi ber encapsulation of active ingredients and their controlled release. -in:
Ravishankar R.V. (Ed.) Advances in food biotechnology, Wiley-Blackwell, West Sussex, UK. Chapter 37, pp.
607–616.
ANU BHUSHANI, J. & ANANDHARAMAKRISHNAN, C. (2014): Electrospinning and electrospraying techniques: Potential food-based applications. Trends Food Sci. Tech., 38, 21–33.
BANER, A., BIEBER, W., FIGGE, K., FRANZ, R. & PIRINGER, O. (1992): Alternative fatty food simulants for migration testing of polymeric food contact materials. Food Addit. Contam., 9(2), 137–148.
BASAK, S.C., KUMAR, K.S., RAMALINGAM, M. (2008): Design and release characteristics of sustained release tablet containing metformin HCl. Braz. J. Pharm. Sci., 44(3), 476–483.
BHATTARAI, N., LI, Z., EDMONDSON, D. & ZHANG, M. (2006): Alginate-based nanofi brous scaffolds: Structural, mechanical and biological properties. Adv. Mater., 18, 1463–1467.
BUENO, V.B., BENTINI, R., CATALANI, L.H. & PETRI, D.F.S. (2012): Synthesis and swelling behavior of xanthan-based hydrogels. Carbohyd. Polym., 92(2), 1091–1099.
CAMERLO, A., BUHLMANN-POPA, A., VEBERT-NARDIN, C., ROSSI, R.M. & FORTUNATO, G. (2014): Environmetally controlled emulsion electrospinning for the encapsulation of temperature-sensitive compounds. J. Mater. Sci., 49, 8154–8162.
DONG, J., GHILADI, R.A., WANG, Q., CAI, Y. & WEI, Q. (2018): Protoporphyrin-IX conjugated cellulose nanofi bers that exhibit high antibacterial photodynamic inactivation effi cacy. Nanotechnology, 29(26), 265601.
EL-LEITHY, E., SHAKER, D.S. GHORAB, M.K. & ABDEL-RASHID, R.S. (2010): Optimization and characterization of diclofenac sodium microspheres prepared by a modifi ed coacervation method. Drug Discov. Ther., 4(3), 208–
216.
FLORES, F.P., SINGH, R.K., KERR, W.L., PEGG, R.B. & KONG, F. (2014): Total phenolics content and antioxidant capacities of microencapsulated blueberry anthocyanins during in vitro digestion. Food Chem., 153, 272–278.
GOURDEL, Y. & TRONEL, J. (2001): Flavoured gelatin capsules capable of containing various substances used in the food, animal feed, dietetic and pharmaceutical sectors. French Patent Application FR 2, 807 677 A1.
KO, S. & GUNASEKARAN, S. (2014): Controlled release of food ingredients. -in: Kwak, H.S. (Ed.) Nano and microencapsulation for foods. John Wiley and Sons Ltd, 1st ed. pp. 327–344.
LEVI, S., RAC, V., MANOJLOVI, V., RAKI, V., BUGARSKI, B., FLOCK, T., KRZYCZMONIK, K.E. & NEDOVI, V. (2011):
Limonene encapsulation in alginate/poly (vinyl alcohol). Proc. Food Sci., 1, 1816–1820.
LI, P. & CHIANG, B. (2012): Process optimization and stability of D-limonene-in-water nanoemulsions prepared by ultrasonic emulsifi cation using response surface methodology. Ultrason. Sonochem., 19, 192–197.
MEHTA, P., AL-KINANI, A.A., ARSHAD, M.S., CHANG, M., ALANY, R.G. & AHMAD, Z. (2017): Development and characterization of electrospun timolol maleate-loaded polymeric contact lens coatings containing various permeation enhancers. Int. J. Pharm., 532, 408–420.
NEO, Y.P., SWIFT, S., RAY, S., GIZDAVIC-NIKOLAIDIS, M., JIN, J. & PERERA, C.O. (2013): Evaluation of gallic acid loaded zein-sub-micron electrospun fi bre mats as novel active packaging materials. Food Chem., 141(3), 3192–3200.
OKUTAN, N., TERZI, P. & ALTAY, F. (2014): Affecting parameters on electrospinning process and characterization of electrospun gelatin nanofi bers. Food Hydrocolloid., 39, 19–26.
RITGER, P.L. & PEPPAS, N.A. (1987): A simple equation for description of solute release I. Fickian and non-Fickian release from non-swellable devices in the form of slabs, cylinders or discs. J. Control. Release, 5(1), 23–36.
RUTZ, J.K., ZAMBIAZI, R.C., BORGES, C.D., KRUMREICH, F.D., DA LUZ, S.R., HARTWIG, N. & DA ROSA, C.G. (2013):
Microencapsulation of purple Brazilian cherry juice in xanthan, tara gums and xanthan-tara hydrogel matrixes.
Carbohyd. Polym., 98(2), 1256–1265.
UZ, M. & ALTINKAYA, S.A. (2011): Development of mono and multilayer antimicrobial food packaging materials for controlled release of potassium sorbate. LWT – Food Sci Technol., 44, 2302–2309.
VEGA-LUGO, A.C. & LIM, L.T. (2009): Controlled release of allyl isothiocyanate using soy protein and poly (lactic acid) electrospun fi bers. Food Res. Int., 42(8), 933–940.
VENTURINI, C.G., JÄGER, E., OLIVEIRA, C.P., BERNARDI, A., BATTASTINI, A.M.O., GUTERRES, S.S. & POHLMANN, A.R.
(2011): Formulation of lipid core nanocapsules. Colloid Surface A, 375(1–3), 200–208.
VIJAYARAGAVAN, S., VINO, S., KALYANI RATH, S., MISHRA, B., GHOSH, A. & JAYARAMAN, G. (2014): Controlled release of a water soluble drug, metoprolol succinate, by α-lactalbumin microparticles. Int. J. Pharm. Pharm. Sci., 6, 762–767.
WANG, H., HAO, L., WANG, P., CHEN, M., JIANG, S. & JIANG, S. (2017): Release kinetics and antibacterial activity of curcumin loaded zein fi bers. Food Hydrocolloid., 63, 437–446.