Craniofacial characteristics of Syrian adolescents with Class II division 1 malocclusion: a retrospective study
Alaa Al Ayoubi1, Daniel Dalla Torre2and Melinda Madléna1
1Department of Orthodontics and Pediatric Dentistry, Faculty of Dentistry, University of Szeged, Szeged, Hungary
2University Clinic of Craniomaxillofacial Surgery, Medical University Innsbruck, Innsbruck, Austria
ABSTRACT
Background:Malocclusion characteristics vary across different ethnic groups and populations. Limited data are available regarding the characteristics of Syrian adolescents with Class II division 1 (Class II-1) malocclusion, and the recent inflow of Syrian refugees and immigrants into Europe and many areas worldwide demonstrate the need for updated studies to discover the craniofacial characteristics of these new immigrants.
Objectives:The present compound cephalometric and tooth-size study sought to assess the dentofacial morphology, upper-airway dimensions, and tooth-size characteristics of Syrian adolescents with Class II-1 malocclusion and compare the results with established Syrian population norms.
Materials and Methods:The study sample consisted of 43 Syrian patients including 24 females and 19 males with Class II-1 malocclusion (age: 14.3 (±1.5) years, mean (±SD)). Cephalometric radiographs and orthodontic casts were analyzed using special orthodontic software (OnyxCeph3TM) and a universal digital caliper, respectively. Statistics were calculated using the SPSS software.
Results:In Syrian adolescents with Class II-1 malocclusion, the position of the mandible relative to the nasion perpendicular (mean (95% confidence interval)) was−11.01 (−12.45,−9.57) mm. Facial axis angle showed a negative value:
−6.25 (−7.65, −4.85) degrees. An obtuse nasolabial angle was observed: 104.05 (101.77, 106.33) degrees. The average width of the upper pharynx was 11.50 (10.53, 12.47) mm; however, there was no prevalence of an upper-pharyngeal width of 5 mm or less. The average value of the anterior tooth-size ratio was 80.69 (79.85, 81.53) percent. In total, 39.5% of the investigated subjects had anterior ratios outside two standard deviations from Bolton’s norm, while 25.6% of the investigated subjects had anterior ratios outside two standard deviations from Syrian population norm.
Conclusions:In this study, the inter-maxillary discrepancy of Class II-1 Syrian adolescents was a consequence of their hyperdivergent facial pattern. The observed small pharyngeal widths were not clinically significant, while the anterior tooth-size discrepancy might be clinically relevant.
Submitted22 January 2020 Accepted24 June 2020 Published15 July 2020 Corresponding authors Alaa Al Ayoubi,
alaa.alayoubi@outlook.com Melinda Madléna,
madlenamelinda784@gmail.com Academic editor
Maha El Tantawi
Additional Information and Declarations can be found on page 13
DOI10.7717/peerj.9545 Copyright
2020 Al Ayoubi et al.
Distributed under
Creative Commons CC-BY 4.0
Subjects Anatomy and Physiology, Dentistry, Evidence Based Medicine, Radiology and Medical Imaging
Keywords Dentofacial morphology, Upper airway, Tooth size, Class II division 1 malocclusion, Syrian adolescents
INTRODUCTION
In orthodontics, it is essential to understand the complex relationship between skeletal, dental and facial aberrations in each malocclusion to achieve an accurate diagnosis followed by an optimal treatment plan. Class II division 1 (Class II-1) malocclusion has been suggested as the most frequent pathology that orthodontists may encounter in their practice. According to epidemiologic studies conducted among different populations, the prevalence of this malocclusion ranges from 12 to 40% worldwide (Table S1) (Massler & Frankel, 1951;Thilander & Myrberg, 1973;Foster & Walpole Day, 1974;
El-Mangoury & Mostafa, 1990;Lew, Foong & Loh, 1993;Saleh, 1999;Silva & Kang, 2001;
Thilander et al., 2001;Onyeaso, 2004;Tausche, Luck & Harzer, 2004;Gábris, Márton &
Madléna, 2006;Borzabadi-Farahani, Borzabadi-Farahani & Eslamipour, 2009;Perillo et al., 2009;Bugaighis & Karanth, 2013;Alatrach, Saleh & Osman, 2014;Nadim, Aslam &
Rizwan, 2014;Singh & Sharma, 2014;Bilgic, Gelgor & Celebi, 2015;De Souza et al., 2016;
Albakri, Ingle & Assery, 2018;Shyagali et al., 2019).
Numerous studies have investigated the cephalometric and tooth-size characteristics of patients with Class II-1 malocclusion using various measurements either on
cephalometric radiographs or orthodontic casts. However, the significance of these studies is limited by multiple factors, including the conflicting results; some cephalometric studies have reported that a retrognathic mandible is the key factor contributing to Class II-1 malocclusion with a normally positioned maxilla (Riedel, 1952;Hitchcock, 1973;Freitas et al., 2005;Sayın & Türkkahraman, 2005;Isik et al., 2006). In contrast, other studies have indicated that maxillary protrusion is the most common feature of Class II-1 malocclusion with a neutral mandibular position (Altemus, 1955;Rothstein & Yoon-Tarlie, 2000).
Finally, some researchers have described the malpositioning of both the maxilla and mandible in this condition (Drelich, 1948;Lau & Hägg, 1999;Al-Khateeb & Al-Khateeb, 2009). Likewise, inconsistent results have been reported regarding the relationship between Class II-1 malocclusion and upper-airway dimensions, where some investigators suggested Class II-1 malocclusion may have an influence on the upper-airway dimensions (Mergen & Jacobs, 1970;Silva et al., 2015;Soni et al., 2015) while other authors did not find a significant correlation between the two (Sosa, Graber & Muller, 1982;Ceylan &
Oktay, 1995;Bollhalder et al., 2013). Further, a number of tooth-size studies have investigated Class II-1 malocclusion; their results were also contradictory, with some reporting significant differences in tooth-size ratios between Class II-1 malocclusion and Class I malocclusion or normal occlusion (Fattahi, Pakshir & Hedayati, 2006;
Wędrychowska-Szulc, Janiszewska-Olszowska & Stepien, 2010;Mollabashi et al., 2019) and others indicating no significant differences in this regard (Crosby & Alexander, 1989;
Oktay & Ulukaya, 2010;Machado et al., 2018).
It is also important to consider that most of these previous studies were performed on radiographs or casts of Caucasians or without mention of the ethnicity of the investigated subjects, ignoring the fact that ethnicity is an important etiologic factor in Class II malocclusion (Lau & Hägg, 1999;Ishii, Deguchi & Hunt, 2002). Because of recent wars and conflicts, such as the Syrian conflict, ethnic diversity is increasing worldwide. During the last few years, Syrian refugees and immigrants have occupied the foreground of migration statistics, particularly in Europe (Eurostat Database, 2019). Data show that the population of Syrian immigrants has reached 8.2 million in 2019 and is considered to be among the fastest-growing populations of ethnic minorities (DESTATIS, 2018;United Nations Population Division, 2019). This inflow of Syrian refugees and immigrants into Europe and in many areas worldwide demonstrate the need for updated studies to discover the craniofacial characteristics of these new immigrants. Former studies on the Syrian population aimed to establish cephalometric and tooth-size norms (Nourallah et al., 2005;
Al Sabbagh, 2014). However, limited data are available on the characteristics of Syrian adolescents with Class II-1 malocclusion.
The objective of this study was to elucidate the cephalometric and tooth-size characteristics of Syrian adolescents with Class II-1 malocclusion and compare the acquired data with those of Syrian population norms.
MATERIALS AND METHODS
Subjects
Ethical approval for the present retrospective study was obtained from the Human Investigation Review Board at the University of Szeged (151/2018-SZTE). Written informed consent to participate in this study was provided by the participants’guardians/
parents.
According to previous dentofacial, upper-airway, and tooth-size studies, effect sizes were estimated from the Pog-Np distance 7.8 (±8.1) mm (Sayın & Türkkahraman, 2005), the upper-pharyngeal width 3.1 (±2.6) mm (Mergen & Jacobs, 1970), and the upper first molar’s width 0.2 (±0.2) mm (Lavelle, 1972). On the basis of a significance level of alpha of 0.05 (two-sided) with a power of 80%, the sample size was calculated to detect the standardized effect sizes of 0.96 (7.8/8.1 mm), 1.19 (3.1/2.6 mm) and 1 (0.2/0.2 mm) for dentofacial, upper-airway and tooth-size comparisons, respectively. Sample size calculations when considering these three types of comparisons showed that 17 patients of each gender were necessary for inclusion in the present study (Hulley et al., 2013). As a consequence, cephalometric radiographs and orthodontic casts of 43 untreated patients with skeletal and dental Class II-1 malocclusion (24 females and 19 males, age: 14.3 (±1.5) years, mean (±standard deviation)) were selected from a private orthodontic practice in Damascus, Syria, based on the following inclusion criteria:
Adolescents of Syrian origin aged between 12 and 17 years
Overjet of more than 4 mm with an absence of retroclination of the upper incisors (1U/NA angle≥22 degrees)
Permanent dentition with bilateral distal occlusion (half-unit or greater)
ANB angle of more than 4 degrees with a convex facial profile
Absence of extractions or interproximal caries/restorations or any other condition that affects the dental mesiodistal distance
Patients with craniofacial syndromes or a history of trauma as well as previous orthodontic treatment were excluded from this study. Additionally, we excluded patients with cephalograms in which a swallowing action or obvious hyperplasia of tonsils and adenoids was detected.
Two previous studies on the Syrian population were used as sources of normative cephalometric and tooth-size measurements (Nourallah et al., 2005;Al Sabbagh, 2014) (Table S2).
Age and gender distributions in the present study sample and normative studies’
samples used as sources of normative measurements are shown inTable S3.
Cephalometric measurements
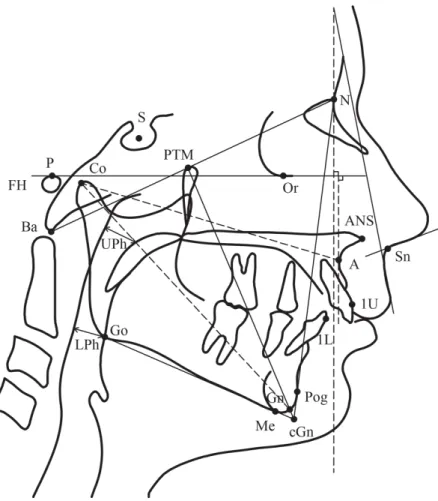
Pretreatment lateral cephalometric radiographs were taken for each patient with the head in the natural position using a dental radiograph system (PAX 400; Vatech Co., Hawseong, Korea). The sameX-ray machine was used to acquire cephalograms in the normative cephalometric study using the same protocol (Al Sabbagh, 2014). The cephalometric measurements used in this study were derived from the analyses developed byMcNamara (1984)andMcNamara, Brust & Riolo (1992). Reference landmarks and lines are illustrated inFig. 1. Definitions of the cephalometric measurements are shown inTable S4. Each radiograph was digitized and analyzed by one investigator (A. A.) using a special orthodontic software program (OnyxCeph3TM, Image Instruments GmbH, Chemnitz, Germany). Additionally, upper-pharyngeal widths were computed for all Class II-1 subjects whose values were equal to 5 mm or less (McNamara, 1984).
Orthodontic cast measurements
The mesiodistal crown diameters of all teeth from the rightfirst permanent molar to the leftfirst permanent molar on each cast were measured to the nearest 0.01 mm by one investigator (A. A.) using a universal digital caliper (MIB Messzeuge GMBH, Spangenberg, Germany). The measurements were conducted according to the methods described by Seipel (1946)andMoorrees & Reed (1964). The same method was used in the normative tooth-size study (Nourallah et al., 2005). Bolton’s overall ratio (sum of mesiodistal widths of 12 mandibular teeth divided by the sum of mesiodistal widths of 12 maxillary teeth multiplied by 100) and Bolton’s anterior ratio (sum of mesiodistal widths of six mandibular anterior teeth divided by the sum of mesiodistal widths of six maxillary anterior teeth multiplied by 100) were calculated and used in the statistical analysis (Bolton, 1958). Overall and anterior ratios were computed for all Class II-1 subjects whose values were outside two SDs from Bolton’s norms (Bolton, 1958) and were also computed for all Class II-1 subjects whose values were outside two SDs from Syrian population norms (Nourallah et al., 2005).
Method error
Following a random selection of 10 patients, all measurements on their cephalometric radiographs and orthodontic casts were retaken 2 months later by the same investigator.
To evaluate the method error, both measurements were compared using three approaches.
First, the random method error was established according to Dahlberg’s formula (Dahlberg, 1940). The method errors for angular and linear measurements on
cephalometric radiographs were within 0.64 degrees and 0.42 mm, respectively, while the method error for tooth-size measurements on orthodontic casts did not exceed 0.19 mm, and the errors of anterior and overall tooth-size ratios were 0.62 and 0.39, respectively.
Second, the systematic error was investigated by paired samplet-tests;results showed that no systematic error could be found (p> 0.05). Finally, intraclass correlation coefficients were calculated for all variables; results ranged from 0.935 to 0.999.
Inter-examiner reliability was established to investigate the potential investigator bias.
Measurements of 10 randomly selected cephalograms and casts were replicated for a second time by another investigator. Random errors were within 0.53 mm and 0.61 degrees for linear and angular cephalometric variables, respectively, and within 0.28 mm for tooth-size measurements. Random errors of anterior and overall tooth-size ratios were
Figure 1 Reference cephalometric landmarks and lines used in this study.
Full-size DOI: 10.7717/peerj.9545/fig-1
0.56 and 0.47, respectively. Systematic error was absent (p> 0.05) and intraclass correlation coefficients were above 0.92.
Statistical analysis
Descriptive statistics (Means, SDs and 95% CIs) of all variables were calculated with the use of the SPSS software 24.0 (SPSS Inc., Chicago, IL, USA). All variables in the total group (43 Syrian adolescents with Class II-1 malocclusion) and within each gender group (24 Syrian females and 19 Syrian males) were normally distributed according to Shapiro–Wilk test.
RESULTS
Data presenting gender-based and general characteristics of Syrian adolescents with Class II-1 malocclusion are summarized inTable 1.
Two variables (A-NP, SNA) were used to assess the sagittal position of the maxilla.
The linear variable (A-NP) showed a value of 0.01 (±2.33) mm. The angular variable (SNA) showed a value of 80.46 (±2.66) degrees. The sagittal mandibular position was determined by one linear variable (Pog-NP) with a value of−11.01 (±4.69) mm.
The effective length of the maxilla (Cond-A) was 85.51 (±4.48) mm. The effective length of the mandible (Cond-Gn) was 107.98 (±5.55) mm. The difference between the maxillary length and the mandibular length (Max-Mand) was 22.47 (±4.39) mm.
Results in the vertical plane were as follows: First, lower anterior facial height (ANS-Me) showed a value of 68.30 (±5.09) mm. Second, mandibular plane angle (MP-FH) showed a value of 29.77 (±5.62) degrees. Third, facial axis (facial axis) showed a value of−6.25 (±4.56) degrees.
For incisors position determination, two linear variables were used: First, maxillary incisors position (1U-AP) showed a value of 5.86 (±2.05) mm. Second, mandibular incisors position (1L-APog) showed a value of 4.85 (±1.89) mm.
Soft tissue measurements showed an obtuse nasolabial angle (NLA) of 104.05 (±7.42) degrees. Further, the value of the upper-lip angle (UL-NP) was 11.05 (±7.60) degrees.
Regarding upper-airway dimensions, upper and lower-pharyngeal widths (UPh, LPh) were assessed. The upper-pharyngeal width (UPh) was 11.50 (±3.15) mm.
The lower-pharyngeal width (LPh) was 10.98 (±2.90) mm. However, there was no prevalence of upper-pharyngeal obstructions (upper-pharyngeal width≤ 5 mm) in the subjects of this study.
Bolton tooth-size analysis revealed that the anterior ratio was 80.69 (±2.73) percent, while the overall ratio was 92.84 (±1.70) percent.
The percentage of Class II-1 patients who had anterior ratios greater than two SDs from Bolton’s norm (77.2 (±1.65) percent) (Bolton, 1958) was 39.5%, whereas the percentage of Class II-1 patients who had anterior ratios greater than two SDs from Syrian population norm (78.99 (±2.18) percent) (Nourallah et al., 2005) was 25.6%.
The percentage of Class II-1 patients who had overall ratios greater than two SDs from Bolton’s norm (91.3 (±1.91) percent) (Bolton, 1958) was 6.98%, whereas none of Class II-1 patients had overall ratios greater than two SDs from Syrian population norm
(92.26 (±2.06) percent) (Nourallah et al., 2005). Additionally, none of Class II-1 patients had anterior or overall ratios smaller than two SDs from Bolton’s norms (Bolton, 1958), and none of Class II-1 patients had anterior or overall ratios smaller than two SDs from Syrian population norms (Nourallah et al., 2005).
DISCUSSION
Several studies have reported the cephalometric and tooth-size features of individuals of Middle Eastern ethnicity (Al Jundi & Riba, 2014;Ali, El-Shorbagy & Elliathy, 2016;
Fouda, Hafez & Al-Awdi, 2017;Mollabashi et al., 2019;ElAbbasy, 2019). Although Syrians
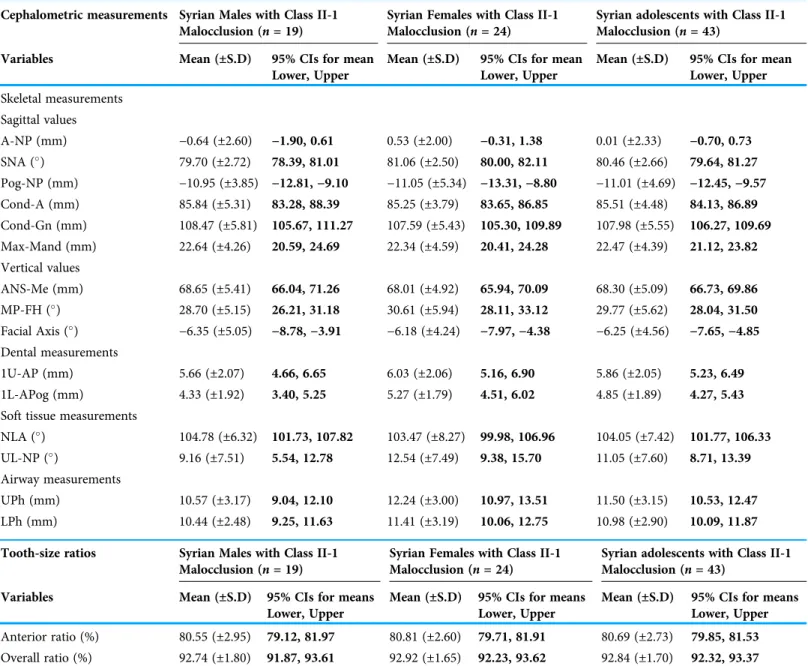
Table 1 Cephalometric measurements and tooth-size ratios of Syrian adolescents with Class II-1 malocclusion.
Cephalometric measurements Syrian Males with Class II-1 Malocclusion (n= 19)
Syrian Females with Class II-1 Malocclusion (n= 24)
Syrian adolescents with Class II-1 Malocclusion (n= 43)
Variables Mean (±S.D) 95% CIs for mean
Lower, Upper
Mean (±S.D) 95% CIs for mean Lower, Upper
Mean (±S.D) 95% CIs for mean Lower, Upper Skeletal measurements
Sagittal values
A-NP (mm) −0.64 (±2.60) −1.90, 0.61 0.53 (±2.00) −0.31, 1.38 0.01 (±2.33) −0.70, 0.73
SNA () 79.70 (±2.72) 78.39, 81.01 81.06 (±2.50) 80.00, 82.11 80.46 (±2.66) 79.64, 81.27 Pog-NP (mm) −10.95 (±3.85) −12.81,−9.10 −11.05 (±5.34) −13.31,−8.80 −11.01 (±4.69) −12.45,−9.57 Cond-A (mm) 85.84 (±5.31) 83.28, 88.39 85.25 (±3.79) 83.65, 86.85 85.51 (±4.48) 84.13, 86.89 Cond-Gn (mm) 108.47 (±5.81) 105.67, 111.27 107.59 (±5.43) 105.30, 109.89 107.98 (±5.55) 106.27, 109.69 Max-Mand (mm) 22.64 (±4.26) 20.59, 24.69 22.34 (±4.59) 20.41, 24.28 22.47 (±4.39) 21.12, 23.82 Vertical values
ANS-Me (mm) 68.65 (±5.41) 66.04, 71.26 68.01 (±4.92) 65.94, 70.09 68.30 (±5.09) 66.73, 69.86 MP-FH () 28.70 (±5.15) 26.21, 31.18 30.61 (±5.94) 28.11, 33.12 29.77 (±5.62) 28.04, 31.50 Facial Axis () −6.35 (±5.05) −8.78,−3.91 −6.18 (±4.24) −7.97,−4.38 −6.25 (±4.56) −7.65,−4.85 Dental measurements
1U-AP (mm) 5.66 (±2.07) 4.66, 6.65 6.03 (±2.06) 5.16, 6.90 5.86 (±2.05) 5.23, 6.49
1L-APog (mm) 4.33 (±1.92) 3.40, 5.25 5.27 (±1.79) 4.51, 6.02 4.85 (±1.89) 4.27, 5.43 Soft tissue measurements
NLA () 104.78 (±6.32) 101.73, 107.82 103.47 (±8.27) 99.98, 106.96 104.05 (±7.42) 101.77, 106.33 UL-NP () 9.16 (±7.51) 5.54, 12.78 12.54 (±7.49) 9.38, 15.70 11.05 (±7.60) 8.71, 13.39 Airway measurements
UPh (mm) 10.57 (±3.17) 9.04, 12.10 12.24 (±3.00) 10.97, 13.51 11.50 (±3.15) 10.53, 12.47 LPh (mm) 10.44 (±2.48) 9.25, 11.63 11.41 (±3.19) 10.06, 12.75 10.98 (±2.90) 10.09, 11.87 Tooth-size ratios Syrian Males with Class II-1
Malocclusion (n= 19)
Syrian Females with Class II-1 Malocclusion (n= 24)
Syrian adolescents with Class II-1 Malocclusion (n= 43)
Variables Mean (±S.D) 95% CIs for means
Lower, Upper
Mean (±S.D) 95% CIs for means Lower, Upper
Mean (±S.D) 95% CIs for means Lower, Upper Anterior ratio (%) 80.55 (±2.95) 79.12, 81.97 80.81 (±2.60) 79.71, 81.91 80.69 (±2.73) 79.85, 81.53 Overall ratio (%) 92.74 (±1.80) 91.87, 93.61 92.92 (±1.65) 92.23, 93.62 92.84 (±1.70) 92.32, 93.37 Notes:
CIs, confidence intervals; S.D, standard deviation.
Bold values indicate lower and upper bounds of 95% confidence intervals for mean.
belong to the Middle Eastern ethnic group, limited data are available pertaining to the craniofacial characteristics of adolescents of Syrian nationality. Therefore, this compound cephalometric and tooth-size study was attempted to establish the dentofacial morphology, upper-airway dimensions, and tooth-size characteristics of Syrian adolescents with both skeletal and dental Class II-1 malocclusion. To our knowledge, this is thefirst comprehensive study on this topic.
In addition, 95% confidence intervals (CIs) for the means of cephalometric and tooth-size variables in the present study sample (Class II-1 malocclusion) (Table 1) were compared with 95% CIs for the means of normative cephalometric and tooth-size variables (Table S2) obtained from two previous studies (Nourallah et al., 2005;
Al Sabbagh, 2014) and with 95% CIs for the means of the corresponding variables in previous Middle Eastern studies on Class II-1 malocclusion (Table S5).
Skeletal components
In this study, the maxillary anteroposterior position was normal relative to the normative data, while the mandible was posteriorly positioned (CIs of A-NP, SNA, and Pog-NP in Table 1vs. their corresponding values inTable S2); thesefindings were in agreement with those of several Middle Eastern studies (Demir, Uysal & Basciftci, 2005;Sayın &
Türkkahraman, 2005;Isik et al., 2006;Mortazavi, Salehi & Ansari, 2009;Al Jundi & Riba, 2014) (CIs of A-NP, and Pog-NP inTable 1vs. their corresponding values inTable S5).
However, other Middle Eastern studies have reported different results (Al-Khateeb &
Al-Khateeb, 2009;Ali, 2014); a possible reason for the divergence infindings could be, on the one hand, due to differences in the methods used for the determination of the maxillary and mandibular position (Pancherz, Zieber & Hoyer, 1997), while on the other hand, the involvement of different nationalities in the various studies may explain the range of results. Furthermore, previous Middle Eastern studies have suggested that the majority of Class II-1 patients may have abnormal development of the mandible, both in terms of size and in terms of position (Sayın & Türkkahraman, 2005;Mortazavi, Salehi & Ansari, 2009;Al Jundi & Riba, 2014). In this study, although a shorter absolute mandibular length was observed among Class II-1 subjects, the absolute maxillary length was also shorter when compared with the normative data, resulting in a normal maxillomandibular difference (CIs of Cond-A, Cond-Gn and Max-Mand inTable 1 vs. their corresponding values inTable S2). In the interpretation of such data, the difference between maxillary and mandibular lengths should also be considered because a geometric relationship exists between both measurements (McNamara, 1984). The normal maxillomandibular
difference in this study confirms that mandibular length was proportional to the maxillary length. Therefore, the short mandibular and maxillary lengths do not represent a
conclusive feature of Class II-1 subjects included in this study rather than a potential difference between this study and the cephalometric control study in estimating the point
“condylion.”This point was considered by McNamara as“often difficult tofind” and used as a measure of the lengths of both jaws; therefore, a slight difference in the estimation of condylion will simply affect the absolute lengths of both jaws but will not impact the maxillomandibular difference (McNamara, 1984).
A prominent feature of subjects with Class II-1 malocclusion in the present study was the hyperdivergent facial pattern. The retruded mandible appeared to be accompanied by an increased mandibular plane angle and opened facial axis in both genders and excessive lower anterior facial height that was clear enough in females (CIs of ANS-Me, MP-FH and Facial Axis inTable 1vs. their corresponding values inTable S2). A review of the Middle Eastern literature suggests wide agreement with these results (Sayın &
Türkkahraman, 2005;Isik et al., 2006;Al-Khateeb & Al-Khateeb, 2009;Mortazavi, Salehi &
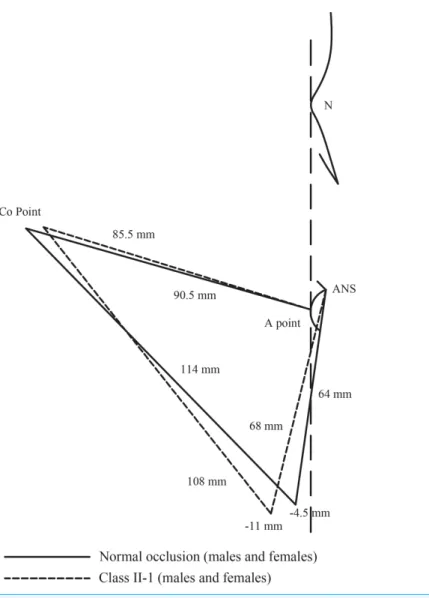
Ansari, 2009;Ali, 2014;Al Jundi & Riba, 2014) (CIs of MP-FH inTable 1vs. their corresponding values inTable S5). Therefore, the posterior position of the mandible and, consequently, the inter-maxillary discrepancy of Class II-1 subjects in this study may be seen as a feature of the hyperdivergent facial pattern, as determined by the increased lower anterior facial height and backward rotation of the mandible (Fig. 2).
Figure 2 Comparison between Class II-1 subjects and normal occlusion subjects regarding the
skeletal parameters. Full-size DOI: 10.7717/peerj.9545/fig-2
Dentoalveolar components
Dentoalveolar aberrations were represented by protrusive mandibular incisors that were clear enough in females, whereas maxillary incisors were normally positioned in both genders when compared with the normative data (CIs of 1U-AP and 1L-APog inTable 1vs.
their corresponding values inTable S2). Thesefindings contradicted those of certain Middle Eastern studies (Demir, Uysal & Basciftci, 2005;Ali, 2014). However, other Middle Eastern studies confirmed normally positioned maxillary incisors (Sayın & Türkkahraman, 2005) and more protrusive mandibular incisors existed in Class II-1 malocclusion (Al-Khateeb & Al-Khateeb, 2009;Mortazavi, Salehi & Ansari, 2009;Al Jundi & Riba, 2014) (CIs of 1U-AP and 1L-APog inTable 1vs. their corresponding values inTable S5).
The inconsistentfindings between this study and other previous studies might be owing to the use of different reference lines for the determination of the incisors position or might be attributed to the variations in the nationality background of the studied samples.
In the present study, the protrusion of mandibular incisors in Class II-1 subjects (especially in females) might be attributed to the dentoalveolar compensatory mechanism in response to the underlying skeletal discrepancy attempting to maintain relatively normal relationships between the dental arches (Solow, 1980). Another explanation might be the relative tooth-size excess observed in the mandibular anterior segment (see below), since the protrusion of mandibular incisors could occur because of space limitations.
Soft tissue components
The soft tissue parameters of Class II-1 subjects, when compared with the normative data, showed a more obtuse nasolabial angle (CIs of NLA inTable 1 vs. their corresponding values in Table S2). A previous Middle Eastern study found that Class II subjects had a greater value of the nasolabial angle than those with Class I; however, the difference was not significant (Gulsen et al., 2006). Conversely, other Middle Eastern studies suggested different results (Al-Saleem, 2013;Mohammed, Nissan & Taha, 2013) (CIs of NLA in Table 1vs. their corresponding values inTable S5). A probable reason for this variability among outcomes might be the differences in the methods used to determine the nasolabial angle (Hwang, Kim & McNamara, 2000). Moreover, nationality differences may be a possible reason for such variability in soft tissue results.
Since there was no difference in the upper-lip angulation (CIs of UL-NP inTable 1vs.
their corresponding values inTable S2), ourfindings suggest that the angulation of the lower border of the nose may be a reason for the more obtuse nasolabial angle in Class II-1 subjects. In the present study, it was not possible to investigate the slope of the lower nasal border because there was no normative data available on this variable.Fitzgerald, Nanda & Currier (1992)established a reliable method of constructing the nasolabial angle to determine the interrelationship between the nose and the upper lip. Further
investigations that consider using this method are needed to validate our results.
Upper-airway dimensions
In the present study, upper-pharyngeal widths when compared with the normative data were smaller in Class II-1 subjects, and lower-pharyngeal widths showed smaller widths
that were clear enough in males (CIs of UPh and LPh inTable 1vs. their corresponding values inTable S2). Thesefindings support the results of previous Middle Eastern studies (Ali, 2014;Elwareth Abd Elrazik Yousif, 2015;Gholinia, Habibi & Amrollahi Boyouki, 2019) (CIs of UPh and LPh inTable 1vs. their corresponding values inTable S5).
In contrast, some Middle Eastern studies denied that a relationship exists between Class II-1 malocclusion and airway dimensions (Abu Allhaija & Al-Khateeb, 2005;
Uslu-Akcam, 2017). An explanation for the contrasting results might be an overlap between etiologic factors, including abnormal skeletal morphology and abnormal upper-airway soft tissue structures (Ferguson et al., 1995). In this study, the observed smaller pharyngeal widths might be attributable to the hyperdivergent facial pattern associated with Class II-1 malocclusion; this corroborates previous results in the Middle Eastern literature (Elwareth Abd Elrazik Yousif, 2015).
McNamara emphasized that an upper-pharyngeal width of 5 mm or less can be used as an indicator of possible airway obstruction, whereas lower pharyngeal measurements smaller than average values are not remarkable (McNamara, 1984). According to this indicator, there was no prevalence of pharyngeal obstructions in the subjects of this study.
However, a more accurate diagnosis can be made only by an otorhinolaryngologist (McNamara, 1984).
Tooth-size characteristics
Former Middle Eastern studies have indicated that tooth-size disharmonies exist among different groups of malocclusion (Fattahi, Pakshir & Hedayati, 2006;Mollabashi et al., 2019). In accordance with our results on tooth-size ratios (CIs of anterior ratio and overall ratio in Table 1vs. their corresponding values inTable S2), some Middle Eastern studies did notfind differences in overall ratios between Class II-1 subjects and the normative data (Asiry & Hashim, 2012), whereas other Middle Eastern studies described an overall ratio for Class II-1 subjects that was smaller (Mollabashi et al., 2019;
Shamaa, 2019) or larger (Uysal et al., 2005) compared to that of subjects with normal occlusion. Similarly, variability can be found in the Middle Eastern literature regarding the anterior ratio, whereas a smaller ratio (Fattahi, Pakshir & Hedayati, 2006) or no differences were detected (Uysal et al., 2005;Asiry & Hashim, 2012) (CIs of anterior ratio and overall ratio inTable 1vs. their corresponding values inTable S5). Such divergence infindings may be explained by differences in the nationality background of the samples.
Several studies confirmed that a tooth-size disharmony greater than two SDs, as compared with Bolton’s norms, could create clinical difficulties, particularly in the finishing phase of treatment (Crosby & Alexander, 1989;Wędrychowska-Szulc,
Janiszewska-Olszowska & Stepien, 2010). In contrast, one study suggested that Bolton’s SDs may not be a valuable index to use to determine the clinical significance of tooth-size disharmony because of their relatively modest values (Othman & Harradine, 2006).
Therefore, the frequencies of tooth-size discrepancy outside two SDs from Bolton’s norms as well as the frequencies of tooth-size discrepancy outside two SDs from Syrian
population norms were calculated in this study. The percentage of patients with
anterior ratios greater than two SDs from Bolton’s norm was 39.5%, while the percentage of patients who had anterior ratios greater than two SDs from Syrian population norm was 25.6%, representing a relative tooth-size excess in the mandibular anterior
segment that was great enough to warrant clinical concern. These relatively high percentages of patients with an anterior ratio exceeding two SDs may be explained by the association of a higher percentage of tooth-size disharmonies and sufficiently remarkable malocclusions such as Class II-1 malocclusion. These disharmonies are particularly evident in the anterior segment, since the anterior teeth, especially the incisors, have the greatest incidence of tooth-size variations (Fattahi, Pakshir & Hedayati, 2006).
Limitations
As far as limitations of the current study were concerned, consideration must be given to the sample size. Although the sample size estimation showed sufficient sample size for each gender group, the sample size was small; therefore, the results should be interpreted with caution and further studies with larger sample size are warranted. Such studies should also include adolescents from several orthodontic centers, since the data in the present study were recruited from only one private orthodontic practice in Syria. Additionally, there was no concurrent control group in this study. The inclusion of a matched control group in this investigation would have been desirable for a better comparison, although, in the case of normative cephalometric data, requiring the exposure of patients with well-balanced dentofacial relationships toX-ray radiation constitutes an ethical issue.
As an alternative, already established cephalometric and tooth-size data were used as sources of normative measurements (Nourallah et al., 2005;Al Sabbagh, 2014). Although age could not be a confounding factor in tooth-size analysis, a wider age range was used in the normative cephalometric study than that in this study which could be a confounding factor in the cephalometric analysis. Because no other cephalometric data have been published on Syrian adolescent norms; these published data, therefore, were used as sources of normative measurements.
CONCLUSIONS
In this study, cephalometric results showed that a hyperdivergent facial pattern was the main cause of the inter-maxillary discrepancy in Syrian adolescents with Class II-1 malocclusion, while the observed small pharyngeal widths were not clinically significant.
Tooth-size results revealed that 39.5% of samples had anterior ratios exceeding two SDs of Bolton’s norm and 25.6% of samples had anterior ratios exceeding two SDs of Syrian population norm, which may be considered as clinically relevant.
Determining the craniofacial characteristics of Class II-1 malocclusion in the young Syrian population would help orthodontists to establish an effective protocol for long-term stable treatment of Syrian orthodontic patients.
ADDITIONAL INFORMATION AND DECLARATIONS
Funding
The authors received no funding for this work.
Competing Interests
The authors declare that they have no competing interests.
Author Contributions
Alaa Al Ayoubi conceived and designed the experiments, performed the experiments, analyzed the data, preparedfigures and/or tables, authored or reviewed drafts of the paper, and approved thefinal draft.
Daniel Dalla Torre analyzed the data, authored or reviewed drafts of the paper, and approved thefinal draft.
Melinda Madléna conceived and designed the experiments, analyzed the data, authored or reviewed drafts of the paper, and approved thefinal draft.
Human Ethics
The following information was supplied relating to ethical approvals (i.e., approving body and any reference numbers):
Ethical approval for the present study was obtained from the Human Investigation Review Board at the University of Szeged (151/2018-SZTE).
Data Availability
The following information was supplied regarding data availability:
The raw measurements are available in theSupplemental Files.
Supplemental Information
Supplemental information for this article can be found online athttp://dx.doi.org/10.7717/
peerj.9545#supplemental-information.
REFERENCES
Abu Allhaija ES, Al-Khateeb SN. 2005.Uvulo–Glosso–Pharyngeal dimensions in different anteroposterior skeletal patterns.Angle Orthodontist75:1012–1018
DOI 10.1043/0003-3219(2005)75[1012:UDIDAS]2.0.CO;2.
Al Jundi A, Riba H. 2014.Characteristics of craniofacial complex for class II division 1 malocclusion in Saudi subjects with permanent dentition.Global Journal of Medical Research14:1–9.
Al Sabbagh R. 2014.Syrian norms of McNamara cephalometric analysis.International Arab Journal of Dentistry5(3):95–101DOI 10.12816/0028756.
Al-Khateeb EA, Al-Khateeb SN. 2009.Anteroposterior and vertical components of Class II division 1 and division 2 malocclusion.Angle Orthodontist79(5):859–866
DOI 10.2319/062208-325.1.
Al-Saleem NR. 2013.Comparison of lip analyses in skeletal class I normal occlusion and class II division 1 Malocclusion.Al-Rafidain Dental Journal13(2):192–201
DOI 10.33899/rden.2013.84690.
Alatrach AB, Saleh FK, Osman E. 2014.The prevalence of malocclusion and orthodontic treatment need in a sample of Syrian children.European Scientific Journal10:230–247.
Albakri FM, Ingle N, Assery MK. 2018.Prevalence of malocclusion among male school children in Riyadh city.Open Access Macedonian Journal of Medical Sciences6(7):1296–1299
DOI 10.3889/oamjms.2018.207.
Ali AI. 2014.Mcnamara’s cephalometric analysis for Iraqi population in Mosul city.
International Journal of Enhanced Research in Science Technology & Engineering3:287–299.
Ali RSE-D, El-Shorbagy EM, Elliathy MM. 2016.Relationship of interarch tooth-size discrepancy to occlusion.Egyptian Dental Journal62(1):2979–2988DOI 10.21608/edj.2016.95079.
Altemus LA. 1955.Horizontal and vertical dentofacial relationships in normal and Class II division I malocclusion in girls 11–15 years.Angle Orthodontist25:120–137
DOI 10.1043/0003-3219(1955)025<0120:HAVDRI>2.0.CO;2.
Asiry M, Hashim H. 2012.Tooth size ratios in Saudi subjects with Class II, Division 1 malocclusion.Journal of International Oral Health4:29–34.
Bilgic F, Gelgor IE, Celebi AA. 2015.Malocclusion prevalence and orthodontic treatment need in central Anatolian adolescents compared to European and other nations’adolescents.
Dental Press Journal of Orthodontics20(6):75–81DOI 10.1590/2177-6709.20.6.075-081.oar.
Bollhalder J, Hänggi MP, Schätzle M, Markic G, Roos M, Peltomäki TA. 2013.Dentofacial and upper airway characteristics of mild and severe class II division 1 subjects.European Journal of Orthodontics35(4):447–453DOI 10.1093/ejo/cjs010.
Bolton WA. 1958.Disharmony in tooth size and its relation to the analysis and treatment of malocclusion.Angle Orthodontist28:113–130
DOI 10.1043/0003-3219(1958)028<0113:DITSAI>2.0.CO;2.
Borzabadi-Farahani A, Borzabadi-Farahani A, Eslamipour F. 2009.Malocclusion and occlusal traits in an urban Iranian population: an epidemiological study of 11-to 14-year-old children.
European Journal of Orthodontics31(5):477–484DOI 10.1093/ejo/cjp031.
Bugaighis I, Karanth D. 2013.The prevalence of malocclusion in urban Libyan schoolchildren.
Journal of Orthodontic Science2(1):1–6DOI 10.4103/2278-0203.110325.
Ceylanİ, Oktay H. 1995.A study on the pharyngeal size in different skeletal patterns.
American Journal of Orthodontics and Dentofacial Orthopedics108(1):69–75 DOI 10.1016/S0889-5406(95)70068-4.
Crosby DR, Alexander CG. 1989.The occurrence of tooth size discrepancies among different malocclusion groups.American Journal of Orthodontics and Dentofacial Orthopedics 95(6):457–461DOI 10.1016/0889-5406(89)90408-3.
Dahlberg G. 1940.Statistical methods for medical and biological students. London: George Alien and Unwin, Ltd.
De Souza RA, De Araújo Magnani MBB, Nouer DF, Romano FL, Passos MR. 2016.Prevalence of malocclusion in a Brazilian schoolchildren population and its relationship with early tooth loss.Brazilian Journal of Oral Sciences7:1566–1570.
Demir A, Uysal T, Basciftci FA. 2005.Determination of skeletal and dental characteristics of class II malocclusion.Turkish Journal of Orthodontics18(3):205–214
DOI 10.13076/1300-3550-18-3-205.
DESTATIS. 2018.Geburtenanstieg setzte sich 2016 fort.Available athttps://www.destatis.de/DE/
Presse/Pressemitteilungen/2018/03/PD18_115_122.html(accessed 11 September 2019).
Drelich RC. 1948.A cephalometric study of untreated class II, division 1 malocclusion1.
Angle Orthodontist18:70–75DOI 10.1043/0003-3219(1948)018<0070:ACSOUC>2.0.CO;2.
El-Mangoury NH, Mostafa YA. 1990.Epidemiologic panorama of dental occlusion.
Angle Orthodontist60:207–214DOI 10.1043/0003-3219(1990)060<0207:EPODO>2.0.CO;2.
ElAbbasy DO. 2019.Evaluation of the therapeutic effects of Sabbagh Universal Spring compared to Class II elastics in the treatment of Class II division 1 patients.Egyptian Dental Journal 65(4):3053–3067DOI 10.21608/edj.2019.73984.
Elwareth Abd Elrazik Yousif AA. 2015.Evaluation of upper and lower pharyngeal airway in hypo and hyper divergent Class I, II and III malocclusions in a group of Egyptian patients.
Tanta Dental Journal12(4):265–276DOI 10.1016/j.tdj.2015.07.001.
Eurostat Database. 2019.Asylum andfirst time asylum applicants by citizenship, age and sex Annual aggregated data (rounded).Available athttps://ec.europa.eu/eurostat/data/database (accessed 7 March 2019).
Fattahi HR, Pakshir HR, Hedayati Z. 2006.Comparison of tooth size discrepancies among different malocclusion groups.European Journal of Orthodontics28(5):491–495
DOI 10.1093/ejo/cjl012.
Ferguson KA, Ono T, Lowe AA, Ryan CF, Fleetham JA. 1995.The relationship between obesity and craniofacial structure in obstructive sleep apnea.Chest108(2):375–381
DOI 10.1378/chest.108.2.375.
Fitzgerald JP, Nanda RS, Currier GF. 1992.An evaluation of the nasolabial angle and the relative inclinations of the nose and upper lip.American Journal of Orthodontics and Dentofacial Orthopedics102(4):328–334DOI 10.1016/0889-5406(92)70048-F.
Foster TD, Walpole Day AJ. 1974.A survey of malocclusion and the need for orthodontic treatment in a Shropshire school population.British Journal of Orthodontics1(3):73–78 DOI 10.1179/bjo.1.3.73.
Fouda M, Hafez A, Al-Awdi M. 2017.Soft tissue profile changes in growing patients having class II division 1 malocclusion treated by modified activator with lip bumper.Indian Journal of Orthodontics and Dentofacial Research3(2):103–106DOI 10.18231/2455-6785.2017.0021.
Freitas MR, Santos MAC, Freitas KMS, Janson G, Freitas DS, Henriques JFC. 2005.
Cephalometric characterization of skeletal Class II, division 1 malocclusion in white Brazilian subjects.Journal of Applied Oral Science13(2):198–203
DOI 10.1590/S1678-77572005000200020.
Gholinia F, Habibi L, Amrollahi Boyouki M. 2019.Cephalometric evaluation of the upper airway in different skeletal classifications of jaws.Journal of Craniofacial Surgery30(5):e469–e474 DOI 10.1097/SCS.0000000000005637.
Gulsen A, Okay C, Aslan BI, Uner O, Yavuzer R. 2006.The relationship between craniofacial structures and the nose in Anatolian Turkish adults: A cephalometric evaluation.
American Journal of Orthodontics and Dentofacial Orthopedics130(2):131.e15–132.e25 DOI 10.1016/j.ajodo.2006.01.020.
Gábris K, Márton S, Madléna M. 2006.Prevalence of malocclusions in Hungarian adolescents.
European Journal of Orthodontics28(5):467–470DOI 10.1093/ejo/cjl027.
Hitchcock HP. 1973.A cephalometric description of Class II, Division 1 malocclusion.
American Journal of Orthodontics and Dentofacial Orthopedics63(4):414–423 DOI 10.1016/0002-9416(73)90146-2.
Hulley SB, Cummings SR, Browner WS, Grady DG, Newman TB. 2013.Designing clinical research. Philadelphia: Wolters Kluwer Health.
Hwang H-S, Kim W-S, McNamara JA. 2000.A comparative study of two methods of quantifying the soft tissue profile.Angle Orthodontist70:200–207
DOI 10.1043/0003-3219(2000)070<0200:ACSOTM>2.0.CO;2.
Ishii N, Deguchi T, Hunt NP. 2002.Morphological differences in the craniofacial structure between Japanese and Caucasian girls with Class II Division 1 malocclusions.
European Journal of Orthodontics24(1):61–67DOI 10.1093/ejo/24.1.61.
Isik F, Nalbantgil D, Sayinsu K, Arun T. 2006.A comparative study of cephalometric and arch width characteristics of Class II division 1 and division 2 malocclusions.European Journal of Orthodontics28(2):179–183DOI 10.1093/ejo/cji096.
Lau JWP, Hägg U. 1999.Cephalometric morphology of Chinese with class II division 1 malocclusion.British Dental Journal186(4):188–190DOI 10.1038/sj.bdj.4800059.
Lavelle CLB. 1972.Maxillary and mandibular tooth size in different racial groups and in different occlusal categories.American Journal of Orthodontics61(1):29–37
DOI 10.1016/0002-9416(72)90173-X.
Lew KK, Foong WC, Loh E. 1993.Malocclusion prevalence in an ethnic Chinese population.
Australian Dental Journal38(6):442–449DOI 10.1111/j.1834-7819.1993.tb04759.x.
Machado V, Botelho J, Pereira D, Vasques M, Fernandes-Retto P, Proença L, Mendes J-J, Delgado A. 2018.Bolton ratios in Portuguese subjects among different malocclusion groups.
Journal of Clinical and Experimental Dentistry10:e864–e868DOI 10.4317/jced.54977.
Massler M, Frankel JM. 1951.Prevalence of malocclusion in children aged 14 to 18 years.
American Journal of Orthodontics37(10):751–768DOI 10.1016/0002-9416(51)90047-4.
McNamara JA Jr, Brust EW, Riolo ML. 1992.Soft tissue evaluation of individuals with an ideal occlusion and a well-balanced face: esthetics and the Treatment of Facial Form. Craniofacial Growth Series. Ann Arbor: Center for Human Growth and Development, The University of Michigan, 115–146.
McNamara JA Jr. 1984.A method of cephalometric evaluation.American Journal of Orthodontics 86(6):449–469DOI 10.1016/S0002-9416(84)90352-X.
Mergen DC, Jacobs RM. 1970.The size of nasopharynx associated with normal occlusion and class II malocclusion.Angle Orthodontist40:342–346
DOI 10.1043/0003-3219(1970)040<0342:TSONAW>2.0.CO;2.
Mohammed SA, Nissan LMK, Taha SS. 2013.Soft tissue facial profile analysis of adult iraqis with different classes of malocclusion.Journal of Baghdad College of Dentistry325(4):1–9
DOI 10.12816/0015083.
Mollabashi V, Soltani MK, Moslemian N, Akhlaghian M, Akbarzadeh M, Samavat H, Abolvardi M. 2019.Comparison of Bolton ratio in normal occlusion and different malocclusion groups in Iranian population.International Orthodontics17(1):143–150
DOI 10.1016/j.ortho.2019.01.005.
Moorrees CFA, Reed RB. 1964.Correlations among crown diameters of human teeth.
Archives of Oral Biology9(6):685–697DOI 10.1016/0003-9969(64)90080-9.
Mortazavi M, Salehi P, Ansari G. 2009.Mandibular size and position in a group of 13–15 years old iranian children with class II division 1 malocclusion.Research Journal of Biological Sciences 4:531–536.
Nadim R, Aslam K, Rizwan S. 2014.Frequency of malocclusion among 12-15 years old school children in three sectors of Karachi.Pakistan Oral and Dental Journal34:510–514.
Nourallah AW, Splieth CH, Schwahn C, Khurdaji M. 2005.Standardizing interarch tooth-size harmony in a Syrian population.Angle Orthodontist75:996–999
DOI 10.1043/0003-3219(2005)75[996:SITHIA]2.0.CO;2.
Oktay H, Ulukaya E. 2010.Intermaxillary tooth size discrepancies among different malocclusion groups.European Journal of Orthodontics32(3):307–312DOI 10.1093/ejo/cjp079.
Onyeaso CO. 2004.Prevalence of malocclusion among adolescents in Ibadan, Nigeria.
American Journal of Orthodontics and Dentofacial Orthopedics126(5):604–607 DOI 10.1016/j.ajodo.2003.07.012.
Othman SA, Harradine NWT. 2006.Tooth-size discrepancy and Bolton’s ratios: a literature review.Journal of Orthodontics33(1):45–51DOI 10.1179/146531205225021384.
Pancherz H, Zieber K, Hoyer B. 1997.Cephalometric characteristics of class II division 1 and class II division 2 malocclusions: a comparative study in children.Angle Orthodontist67:111–120 DOI 10.1043/0003-3219(1997)067<0111:CCOCID>2.3.CO;2.
Perillo L, Masucci C, Ferro F, Apicella D, Baccetti T. 2009.Prevalence of orthodontic treatment need in southern Italian schoolchildren.European Journal of Orthodontics32(1):49–53 DOI 10.1093/ejo/cjp050.
Riedel RA. 1952.The relation of maxillary structures to cranium in malocclusion and in normal occlusion.Angle Orthodontist22:142–145
DOI 10.1043/0003-3219(1952)022<0142:TROMST>2.0.CO;2.
Rothstein T, Yoon-Tarlie C. 2000.Dental and facial skeletal characteristics and growth of males and females with class II, division 1 malocclusion between the ages of 10 and 14 (revisited)—Part I: characteristics of size, form, and position.American Journal of Orthodontics and Dentofacial Orthopedics117(3):320–332DOI 10.1016/S0889-5406(00)70237-X.
Saleh FK. 1999.Prevalence of malocclusion in a sample of Lebanese schoolchildren: an epidemiological study.Eastern Mediterranean health journal5:337–343.
Sayın MO, Türkkahraman H. 2005.Cephalometric evaluation of nongrowing females with skeletal and dental Class II, division 1 malocclusion.Angle Orthodontist75:656–660 DOI 10.1043/0003-3219(2005)75[656:CEONFW]2.0.CO;2.
Seipel CM. 1946.Variation in tooth positon, A metric study of variation and adaptation in the deciduous and permanent dentitions.Svensk tandlakare tidskrift39:26–29.
Shamaa MS. 2019.Comparison between Class II Division 1 and 2 Malocclusions and normal occlusion regarding tooth size discrepancy and arch dimensions using digital models.
Egyptian Dental Journal65(2):899–908DOI 10.21608/edj.2015.71985.
Shyagali TR, Singh M, Joshi R, Gupta A, Kshirsagar P, Jha R. 2019.Prevalence of Angle’s malocclusion in sensory-deprived and normal school children of age group of 12–16 years in India: a study conducted in 2016–2018.Journal of Oral Health and Oral Epidemiology8:74–80.
Silva RG, Kang DS. 2001.Prevalence of malocclusion among Latino adolescents.American Journal of Orthodontics and Dentofacial Orthopedics119(3):313–315DOI 10.1067/mod.2001.110985.
Silva NN, Lacerda RHW, Silva AWC, Ramos TB. 2015.Assessment of upper airways
measurements in patients with mandibular skeletal class II malocclusion.Dental Press Journal of Orthodontics20(5):86–93DOI 10.1590/2177-6709.20.5.086-093.oar.
Singh VP, Sharma A. 2014.Epidemiology of malocclusion and assessment of orthodontic treatment need for nepalese children.International Scholarly Research Notices2014(2):1–4 DOI 10.1155/2014/768357.
Solow B. 1980.The dentoalveolar compensatory mechanism: background and clinical implications.British Journal of Orthodontics7(3):145–161DOI 10.1179/bjo.7.3.145.
Soni J, Shyagali TR, Bhayya DP, Shah R. 2015.Evaluation of pharyngeal space in different combinations of class II skeletal malocclusion.Acta Informatica Medica23(5):285–289 DOI 10.5455/aim.2015.23.285-289.
Sosa FA, Graber TM, Muller TP. 1982.Postpharyngeal lymphoid tissue in angle class I and Class II malocclusions.American Journal of Orthodontics81(4):299–309
DOI 10.1016/0002-9416(82)90216-0.
Tausche E, Luck O, Harzer W. 2004.Prevalence of malocclusions in the early mixed dentition and orthodontic treatment need.European Journal of Orthodontics26(3):237–244
DOI 10.1093/ejo/26.3.237.
Thilander B, Myrberg N. 1973.The prevalence of malocclusion in Swedish schoolchildren.
European Journal of Oral Sciences81(1):12–20DOI 10.1111/j.1600-0722.1973.tb01489.x.
Thilander B, Pena L, Infante C, Parada SS, De Mayorga C. 2001.Prevalence of malocclusion and orthodontic treatment need in children and adolescents in Bogota, Colombia: an
epidemiological study related to different stages of dental development.European Journal of Orthodontics23(2):153–168DOI 10.1093/ejo/23.2.153.
United Nations Population Division. 2019.International migrant stock 2019, graph: Twenty countries or areas of origin with the largest diaspora populations (millions).Available at https://www.un.org/en/development/desa/population/migration/data/estimates2/
estimatesgraphs.asp?3g3(accessed 27 September 2019).
Uslu-Akcam O. 2017.Pharyngeal airway dimensions in skeletal class II: a cephalometric growth study.Imaging Science in Dentistry47(1):1–9DOI 10.5624/isd.2017.47.1.1.
Uysal T, Sari Z, Basciftci FA, Memili B. 2005.Intermaxillary tooth size discrepancy and malocclusion: is there a relation?Angle Orthodontist75:208–213
DOI 10.1043/0003-3219(2005)075<0204:ITSDAM>2.0.CO;2.
Wędrychowska-Szulc B, Janiszewska-Olszowska J, Stepien P. 2010.Overall and anterior Bolton ratio in Class I, II, and III orthodontic patients.European Journal of Orthodontics32(3):313–318 DOI 10.1093/ejo/cjp114.