Direct effects of transcranial electric stimulation on brain circuits in rats and humans
Mihály Vöröslakos
1,2, Yuichi Takeuchi
1, Kitti Brinyiczki
3, Tamás Zombori
3, Azahara Oliva
1,2, Antonio Fernández-Ruiz
1,2, Gábor Kozák
1, Zsigmond Tamás Kincses
4, Béla Iványi
3,
György Buzsáki
2,5,6& Antal Berényi
1,2Transcranial electric stimulation is a non-invasive tool that can influence brain activity;
however, the parameters necessary to affect local circuits in vivo remain to be explored. Here, we report that in rodents and human cadaver brains, ~75% of scalp-applied currents are attenuated by soft tissue and skull. Using intracellular and extracellular recordings in rats, we fi nd that at least 1 mV/mm voltage gradient is necessary to affect neuronal spiking and subthreshold currents. We designed an ‘ intersectional short pulse ’ stimulation method to inject suf fi ciently high current intensities into the brain, while keeping the charge density and sensation on the scalp surface relatively low. We verify the regional speci fi city of this novel method in rodents; in humans, we demonstrate how it affects the amplitude of simulta- neously recorded EEG alpha waves. Our combined results establish that neuronal circuits are instantaneously affected by intensity currents that are higher than those used in conventional protocols.
DOI: 10.1038/s41467-018-02928-3
OPEN
1MTA-SZTE“Momentum”Oscillatory Neuronal Networks Research Group, Department of Physiology, University of Szeged, Szeged, 6720, Hungary.2The Neuroscience Institute, New York University, New York, NY 10016, USA.3Department of Pathology, University of Szeged, Szeged, 6725, Hungary.
4Department of Neurology, University of Szeged, Szeged, 6725, Hungary.5Department of Neurology, New York University, New York, NY 10016, USA.
6Center for Neural Science, New York University, New York, NY 10016, USA. Correspondence and requests for materials should be addressed to G.Bák. (email:gyorgy.buzsaki@nyumc.org) or to A.Bén. (email:drberenyi@gmail.com)
1234567890():,;
E lectric fields, generated either by neurons themselves or applied externally, can affect the transmembrane potential of neurons and, consequently, the probability of occurrence of action potentials1–3. Forced electric fields, induced either locally (e.g., by deep brain stimulation) or non-invasively through the scalp (e.g., by transcranial electrical stimulation; TES)
4–7, can probe neural patterns and potentially to ameliorate brain disease
8. Yet, there is no accepted theory to explain how TES affects neuronal circuits in the brain, mainly because the physiological mechanisms of TES are not well understood. Electrical stimula- tion of the scalp can affect brain activity in multiple indirect ways, including activation of peripheral nerves
7,9,10, retina
11, the ves- tibular apparatus, astrocytes, perivascular elements
12,13, and placebo effects
14. Given the important role of brain oscillations in cognition, an often-stated explicit goal of TES is to bias brain rhythms acutely or chronically
15,16, as opposed to inducing indirect peripheral effects.
For many therapeutic applications, it is desirable to affect neurons promptly (e.g., to terminate epileptic seizures), in a regionally constrained manner to reach maximum on-target effects and reduce effects on unintended brain networks
4,5. Achieving spatially precise effects by scalp-applied currents requires knowledge about the spread of electric fields in the human head
17and the use of novel methods of current delivered through multiple electrodes
18,19.
The effectiveness of currently used TES protocols on local neuronal networks is a subject of extensive debate
14–16,20,21. At least two factors contribute to this controversy. First, the large electric fields induced by alternating current TES (transcranial alternating current stimulation; tACS) often prevents simulta- neous measurement of electric (electroencephalographic, EEG), magnetic (magnetoencephalographic, MEG), or imaging (blood oxygen-level dependent, BOLD) signals
22. Recent experiments attempted to alleviate the amplifier saturation problem and remove the stimulus artifacts
21–23. However, in those experiments the expected brain rhythm entrainment was examined at the same frequency of the applied TES (e.g., 10 Hz tACS induced increased power in the alpha band), raising the possibility that large tACS artifacts which are several thousand-fold larger than the scalp signal, or a harmonic of the artifact, have contaminated the results. A second indirect approach takes the voltage gradients shown experimentally to produce spike entrainment and esti- mates the corresponding current intensity applied at the scalp surface. However, translation of results obtained from models
24, in vitro observations
21,22,25,26, and experiments performed on experimental animals
6,27to humans is complicated by an incomplete understanding of how skin, subcutaneous soft tissue, skull, cerebrospinal fluid, and brain folding affects current spread
28. While strong stimulation (>50 mA; 0.5 ms pulses) delivered through intracranial screw electrodes in anesthetized
Left
Left Right Left Right
Left
Anterior
Anterior
1.9 mm
0 0
10 20 2 30
1.9 mm
Skin
Skin Skull
Skull 4
3 2 1
Stimulus intensity (μA)
10 50 100 200 0
5 10 15 20 25
2 mm 2 mm
E (mV/mm)
0 2
E (mV/mm) Modulated area (mm2)
0 10 20 30
40 *
*
***
Modulated area (mm2)
Electric field (mV/mm) Normalized electric field (mV/mm/mA)
a b
c d e
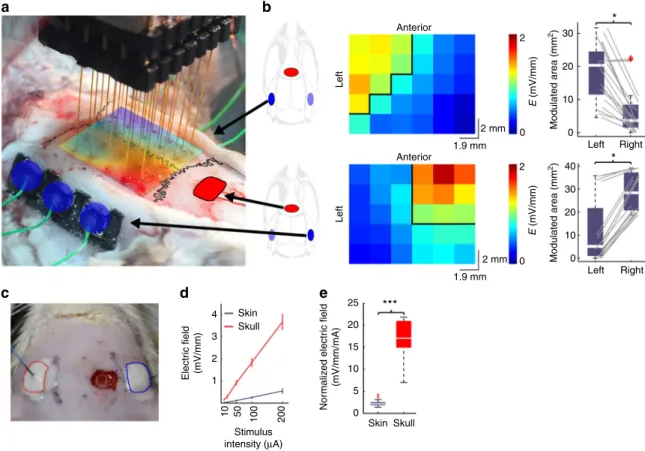
Fig. 1Intracerebral electricfield distribution and magnitude during subcutaneous or transcutaneous stimulation.aIntraoperative photograph of the measurement of intracerebral electricfields by a 6-by-5 electrode matrix in an anesthetized rat. Red: cathodal, blue: anodal gel electrodes glued onto the skull surface. The spline interpolated map of the measured intracerebral gradients shown inb(bottom) is superimposed on the skull surface.bMap of the measured intracerebral gradients in the horizontal plane. The boundary where the gradients are>1 mV/mm is marked by black lines (applied intensity:
100µA). Right, boxplots with whiskers indicate group results (full data set is superimposed in gray). Proper placement of the stimulating electrodes can restrict the extent of the effective electricfield gradients to either the left (upper plot) or the right (lower plot) hemisphere (P=0.04 and 0.02;n=20 in 4 rats each, Mann–WhitneyU-test).cPhotograph of scalp stimulation electrodes and the small hole in the skull through which intracellular recordings were made.d,eTranscutaneous stimulation at the same stimulus intensities generated several-fold weaker electricfields compared to subcutaneous stimulation (P<0.005,n=20 in 4 rats)
patients has shown convincing brain network-induced effects
29,30, the current intensity applied to the scalp needed to acutely affect neuronal patterns is yet to be established
5,31,32.
The goal of the experiments presented in this paper was to identify the conditions under which neuronal spikes and local circuits could be directly affected by TES. To accomplish this goal, we first determined the voltage gradients necessary to affect the membrane potential and neuronal spiking in the intact rat brain,
corresponding to approximately 1 mV/mm. Second, we intro- duced a novel fast pulse stimulation method that allowed simultaneous recording of electrical activity and focusing induced fields to target brain structures. We verified the validity of this method in rats and tested it in human subjects. Third, we mea- sured the impact of scalp, soft tissue, and skull on current spread and quantified the induced fields in the brain of human cadavers, and found that only approximately 25% of the scalp-applied
Skin Skull
***
***
***
***
*** *** ***
*** ** *
*
** ***
Skin
+800 μA –800 μA +800 μA –800 μA
2 s 2 s
20 mV 20 mV
–30
50
25
–25 0
–800
2.5
×10–3 ×10–3
2 1.5
Spectral power (V2) 1 0.5
2.5 2 1.5
Spectral power (V2) 1 0.5 Frequency (Hz)
5 10 15 20 25 30 35 40 45
Frequency (Hz)
5 10 15 20 25 30 35 40 45
–400 0 400 800
–800 –400 400
Stimuilus intensity (μA) 800 0
Skull Skin
Skull Skin
2.3 2.3
~12
Stimulus intensity (μA) and transcutaneous and subcutaneous electric fields (mV/mm)
~6 ~6 ~12
1.17 1.17
–15 0 15
Δ Membrane potential (mV)Δ Firing rate (Hz)
+800 μA –800 μA +800 μA
Control
+200 –200
+400 –400
+600 –600
+800 –800μA
–800 μA 2 s 2 s
50 mV 50 mV
Skull
*
*
a
b
c d
Fig. 2Modulating neuronal activity by subcutaneous or transcutaneous stimulation.aSubthreshold membrane potential changes of cortical neurons by transcutaneous and subcutaneous direct current stimuli.Vmwas held below spiking by intracellularly injected hyperpolarizing current. Five representative trials are shown for each arrangement. Right panel, group effects (n=40 trials from 8 neurons of 3 rats for transcutaneous andn=25 trials from 5 neurons of 4 rats for subcutaneous experiments). Note linear changes ofVmwith changing polarity and amplitude of forcedfields (R=0.86,P<0.005 for transcutaneous andR=0.97,P<0.005 for subcutaneous stimulation,n=13 trials, each; asterisks mark significant differences against control condition,n
=25/40 for subcutaneous/transcutaneous trials). For each stimulus intensity, the generated electricfield strengths are shown at the bottom of the plot in blue and red for transcutaneous and subcutaneous stimuli, respectively.bSame asabut for affected spiking frequency by appliedfields (R=0.80,P= 0.007 for transcutaneous andR=0.95,P<0.005 for subcutaneous stimulation,n=13, each; asterisks mark significant pairwise differences against control condition,n=25/35 for subcutaneous/transcutaneous trials).c,dChanges ofVmpower spectra in response to subcutaneous (c,n=30 trials) and transcutaneous (d,n=35 trials) stimuli. Note the lack of a significant effect with transcutaneous stimulation and prominent decrease of delta power (1–5.4 Hz) at +600 and +800µA conditions compared to control (arrow;P<0.005,n=30 power value pairs at each frequency bin from 6 animals;
Mann–WhitneyU-test with Bonferroni correction)
Model of focused TES
2.5
Stimulation
500 ms Ipsilateral
ISP
Stimulation
Stimulation
0.5 s 100 mV
0.5 s 100 mV
0.5 s 100 mV
5 7.5 10 12.5
∫ (Temporal summation)
15
Example putative pyramidal neuron from left hippocampus
Ipsi Contra
Ipsi Contra
Time (μs)
4 3 2 1 0
600 400
Trials
200
150 100 50
12 10
Fold change in firing rate
8 6 4 2 0 0
–20 –10 10 20 On Off
Pyramidal cell Interneuron No change
0.5 ms0.2 mV Time (ms)
***
Spikes
0 0
0 0.5 1.5 2 3
Time (s)
0 0.5 1.5 2 3
Time (s)
Firing rate (spikes/s)
Contralateral ISP
Ipsilateral ISP
Contralateral ISP 2.5 μs
2
1
3 3
4
2 3 4 5
1
3
5
a c
b
d
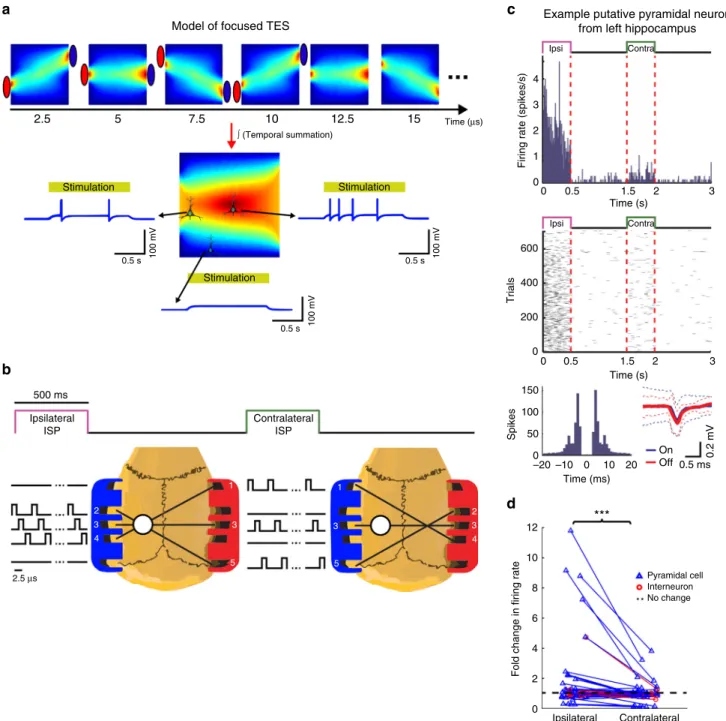
Fig. 3Intersectional Short Pulse (ISP) stimulation can spatially focus inducedfields.aLeaky integrate-and-fire neuron model cartoon to demonstrate the concept of ISP stimulation. Stimulus current is delivered sequentially through three independent electrode pairs generating a continuously changing intracerebral gradient pattern. Neuronal cell membranes can integrate these patterns due to their relatively slow membrane time constant (10 ms).
Consequently, neurons at the cross-section of the currentflow axes integrate all three stimuli, and become more strongly entrained than neurons located outside the focus.bExperimental protocol to measure the efficacy of ISP. White circle marks the craniotomy for the example left hippocampal neuron shown inc. The contralateral craniotomy is not displayed for simplicity. 3D-printed gel electrode holders (anode=left; cathode=right) were attached to the temporal bones bilaterally withfive electrodes on each side. Three electrode pairs were programmed to target the ISP beams on either the left or the right hemisphere (serving as ISPipsiand ISPcontraconditions for the example inc, respectively). Each electrode pair was pulsed for 2.5µs and the pulses cycled through the three pairs for 500 ms followed by non-stimulated 1-s control periods. This sequence was repeated to alternatingly stimulate the right or left hemisphere. The idealized beam crossings shown here may be modified by the inhomogeneity of brain structures and ventricles.cResponse of an example neuron. The putative pyramidal cell from the left hippocampus was strongly excited by the ipsilateral focal stimulation, as shown by peristimulus time histograms (top panels) and raster plots (middle panels). ISP stimulation did not affect isolation of single units as demonstrated by the similar autocorrelograms and identical spike waveforms during stimulation and control periods.dFold-changes of normalizedfiring rates of the significantly modulated cells from the left (n=32 units) and from the right hippocampus (n=23 units) show lateralized effect of the ISP stimulation (P=0.001;
ISPipsilateralvs. ISPcontralateralWilcoxon signed rank test)
current enters the brain. Finally, we determined the current levels of TES necessary to affect the amplitude of alpha waves in human subjects. Our direct measurements and indirect estimation pro- vided concordant results and established that in humans at least 4–6 mA currents should be applied by conventional tACS elec- trodes to reliably and instantaneously affect neuronal circuits.
Results
Subcutaneous and transcutaneous electric stimulation in rats.
Previous in vivo experiments in rodents were performed using stimulation electrodes placed on the skull
4,6(i.e., subcutaneous TES) and demonstrated both stimulus-locked firing of neurons in both neocortex and subcortical structures
6as well as effects on the amplitude of intracerebrally recorded local field potentials (LFP)
4. Because skin and head musculature surrounding the skull represent a large shunt which can diffuse the applied current, first we examined the current loss between scalp and the brain. Using implanted arrays of electrodes and stimulation pads placed on the parietal bone and pre-bregma frontal bone, we measured the intracerebral voltage gradients in the horizontal plane (Fig. 1a, b).
Subcutaneous TES at 50 µA alternating current was sufficient to induce ~1 mV/mm electric fields (Fig. 1b, d). The distribution of the electric fields could be biased by different configurations of bipolar stimulation (Fig. 1b, left-side stimulation: 20.33 (IQR = 11.49–24.52) and 3.65 (IQR = 1.58–8.39) mm
2exceeding 1 mV/
mm on the left and right hemisphere, respectively; P = 0.04; right- side stimulation: 5.16 (IQR = 1.01–21.76) and 28.37 (IQR = 20.72–31.18) mm
2exceeding 1 mV/mm on the left and right hemisphere, respectively; P = 0.02; Mann–Whitney U-test and n
= 20 × 2 in both cases). In contrast, applying the current to the shaved scalp (transcutaneous TES) through the same size elec- trodes resulted in an 80 ± 5% current loss, independent of the stimulus intensity (Fig. 1c–e; subcutaneous stimulation: 17.01 (IQR = 14.96–20.85) mV/mm/mA; transcutaneous stimulation:
2.14 (IQR = 1.9–2.44) mV/mm/mA; P < 0.001; paired t-test; n = 20 × 2).
In a more direct physiological comparison, we tested the effects of externally applied direct currents on the intracellularly recorded transmembrane potential (V
m) and spiking of neurons in the deep layers of the visual cortex (Fig. 2a–d). Subcutaneous (skull) stimulation exerted clear and predictable effects on V
m. Depending on the polarity of the stimulation, V
mbecame depolarized or hyperpolarized in a relatively linear manner (Fig.
2a; Pearson’s linear correlation, R = 0.86, P = 0.002 for transcu- taneous and R = 0.97, P < 0.001 for subcutaneous stimulation, n = 13, each), and decreased or increased the number of action potentials, respectively (Fig. 2b; Pearson’s linear correlation, R = 0.80, P = 0.007 for transcutaneous and R = 0.95, P < 0.001 for subcutaneous stimulation, n = 13, each). Subcutaneous depolariz- ing pulses significantly decreased V
m(paired t-test with Bonferroni correction; P <0.001, <0.001, <0.001 for 400, 600,
800 µA vs. 0 µA; n = 25 membrane potential difference values),
increased firing rate (paired t-test with Bonferroni correction; P = 0.001, <0.001, <0.001 for 200, 600, 800 µA vs. 0 µA; n = 25 firing rate difference values) and reduced V
mpower in delta frequency band (1–5 Hz; +600 to +800 µA, Mann–Whitney U-test with Bonferroni correction; P < 0.005, n = 30 power value pairs at each frequency bin), indicating that subcutaneous stimulation affected many other neurons as well (Fig. 2c). Hyperpolarizing pulses exerted opposite effect with similar magnitudes on V
m(paired t- test with Bonferroni correction; P = 0.003, 0.004 and 0.046 for
−800, −600, −400 µA vs. 0 µA; n = 25 membrane potential difference values) and reduced firing rate (paired t-test with Bonferroni correction; P = 0.044, 0.028 for −800 and −600 µA vs.
0 µA; n = 25 firing rate difference values). Using the same current
intensities, transcutaneous (scalp) stimulation produced much smaller and more variable effects (V
mwas affected at anodal 400–800 µA but not by cathodal pulses; paired t-test with Bonferroni correction; P = 0.044, 0.008, and 0.003 for 400, 600, and 800 µA vs. 0 µA; n = 40 membrane potential difference values, and even the highest current intensities failed to affect delta power V
mor higher frequencies; Fig. 2d; Mann–Whitney U-test with Bonferroni correction; P > 0.05; n = 35 × 150 spectral ampli- tude values for all conditions). Spiking activity by transcutane- nous stimulation was affected at only 800 µA depolarizing pulses (paired t-test with Bonferroni correction; P = 0.046 for 800 µA vs.
0 µA; n = 35 firing rate difference values), corresponding to intracranial fields of approximately 2 mV/mm (Fig. 2b, d). In summary, electric fields applied either subcutaneously or transcutaneously, which induce at least 1 mV/mm intracerebral voltage gradient, can affect spiking activity, but stronger fields are needed to affect network oscillations.
Focused TES effect by Intersectional Short Pulse stimulation.
For many experimental and clinical applications
5,22, it would be desirable to apply TES in a spatially targeted manner and simultaneously monitor the induced electrical changes to verify online effectiveness. Because the scalp, skull, and brain conduct current in a homogenous manner, simultaneous application of TES through multiple electrode pairs cannot induce a spatially confined effect (see Supplementary Figure 6b). Our proposed solution to achieve spatially targeted TES effects is to apply spatio-temporally rotating Intersectional Short Pulse (ISP) sti- mulation. This method exploits the short integration time con- stant of the neuronal membrane (5–20 ms), a mechanism that can temporally integrate multiple electrical gradients with similar vector directions (Fig. 3a, Supplementary Figure 1)
31. An added advantage of fast pulse stimulation (2.5 or 10 µs pulse width with 5 or 50 µs pause, depending on the number of electrode pairs) is that the transients of high frequency pulses affect simultaneously recorded LFP or neuronal spikes (1 Hz–5 kHz; 20 kHz sampling) substantially less than conventional tACS and they do not satu- rate recording amplifiers even at relatively high intensities.
To test our model prediction of focal effect in rats, current
pulses were delivered sequentially and in a spatially asymmetric
manner through independently programmable isolated current
generators, which were connected to a three-dimensional (3-D)
printed gel-electrode strip glued to the temporal bone surface
(Fig. 3b). Unit activity was recorded bilaterally in the hippo-
campal CA1 region with silicon probes (7 anesthetized rats and 1
chronically implanted rat). The hemisphere target of the bipolar
stimulation configuration was alternated (Fig. 3b, c; Supplemen-
tary Figure 2a). The effectiveness of the ISP stimulation on
spatially targeted entrainment of single unit activity is illustrated
for an example neuron from the left hippocampus (Fig. 2c). The
artifacts of the short duration stimulation pulses did not affect the
recording quality as demonstrated by the similar spike waveforms
and spike autocorrelograms of the unit during stimulation and
stimulation-free periods (Fig. 3c). Of the 127 isolated single units,
55 were significantly affected by at least one configuration of the
stimulation protocol (32 increased and 23 decreased, significance
threshold: P < 0.05; Wilcoxon signed rank test; n = 300 firing rate
values for each neuron and condition, all tested against baseline
condition). To quantify the focusing effect of ISP, we calculated
the fold-change of unit discharge in the left and right
hippocampus, respectively. Using only three rotating dipoles,
the current-focusing effect of ISP resulted in a several-fold
increase in induced unit discharge between the targeted and non-
targeted hemispheres (Fig. 3d, 1.8 ± 2.35-fold vs. 1.017 ± 0.63-
fold; mean ± SD; P = 0.001; Wilcoxon signed rank test; n = 55 units).
In four of the above animals (three anesthetized and one chronic; 77 units), the spatial selectivity of the ISP method was compared to traditional direct current (DC) pulses (for DC stimulation, the electrodes in the same hemisphere were short- circuited; the same current intensity was used for DC and ISP stimulation). For each protocol, 500 ms stimulation epochs
alternated with 1000 ms stimulus-free epochs using the following sequence: ISP
left, ISP
right, DC
left, DC
right. Eighteen (ISP) and 10 (DC) neurons showed significant firing rate changes to at least one stimulation configuration (significance threshold; P < 0.05;
Wilcoxon signed rank test; n = 340 firing rate values for each neuron and condition, tested against baseline). Of the 18 ISP- driven hippocampal neurons, eight (44%) responded differen- tially to ISP
leftand ISP
rightconditions (significance threshold: P <
a b
c
d e f g
0.9
0
0.9
0 0.9
0 0.6
0
0.6
0 0.6
0 0.4
0 0.4
0 0.4
0
Stimulus voltage (V) Stimulus frequency (Hz) TES electrode surface (cm2)
Electric field (mV/mm) Electric field (mV/mm) Electric field (mV/mm)
Voltage Frequency Stimulation area
3 5 6 6 5 3
3 5
5
5 6 6
6 6 6 6 5
7
7 7 7 7
7 6
6 5 6
6 6
6
5 3
3 Contact site
(mm)
1V 5 Hz 3 cm2
100 Hz 9 cm2
27 cm2 1000 Hz
3 V
6 V
2 1.5 1 0.5 0
1 2 3 4 5 6
2 1.5 1 0.5 0
10 100 1000 3 9 27
4
Case-1 Case-2
******
****** ***
***
3 2 1 0
Left Left Left
Posterior Posterior Posterior
E (mV/mm) E (mV/mm) E (mV/mm)E (mV/mm)E (mV/mm)
E (mV/mm)E (mV/mm)
E (mV/mm)E (mV/mm)
(mm)
90 75
75 60
60 45
45 30
30 15
15 0
0
7 7
3
0.05; paired t-test; n = 340 firing rate pairs for each neuron). Of the 10 DC-driven neurons, only one neuron (10%) showed significant difference to left (anode) vs. right (anode) stimulation (significance threshold: P < 0.05; paired t-test; n = 340 firing rate pairs for each neuron). In summary, the ISP stimulation affected neural activity in spatially targeted manner, even though skull thickness, brain geometry, tissue anisotropy, and ventricles likely distorted current spread.
Measuring current spread in human cadavers. Currently, the best estimates of the currents needed to induce electric fields of sufficient magnitude intracranially are offered by in silico mod- eling of the human head
5,33. However, there are many uncer- tainties in such modeling. As an alternative to modeling, we carried out high spatial density, 3-D intracerebral measurements in cadaver brains in situ (n = 11; Supplementary Tables 1 and 2).
Prior to each experiment, the subdural space was filled with physiological saline (0.9% NaCl) solution to replace the cere- brospinal fluid lost during the insertion of the recording elec- trodes. Thirty-six custom-made multisite electrodes (three to seven sites per electrode, 198 in total, Fig. 4a, Supplementary Figure 3) were inserted into the brain through holes drilled through the calvarium after removing the soft tissue around the skull (Fig. 4b, c) to create a 3-D montage. As the overall volume of the removed skull was negligible compared to the total skull volume, and the polyimide electrode shafts were tightly sealed, the conduction/isolation properties of the skull were not affected.
A needle electrode placed into the sagittal sulcus on the forehead served as the reference electrode. Four or seven pairs of Ag/AgCl stimulation electrodes were fixed to the skull surface bilaterally by conductive electrode gel (Fig. 4b, c). Using either DC pulses or alternating current stimulation (Supplementary Figure 4) showed
Fig. 4Measuring induced intracerebral electricfields in human cadavers.aPhotomicrograph of the custom-made multicontact electrodes used in the cadaver experiments.bPhotograph of the skull with drilled holes and inserted electrodes. A needle electrode in the sagittal plane on the forehead served as reference for the recordings. Ag/AgCl electrodes, marked by blue and red circles for negative and positive polarity, respectively, werefixed to the skull by conductive gel and secured by rubber-lined washersfixed to the plexiglass frame by threaded rods.cStereotaxic coordinates of the electrode shanks.
Numbers denote the number of recording sites for each electrode shank. Electrode tips (and adjacent sites) were positioned at the same depth to sample distinct horizontal planes. The depth coverage of our electrodes was 3–7 cm (depending on the number of contact sites).dThe effect of different stimulation electrode configurations on the distribution of voltage gradients displayed on a single horizontal slice. Position of the stimulating electrodes determines the location of maximal intracranial effect. Voltage gradients were calculated the same way as in Fig.1b.e–gEffect of stimulus intensity, frequency, and electrode size on intracerebral voltage gradients, respectively. Top three panels denote example gradient maps in the horizontal plane, bottom graphs show population data.eElectricfield strength is a linear function of applied stimulus intensity (R=0.52;P<0.001;n=48 gradient values in two different arrangements in 4 cadavers).fStimulus frequency between 5 and 1000 Hz has a minor effect on intracerebral gradients (one-way ANOVA;F (8, 891)=0.0667,P=0.99, mean±2 SD is shown,n=900 gradient values in 5 cadavers).gIncreasing electrode size increases the magnitude of electric fields in a constant voltage mode, as the aggregate resistance decreases (n=60 from 2 cadavers,P<0.001 for all conditions)
5 × 15 mm
3 Skin Skull 2.5
2 1.5
Current (mA) Electric field (mV/mm) Electric field (mV/mm)
Relative shunting effect
1 0.5 0
0 1 2 3
1.5 1
1 0.2 0.1 0
0 0.5 1 1.5 6
Stimulus intensity (mA) 0.5
0
2 *** 1
1.5 ***
Normalized electric field (mV/mm/mA) 1 0.5 0
0.5
0 0 4 7 57
Distance from skin surface (mm)
Stimulation electrode Skin
SkinSkull Skull Skull
Brain
Brain
0 1 2 3
4 5 6
Voltage (V) Stimulus intensity (mA)
6 × 10 mm
a b c d
e f
Electric field (mV/mm)
Shunting effect (%)
4 mm 6 mm 7 mm 5 mm
0.5
00 10 20 30 40
Distance from skull (mm) 1
100
50
0
Skin Skull Brain
g
Fig. 5Skin and subcutaneous soft tissue diffuses scalp-applied current in cadaver brains.aSchematic of the experimental arrangement for transcutaneous, subcutaneous, and epidural stimulation. Example signal traces recorded in a coronal plane. Note the phase reversal of sinusoid voltage traces between the two sides.bBoth transcutaneous and subcutaenous stimulation show intensity-independent linear (ohmic) properties (n=81 in four different arrangements in 10 cadavers,R=0.92,P<0.001 for subcutaneous, andn=14 in 6 cadavers,R=0.86,P<0.001 for transcutaneous stimulation; raw data andfitted line are shown), which allows the calculation of voltage–current relationship.c,dSubcutaneous stimulation (c,R=0.56,P<0.001,n=29 in 10 cadavers) elicited several-fold larger intracerebral gradients compared to transcutaneous stimulation (d,R=0.8,P<0.001,n=16 in 6 cadavers).
Extrapolation from the measured data indicates that approximately 6 mA transcutaneous current can induce 1 mV/mm intracerebral electricfield (circle).
Raw data andfitted lines are shown.eRatios of induced intracerebralfields and stimulus amplitude in trancutaneous vs. subcutaneous (P<0.001,n=36 in two different arrangements in 6 cadavers), and subcutaneous vs. epidural stimulation (P<0.001,n=60 in 3 cadavers).f58±7% of the applied current is shunted by skin and soft tissue and a further 16±8% is attenuated by the serial resistance of the skull.gEffect of skull thickness on inducedfields (n=64 in 8 cadavers)
that, similar to the rat, the highest electric fields occurred in the neocortex near the stimulation electrodes (Fig. 4d; Supplementary Figure 5). The generated gradient patterns were independent of whether voltage or current mode was used for stimulation (Supplementary Figure 6a), and the relationship between applied current or voltage and the measured electric fields was linear (Fig. 4e; Pearson’s linear correlation; R = 0.52; P < 0.001; n = 48).
The frequency of stimulation had only a small effect on the magnitude of the induced fields (Fig. 4f; one-way ANOVA; P = 0.99; F(8, 891) = 0.06; n = 900 trials from 5 cadavers). These results demonstrate ohmic properties of the brain
34, the sur- rounding skull, and soft tissue with negligible capacitive com- ponents
35. When multiple electrodes were simultaneously stimulated, the common conductive soft tissue summed the independently applied dipoles, as shown by an equivalent circuit diagram (Supplementary Figure 6b). As a result, simultaneously applied multiple stimuli at different locations but with an increasing phase separation gradually decreased the magnitude of electric fields (Supplementary Figure 6c). As expected, larger size electrodes induced larger electric fields (Fig. 4g, case 1: 0.94 ± 0.041, 1.25 ± 0.05, 2.84 ± 0.097 mV/mm, P < 0.001 for all com- parison; and case 2: 0.23 ± 0.01, 0.32 ± 0.017, 0.43 ± 0.09 mV/
mm, P < 0.001 for all comparison; mean ± SEM; n = 60 gradient
values)
36. Unilateral placement of the electrodes restricted the induced electric fields largely to the selected hemisphere (Fig. 4d;
Supplementary Figure 7; E
targeted= 0.9 ± 0.06 mV/mm and E
non- targeted= 0.49 ± 0.03 mV/mm, mean ± SD; n = 30 cortical electric field values), similar to the results obtained in rats (Fig. 1b).
Figure 5 presents comparisons between transcutaneous (scalp), subcutaneous (skull with scalp removed), and direct epidural stimulation results (Supplementary Table 3). Transcutaneous experiments used a limited set of recording electrodes to one plane of the 3-D matrix (total of 28 contact sites on four electrodes in 6 cadavers) introduced via small individual incisions of the otherwise intact scalp. The voltage–current relationship remained linear for transcutaneous stimulation as well but the slopes were strongly reduced (Fig. 5b; Pearson’s linear correlation;
R
subcutaneous= 0.92 and R
transcutaneous= 0.86; P < 0.001 in both cases; n = 14 and 81 for transcutaneous and subcutaneous conditions, respectively). Comparison of the current–electric field relationships indicated that approximately 2 mA subcutaneously applied current was sufficient to induce a 1-mV/mm field maximum (Fig. 5c; Pearson’s linear correlation; R = 0.56; P <
0.001; n = 29). In contrast, the current vs. electric field slope was decreased three-fold when current was applied to the scalp rather than to the skull (Fig. 5c, d; E
subcutaneous(mV/mm) = 0.41 × I(mA)
Left hemisphere
3435363738
Trials
Right hemisphere P3 P4
Left 0 0 1.5 3 4.5 6 7.5
–180 180
***
***
***
***
TES phase (°)
TES intensity (mA)
–90 0 90 –180 180
TES phase (°)
Alpha amplitude (μV) Alpha amplitude change (%) –90 0 90
0 300
350
250 250
200
150 150
100 100
50 50
350
Left Right
1 s 250 μV / 7.5 mA
* ***
+
+
+ +
***
** ****** *******
250 150 100 50 0 1.5 4.5 7.5 TES intensity (mA)
6
3 0 1.5 4.5 7.5
TES intensity (mA) 6 3 1.5
3 4.5 6 7.5 0– –
Right +
+
a
b c
Fig. 6ISP stimulation of the scalp phasically modulates ongoing brain oscillations in human subjects.aFive consecutive example trials demonstrating alpha amplitude increase for high-intensity ISP stimulation. Alpha-bandfiltered EEG signals are color coded based on the instantaneous ISP phase for better visibility; blue and red colors denote stimulus trough (right-to-left currents) and peak (left-to-right currents), respectively. Gray sinusoids denote the ISP stimulus epoch with an increasing–decreasing amplitude.bPhase modulation of the alpha amplitude by ISP stimulation for the entire session from the same subject as shown ina, showing intensity-dependent alpha amplitude increase (mean across phases are tested inn=45 trials against 0 mA condition, P<0.001 for 6 and 7.5 mA). Note the alternating phase modulation of the left and right hemisphere-derived EEG signals at 6 and 7.5 mA intensities. Color maps show the phase-dependent median alpha amplitudes.cPopulation analysis for the left and right hemispheres, respectively, revealed an intensity- dependent effect. Alpha amplitudes at stimulus peaks and troughs were generally unchanged for stimulus intensities below 4.5 mA. In response to anodal currents in the same hemisphere, phasic modulation was significant at 4.5, 6, and 7.5 mA. In response to cathodal stimulation in the contralateral hemisphere, significant effects were observed only at 7.5 mA (right hemisphere) or 6 and 7.5 mA (left hemisphere)
+ 0.15; E
transcutaneous(mV/mm) = 0.13 × I(mA) + 0.04). Extrapola- tion of transcutaneous stimulation results suggested that approximately 6 mA current applied to the scalp would be needed to reach 1 mV/mm voltage gradient in the living brain (Fig. 5d; Pearson’s linear correlation; R = 0.80; P < 0.001; n = 16).
Across all experiments in which scalp, skull, and epidural stimulations were tested (n = 6), we could establish that 58 ± 7%
of the current applied through the scalp diffused through the soft tissue surrounding the head. Another 16 ± 8% of the current was attenuated by the resistance of the skull, whereas current spread effectively in the brain, including the meninges, vasculature, ventricles, gray matter, and white matter (Fig. 5e, f; 0.12 (IQR = 0.07–0.19) and 0.62 (IQR = 0.44–0.79) mV/mm/mA for transcu- taneous vs. subcutaneous comparison; 0.61 (IQR = 0.49–0.80) and 0.93 (IQR = 0.67–1.23) mV/mm/mA for subcutaneous vs.
epidural comparison; paired t-test; P < 0.001 in both compar- isons; n = 36 and 60 for the two comparisons, respectively), supporting the view that the brain is an effective volume conductor
3. Skull thickness was a potential factor in attenuation of the current spread, explaining some of the variability across subjects (Fig. 5g; Supplementary Figure 8; Pearson’s linear correlation; P = 0.008; R
2adjusted= 0.046; n = 128 electric field strength and skull thickness value pairs).
The experiments on the cadaver brains were performed from 3 to 8 days after death (Supplementary Table 1). Water density measurements of brain specimens revealed that the postmortem age had little effect on the hydration level of the brain (Supplementary Figure 9a). However, previous papers reported that the resistivity is increased in the postmortem skull and soft tissues
37,38. To mimic the effects of postmortem changes on our
P3
P3 lead - control
100 μV
5 s ISP stimulation P3 lead - stimulated
100 μV
100 ms
a
2 z-scored wavelet power
–0.2 12 TES
Control - pre
120 * *
* *
* *
100
80
60
0 90 180 270 360
10
8
0 180 360 540 720
TES phase (deg) TES phase (deg)
0.2 0
*** **
1.5
Mean resultant length of alpha band MI (z-score)
Frequency (Hz)
Mean alpha amplitude (μV)
1
0.5
0
0pre 0post
TES intensity (mA) 2 4.5 7 9 2 mA
4.5 mA 7 mA 9 mA Control - post
d e f
40
Control 2 mA 4.5 mA 7 mA 9 mA 30
20
10
Spectral amplitude (μV)Normalized spectral amplitude (%)
0
200
150
100
50
0
5 10 15 20 120 140
Frequency (Hz)
120–140 Hz
*** ***
8–12 Hz
0 2 4.5 7 9
TES intensity (mA)
b
c
Alpha band spectral amplitude (μV) 250
2nd half of sessions 1st half of sessions 200
150 100 50 0
0 1.5 3 4.5 6 7.5
TES intensity (mA)
g
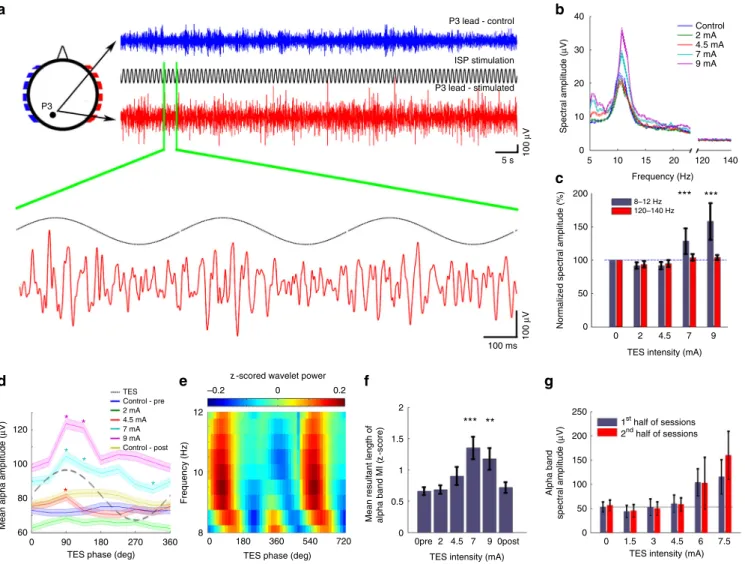
Fig. 7High intensity ISP stimulation of the scalp phasically modulates ongoing alpha waves in human subjects.aBlue, control EEG trace; red, EEG trace during 7 mA stimulation (eyes closed in each condition). A 3-s magnified segment of EEG trace at P3 lead is also shown. Note the absence of signal saturation. The 1 Hz modulation of the baseline was removed.bSingle session example of power spectra of EEG traces during increasing ISP intensities at 1 Hz. Power spectra were calculated in 10-s long windows, then averaged.cQuantification of ISP stimulation-induced increase in alpha band power in a single session. The control frequency band (120–140 Hz) showed no significant change (n=405–408 stimulus cycles;Palphaband=0.37, 0.42,<0.001,
<0.001;Pcontrol=1.38, 1.38, 0.31, 0.62 for 2, 4.5, 7, 9 mA; all vs. 0 mA).dSingle session example of alpha wave amplitudes as a function of the phase of 1 Hz ISP sinusoid stimulation. Asterisks denote phase bins significantly different from the mean (one-way ANOVA;P<0.05 atF(7, 3140)=3.033 for 4.5 mA,F(7, 3136)=6.96 for 7 mA, andF(7, 3160)=14.37 for 9 mA; asterisks show significant (P<0.05) phase-intensity combinations of the post-hoct- tests against the phase bins of the control condition.eSingle session example wavelet map (9 mA, 1 Hz ISP) shows ISP phase modulation of the alpha band power.fAlpha band power modulation of wavelet decomposed EEG by 1 Hz ISP stimulation phase (n=16, 10, 8, 18, 10, and 12 sessions;P=0.98, 0.041,
<0.001, 0.019, and 0.17 for‘0pre’, 2, 4.5, 7, 9, and‘0post’intensities in 3 subjects; two-sample Kolmogorov–Smirnov test).gISP stimulation-induced increase of alpha power was stable throughout the recording epochs, as shown by the similar values during thefirst and second halves of the stimulation sessions (n=23 trials from a single subject,P=0.96, 0.79, 0.44, 0.44, 0.74, and 0.11 for 0, 1.5, 3, 4.5, 6, and 7.5 mA intensities, respectively)
cadaver experiments, we simulated the effects of changing the resistance of the soft tissue and examined the role of shunted current by soft tissue (parallel resistance) and the current entering through the skull (serial resistance). Our simulations showed that the lower resistances of the live soft tissues shunt the scalp- applied currents even more than in the cadavers (Supplementary Figure 9b, c).
Overall, our measurements in human cadavers demonstrate that a significant fraction of the scalp-applied current is lost due to the shunting effects of the skin and soft tissue and the serial resistance of the skull. Approximately three quarters of the current was attenuated across the scalp and skull. These findings were further supported by measuring the induced voltage fields first in vivo, followed by identical measurements up to 5 postmortem days in chronically implanted rats (n = 3; Supple- mentary Figure 9d).
Affecting human brain network activity by ISP. Our human cadaver and in vivo rat measurements indicated that approxi- mately 6 mA currents applied to the scalp are needed in humans to effectively alter brain networks. To test this prediction, a
circular array of 12 stimulation electrodes (six on each side;
Fig. 5a) was placed around the head and an ISP protocol was applied in 19 healthy human subjects. Each stimulation site consisted of a 0.9% NaCl solution-soaked sponge square con- nected to 2 × 3 cm copper mesh. Scalp EEG was monitored by a 2-site montage (P3 and P4 against reference Pz). In each session, 1-min long control recordings were obtained before and after the stimulation session (12 min). To avoid onset and offset effects, ISP stimulation consisted of a train of 1-Hz sinusoids with increasing and decreasing intensity (0, 1.5, 3, 4.5, 6, 7.5, 6, 4.5, 3, 1.5, 0 mA per cycle; Fig. 6a, b; Supplementary Figure 2b) for 12 s, repeated 60 times for each subject. The low frequency (1 Hz) stimulation allowed us to investigate the anodal–cathodal phase modulation of the amplitude of the spontaneous EEG (repre- sented mainly by the dominant alpha band activity) simulta- neously in the left and right hemispheres. This approach exploits the observation that TES can coherently affect the membrane potential (V
m) of many similarly oriented neurons (Fig. 2) and the one order of magnitude lower stimulation frequency com- pared to the oscillation being observed reduces the possibility that stimulation artifacts and their harmonics contaminate the
Eyes open
Control Control Control Control Control Control
Eyes closed
1 min
P4 P3
1 min 1 min 1 min 1 min 1 min
ISP
5 min 5 min 5 min
Shuffled ISP
Abdominal ISP
5 min 5 min
2 mA 6 mA 2 mA 6 mA 6 mA
P3 P4
a
Left hemisphere (P3)
Left hemisphere (P3) 600
400 200 Spectral power (μV2)
0 5 10 15 20 25 30 35 40 45
Frequency (Hz)
600 400 200 Spectral power (μV2)
0
5 10 15 20 25 30 35 40 45
Frequency (Hz) Right hemisphere (P4)
Right hemisphere (P4) L–R current
R–L current
*** *** *** *** ***
15
10
5
Δ Power (%) –5 Δ Power (%)
–10
–15
–202 mA ISP
6 mA ISP
6 mA shuf
6 mA abdom 2 mA
shuf
2 mA ISP
6 mA ISP
6 mA shuf
6 mA abdom 2 mA
shuf 0
b c
Fig. 8Comparison of ISP and shuffled ISP stimulation on the EEG of human subjects.aTesting sequence of the experimental protocol. ISP stimulation used the same arrangement as in Fig.5. During shuffled ISP, adjacent stimulation electrodes were stimulated with opposite polarity. While shuffled ISP increases local currentflow in the scalp, the alternating directions of the induced electricfields at the focus area are expected to cancel, ideally resulting in a zero current in the brain.bGroup results shown separately for the left and right hemispheres. Six mA current ISP stimulation increased alpha power in both hemispheres. Shuffled ISP exerted only a unilateral and weaker effect. Intensities at 2 mA were ineffective. Abdominal stimulation (6 mA ISP protocol) did not exert a significant effect on alpha power (n=809 epochs; power difference values for each conditions from 6 subjects, one-samplet-test with Bonferroni correction).cSpectral power comparison between eyes open control and eyes closed control periods. Horizontal lines indicate significant changes from the eyes open condition (P<0.05;n=125 epochs for the eyes open, 144, 117, 126, 127, 148 epochs for the consecutive eyes closed, and 211 epochs for the abdominal ISP conditions; Mann–WhitneyU-test with Bonferroni correction). Color coding of the conditions is the same as ina