Qualitative discrimination of coal aerosols by using the statistical evaluation of laser-induced breakdown spectroscopy data
D.J. Palásti1,2, A. Metzinger1, T. Ajtai3, Z. Bozóki3,4, B. Hopp2,3, É. Kovács-Széles5, G. Galbács1,2*
1Dept. of Inorganic and Analytical Chemistry, University of Szeged, Dóm sq. 7, 6720 Szeged, Hungary
2Dept. of Materials Science, Interdisciplinary Excellence Centre, University of Szeged, 6720 Szeged, Dugonics sq. 13, Hungary
3Dept. of Optics and Quantum Electronics, University of Szeged, Dóm sq. 9, 6720 Szeged, Hungary
4MTA-SZTE Research Group on Photoacoustic Spectroscopy, Dóm sq. 9, 6720 Szeged, Hungary
5MTA Centre for Energy Research, Konkoly-Thege M. str. 29-33, 1121 Budapest, Hungary
*Corresponding author. E-mail: galbx@chem.u-szeged.hu 3
4 5 6 7 8 9 10 11 12 13 14 15 16 17 18 19 20 21 22 23 24 25 26 27 28 29 30 31 32 33 34 35 36 37 38 39 40 41 42 43 44 45 46 47 48 49 50 51 52 53 54 55 56 57
Abstract: The present work demonstrates the capabilities of laser-induced breakdown spectroscopy (LIBS) in the qualitative analysis of carbonaceous aerosols. The model aerosols studied were generated by laser ablation in a nitrogen flow from five commercial coal samples (lignite, anthracite, Pécs-vasas brown coal, Polish brown coal, Czech brown coal) and contained sub-micron particles in a concentration exceeding 106 cm-3. Features of the LIBS spectra of these aerosol samples were characterized and it is showed that the particle detection frequency (expressed as the number of particle hits referenced to the total number of laser shots delivered) correlates with the mass concentration of the aerosol. The detection limit for coal aerosols was also estimated and found to be about 600 pgmm-3, meaning that for detectability with the present experimental system, either the diameter of individual particles should be over 2.3 m or their number concentration has to be large enough to exceed the above mass concentration detection limit.
The possibilities for coal classification based on the statistical evaluation of the LIBS spectra of their aerosols was also investigated in detail in the laboratory. Simple comparative functions (overlapping integrals, sum of squared deviations, linear correlation) were found not to be efficient in the discrimination, even when facilitated by spectral masking, but multivariate methods (classification tree, linear and quadratic discrimination analysis) gave significantly better results. The effect of data normalization and data compression (by the multivariate curve resolution alternating least squares methodology) prior to modeling was also tested and it was found that their influence on the classification accuracy is not always positive, if any. The best performance was showed by the classification tree method (without data compression), which had a good overall accuracy of 87.2%. The validation of the model was assessed by calculating the repeatability of the classification accuracy from 15 repetitions using randomly selected subsets of the spectra. This calculation gave a repeatability value of 2.2%, which shows that the model is quite robust.
Keywords: aerosols; coal; laser ablation; LIBS; multivariate statistics 62
63 64 65 66 67 68 69 70 71 72 73 74 75 76 77 78 79 80 81 82 83 84 85 86 87 88 89 90 91 92 93 94 95 96 97 98 99 100 101 102 103 104 105 106 107 108 109 110 111 112 113 114 115
3 1. INTRODUCTION
Carbonaceous particulate matter (CPM) is one of the most important member of anthropogenic aerosols, and hence it is the topic of a gradually increasing scientific interest in environmental science. On the global scale, CPM is targeted because it is a major contributor to global warming due to its strong light absorption, while on the local scale it is an air pollutant with multiple adverse health effects. From both aspects, the identification and source apportionment of CPM in ambient aerosols is of essential importance [1-4].
Earlier studies have already demonstrated that residential domestic coal burning alone accounts for nearly half of the total CPM emission from fossil fuel combustion [5]. In spite of its significant contribution to both the global radiative budget and also to the quality of air, available data on its quantity and its emission characteristics is limited, partly because of the negligible contribution of this type of fuels to the emission inventory of developed countries [5].
Moreover, related studies often only focus on mass emissions and rarely address the topic of selective source identification.
In fact, there is generally no widely accepted methodology for the selective and real-time apportionment of CPM. Conventional approaches are off-line and are based on the collection of aerosol followed by wet chemical or thermochemical analysis [6-8]. The off-line nature, the moderate selectivity and integration time strongly limits the applicability of these approaches.
The recently appeared alternatives applicable to the real-time (in-situ) identification of ambient CPM, such as aerosol mass spectrometry (AMS) [9], multi-wavelength photo-acoustic spectroscopy (PAS) [10, 11] and laser-induced breakdown spectroscopy (LIBS) [12, 13] open up new perspectives in this field. Considering the price and bulkiness of AMS instrumentation as well as the indirect data provided by PAS, LIBS is the most promising out of the mentioned three methodologies.
LIBS is a sensitive, robust and fast laser atomic emission spectroscopy method, which is based on the generation of an analytical microplasma on the surface of solid samples by using a focused, high power laser beam. Portable and stand-off LIBS instrumentation is also available commercially, thus this technique is very suitable for field measurements in many scenarios including industrial, environmental or safety-related analytical tasks [14, 15]. Industrial applications also include coal and fly ash analysis [16-18], as well as aerosol analysis in general.
In the latter area, it was shown that LIBS can be employed both in on-line (in situ, on an aerosol beam) or off-line (e.g. following aerosol collection on a filter) modes. Comprehensive reviews on the status of research on LIBS aerosol analysis were published by Hahn et al. [15, 19, 20].
In recent years, some studies also successfully demonstrated the use of LIBS for the analysis of coal particles. These studies focused either on the detection of particles or on the quantitative analysis of some components, typically carbon, in the particles. For example, Stipe 121
122 123 124 125 126 127 128 129 130 131 132 133 134 135 136 137 138 139 140 141 142 143 144 145 146 147 148 149 150 151 152 153 154 155 156 157 158 159 160 161 162 163 164 165 166 167 168 169 170 171 172 173 174 175
et al. quantified quartz in coal dust samples collected on filter media [21], in the off-line mode.
The carbon content of coal aerosol and pulverized coal particles were successfully determined in the on-line mode in several studies [13, 18, 22, 23]. Yao et al. designed an advanced, particle flow focusing device for the efficient detection of coal particles [24]. Mukherjee and Cheng investigated how different mass loadings in the plasma induce matrix effects during the quantitative analysis of carbonaceous aerosols [12]. At the same time, no studies have addressed the on-line, qualitative discrimination of coal aerosols according to their source coal type so far, although the potential of LIBS for the classification/identification of samples has already been successfully demonstrated on various samples, for example in microbiological [25-27], medical [28, 29], industrial [16, 30, 31] or forensic [32-34] applications.
In the present study, we assessed the performance of LIBS combined with data evaluation using multivariate statistics for the discrimination of different types of coal aerosols in the laboratory. This is the first study in the literature, according to the best knowledge of the authors, which attempts to use LIBS for the source coal type determination based on an on-line coal aerosol analysis. Our model aerosols were generated from residential coal samples using our recently introduced laser ablation methodology [35, 36] in nitrogen gas, in order to control the properties of the aerosol particles and to reasonably mimic exhaust flue gases from air- based coal combustion.
2. EXPERIMENTALS
2.1. Coal samples and aerosol generation
The set of samples used to generate coal aerosol consisted of five coals, including low-rank and high-rank coals as well. The coal samples were obtained from commercial sources in Hungary.
These were identified as follows: lignite (LI), anthracite (AN), Pécs-vasas brown coal (PV), Polish brown coal (PB), Czech brown coal (CB). Disk shaped target materials, with a diameter of 25 mm and a thickness of about 10 mm, were fabricated from the irregularly shaped original coal pieces.
Aerosol samples were generated by using laser ablation. The experimental arrangement and the formation mechanism of coal particles by laser ablation are described in details e.g. in our former publications [35, 36]. The samples (targets) were implemented onto a rotating sample holder in this ablation chamber and the focused laser beam of a KrF excimer laser was directed onto the sample surface. The laser fluence, repetition rate (2.5 J/cm2 and 10 Hz, respectively) as well as the sample rotation speed were fixed to provide a stable particle number concentration of about 5106 cm-3 for each sample. The generated aerosol plume was dispersed in a high purity nitrogen gas (99.995% purity, Messer Hungarogáz Ltd.). Nitrogen gas was 180
181 182 183 184 185 186 187 188 189 190 191 192 193 194 195 196 197 198 199 200 201 202 203 204 205 206 207 208 209 210 211 212 213 214 215 216 217 218 219 220 221 222 223 224 225 226 227 228 229 230 231 232 233
5 chosen in order to control the ablation environment and therefore the properties of the produced aerosol particles and partially also to reasonably mimic exhaust flue gases from air- based coal combustion which is mainly composed of nitrogen. The flow rate of the gas was controlled by a mass flow controller (MFC, Tylan 2900FC) and set at a value of 0.5 liter per minute. The coal aerosol stream was directed into a specially designed LIBS ablation chamber described in the next section.
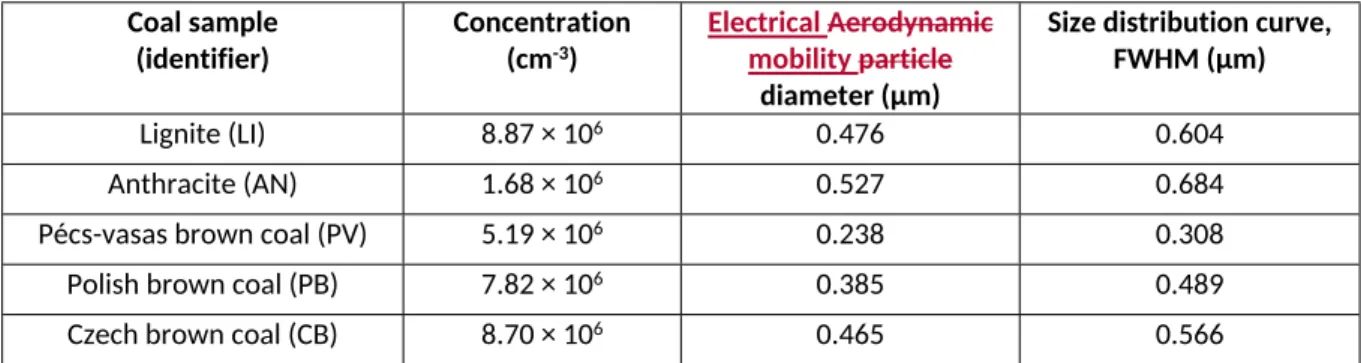
Aerosols leaving the generation chamber were characterized by a scanning mobility particle sizer (SMPS), consisting of a Vienna-type differential mobility analyzer and a condensation particle counter (Grimm Aerosol Technik GmbH & Co.). Relevant properties of the generated coal aerosols can be seen in Table 1.
Coal sample (identifier)
Concentration (cm-3)
Electrical Aerodynamic mobility particle
diameter (µm)
Size distribution curve, FWHM (µm)
Lignite (LI) 8.87 × 10⁶ 0.476 0.604
Anthracite (AN) 1.68 × 10⁶ 0.527 0.684
Pécs-vasas brown coal (PV) 5.19 × 10⁶ 0.238 0.308
Polish brown coal (PB) 7.82 × 10⁶ 0.385 0.489
Czech brown coal (CB) 8.70 × 10⁶ 0.465 0.566
Table 1. Characteristics of the coal aerosols generated by laser ablation for the purposes of the study.
2.2. LIBS instrumentation
The experiments were carried out in a flow-through, small volume measurement chamber constructed in-house for LIBS aerosol measurements. The aerosol flow from the generation chamber was directed through this second chamber and a Nd:YAG laser beam was focused into the chamber from above through a UV-grade fused silica laser window for LIB plasma generation inside the particle beam. The repetition rate of the plasma generating laser was set to a low value (ca. 0.3 Hz) thereby ensuring that the content of the chamber is completely renewed by the gas flow between laser shots. The Nd:YAG laser was operated in the single-pulse mode, emitting 50 mJ pulses of 4 ns duration at the 1064 nm fundamental wavelength (LIBScan 25+, Applied Photonics, UK). The fractional residual part of the laser beam was coupled out from the chamber through a laser mirror and a second window and led into a beam dump, in order to eliminate laser beam reflections inside the measurement chamber. The LIBS plasma was observed via two fused silica collimating lenses (COL-UV/VIS, Avantes, NL) implemented in two ports located on the sides of the chamber (looking onto the same spot in the chamber in the 239
240 241 242 243 244 245 246 247 248 249 250 251 252 253 254 255 256 257 258 259 260 261 262 263 264 265 266 267 268 269 270 271 272 273 274 275 276 277 278 279 280 281 282 283 284 285 286 287 288 289 290 291 292 293
horizontal direction, with 90 angle between the optical axes of the two lenses). The collected light was coupled into a two-channel fiber-optic CCD spectrometer (AvaSpec-FT2048, Avantes, NL) using solarization-resistant, 200 µm diameter, 0.22 NA optical fibers (FCB-UV200-2-SR, Avantes, NL). The measurement chamber was mounted on a translation stage (LT-1, Thorlabs Inc., USA), which allowed bringing the laser focal spot inside the chamber in front of the light collection lenses.
Gating of the spectral data collection was achieved by the internal electronics of the spectrometer, which was triggered by the laser power supply unit and continuously monitored on a digital storage oscilloscope (TDS1002, Tektronix, USA). The minimum possible gate delay of 1 s and gate width of 2 ms was set at the spectrometer. The double-channel spectrometer allowed the recording of the plasma emission in the 198-318 nm and 344-888 nm spectral ranges, with resolutions of 0.09 nm and 0.4 nm, respectively.
2.3. Data evaluation
Spectral line assignation in LIBS spectra was done using the NIST Atomic Spectra Database.
Spectrum normalization, by using the total integrated spectral intensity as reference value, was also used during the data evaluation. Multivariate statistical data evaluation was performed in the open source R Studio program environment, using the following software packages: MASS, ALS, Chemometrics and RPART. Additional statistical evaluation and data plots were done in Origin Pro 8.6 (OriginLab, USA). Calculations using comparative statistical functions were executed in MS Office Excel 2010 (Microsoft, USA), by using Visual Basic for Applications macros.
The statistical functions and methods used in the present work are known in the literature and we also described them in detail in our earlier qualitative discrimination studies performed on other sample types (e.g. [16, 31, 34]), so here we only briefly outline their concept.
Three common comparative functions, namely linear correlation (LC), sum of squared deviations (SSD) and overlapping integral (OI) were used in the simpler statistical calculations.
In our implementation, we normalize these functions to the range of 0 to 1. This range defines a degree of similarity (Q), where a value of 1 means “full similarity” and Q= 0 indicates “full dissimilarity” of the compared spectra [16, 31, 34].
Multivariate curve resolution - alternating least squares (MCR-ALS) decomposes a 2D dataset into the linear combination of component datasets [37, 38]. Generally, the process can be described by the equation D= CST + E, where D is the spectrum of the (composite) sample, E is the error matrix, and ST and C are the column and row vectors of the reference spectra and concentrations of the pure components, respectively. In the present application, MCR-ALS decomposition was not used as a standalone evaluation method, but served as a "data 298
299 300 301 302 303 304 305 306 307 308 309 310 311 312 313 314 315 316 317 318 319 320 321 322 323 324 325 326 327 328 329 330 331 332 333 334 335 336 337 338 339 340 341 342 343 344 345 346 347 348 349 350 351
7 compression" step, which generated a set of virtual components (ST and C), constituting a significantly smaller data matrix than the original set of sample spectra.
Classification tree (CLT) is a method that produces a list of conditions, based on which the features of a dataset (sample spectra) can be classified, or grouped. In the case of spectral datasets, these conditions refer to the intensity and positional relations of peaks in the spectra.
The series of these conditions make up the evaluational construct, which can be best represented as a tree structure [39, 40].
Discriminant analysis (DA) finds a set of prediction equations based on independent variables that are used to classify individuals into groups [41]. The methodology used to complete a discriminant analysis is similar to regression analysis. Discrimination is achieved by setting the variate’s weight for each variable to maximize the between-the-groups variance relative to the within-the-group variance. DA is most often used either in a linear or quadratic from. The so called linear DA (LDA) assumes that the observations within each groups are drawn from a multivariate Gaussian distribution and the covariance of the predictor variables are common across all levels of the response variable. Quadratic DA (QDA) also assumes normality of the data, but allows each class to have its own covariance matrix. The result is that QDA is usually more flexible. LDA and QDA require the number of predictor variables to be less than the sample size.
3. RESULTS AND DISCUSSION 3.1. Spectrum characterization
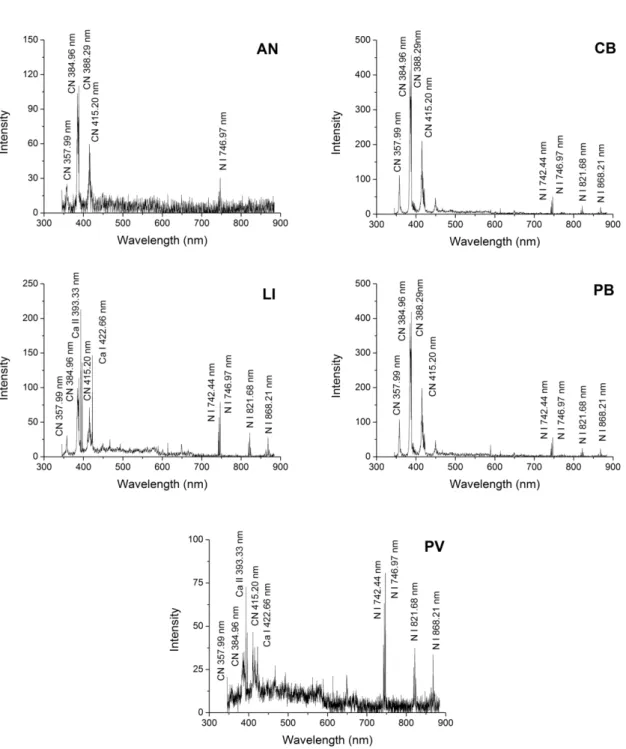
500 spectra for each of the aerosol samples were collected in nitrogen gas. Only Vis-range data were included in further investigations as they were more eventful. The typical average spectra of the aerosol samples, as well as the assignation of the most prominent spectral lines, are shown in Fig. 1. Among the most prominent observed lines in this range were CN bands, Ca and N peaks – other spectral features had small intensities. It is expected that the spectral intensities observed also depend on the water and volatile matter content of coal samples [42-44].
Nevertheless, reasonably good signal-to-noise spectra could be recorded for all samples during the ca. 25 minutes long measurement sessions.
357 358 359 360 361 362 363 364 365 366 367 368 369 370 371 372 373 374 375 376 377 378 379 380 381 382 383 384 385 386 387 388 389 390 391 392 393 394 395 396 397 398 399 400 401 402 403 404 405 406 407 408 409 410 411
Figure 1. Visible range, typical LIBS spectra of the studied coal aerosols (lignite (LI), anthracite (AN), Pécs-vasas brown coal (PV), Polish brown coal (PB), Czech brown coal (CB).
As it was expected, during the pre-processing of the LIBS data it became evident that only a part of the delivered 500 laser pulses actually hit particles directly or close enough to produce useful spectral information related to the coal aerosol particles. This fraction (“particle detection frequency”) can be expressed as the percents of the number of useful (particle) spectra per the total number of laser shots delivered. The presence of CN bands in the spectra was chosen as the indicator, and only those spectra were retained for further processing, which had integral CN band intensities in the range of 380-389 nm over three times of the standard deviation of the integral intensities in the same range of blank spectra.
416 417 418 419 420 421 422 423 424 425 426 427 428 429 430 431 432 433 434 435 436 437 438 439 440 441 442 443 444 445 446 447 448 449 450 451 452 453 454 455 456 457 458 459 460 461 462 463 464 465 466 467 468 469
9 The particle detection frequency is expected to be related to the concentration. Based on aerosol LIBS literature, it can be assumed that particle breakdown is efficient within a spherical region with a radius of 250 µm around the focal spot of the laser beam (by adopting the methodology described by Carranza and Hahn [45] and using E d3 proportionality). In addition this, the size (mass) of the broken down particle(s) also has to reach a certain level to allow detection (size or mass detection limit).
3.2. Estimation of the particle detection limit
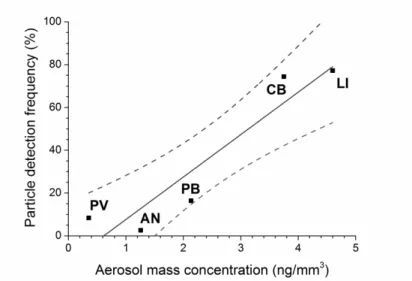
The knowledge of the concentration and average size of the particles for each aerosol sample makes it possible to estimate the particle size detection limit. This calculation is based on the viable assumption that particle detection frequency, under identical conditions, is proportional to the mass concentration of the aerosol. The total mass of the particles within the “blast radius”
(a plasma formation sphere with a radius of 250 m, or 6.5410-2 mm3 volume, imagined around the focal spot of the laser beam within which all particles are assumed to break down completely) has to exceed the minimum mass needed for detection. As Fig. 2. reveals, a linear correlation fairly holds for the samples studied here (the density of carbon was taken as the bulk density of 2.26 gcm-3 in these calculations [46]). Based on the data in Fig. 2., the minimum detectable aerosol mass concentration is ca. 600 pgmm-3. This estimate suggests that particles only get detected if their characteristic diameter is at least 2.3 m or if they are smaller but their number concentration is large enough to produce a mass concentration exceeding 600 pgmm-3. Since the characteristic diameter of the laser ablation generated aerosol particles in the present experiments was smaller than 1 m for all coal samples (cf. Table 1.), detection was granted by their sufficiently high number concentration.
Figure 2. Correlation plot of the particle detection frequency versus the aerosol mass concentration. The dotted curves indicate 90% confidence bands.
475 476 477 478 479 480 481 482 483 484 485 486 487 488 489 490 491 492 493 494 495 496 497 498 499 500 501 502 503 504 505 506 507 508 509 510 511 512 513 514 515 516 517 518 519 520 521 522 523 524 525 526 527 528 529
It is worth mentioning that the values of the above estimated size and mass concentration detection limits are dependent upon the defined size of the blast radius and a number of experimental factors, including e.g. the laser fluence and coal composition (e.g.
volatile matter content, moisture, etc., which influence the breakdown threshold [16]).
Nevertheless, the obtained values appear to be reasonable working estimates, as they are comparable to literature values for other particles (e.g. Panne et al. reported about a size detection limit of 0.75 m for NaCl particles [20] and Carranza et al. about 1 m for silica particles [45].
3.3. Discrimination/classification of coal aerosols
3.3.1. Sample discrimination by comparative functions
First, we attempted to use common comparative functions to discriminate between the coal aerosols. We tested three functions, namely linear correlation, sum of squared deviations and overlapping integral, which we had found earlier to be fairly efficient in discrimination applications [16, 31, 34]. The calculations were performed on unscaled data, following spectral masking (data were only retained in the spectral windows of 344-366 nm, 376-430 nm, 460-488 nm, 599-652 nm, 730-757 nm, 807-832 nm and 856-884 nm) in order to give more weight to significant spectral features. In spite of these efforts, all the three comparative functions failed to deliver in the present application; there was no significant difference found between the degree of similarity (Q) values and the repeatability was also poor.
3.3.2. Sample discrimination by multivariate statistical methods
3.3.2.1. Discrimination by multivariate methods combined with MCR-ALS compression
Data compression is often used in statistical data evaluation in order to decrease the number of variables. It is done mainly for two reasons: a.) for some statistical methods, the number of variables has to be small (e.g. LDA/QDA), and b.) decreasing the number of variables strongly reduces the size of data matrices and hence the computing time required for the modeling. The approach we chose for data compression was multivariate curve resolution alternating least squares (MCR-ALS), a reasonably modern method, which have already been proved to be an efficient tool (e.g. [34, 38]). Using the Scree-plot approach, it was established that five components (virtual variables) are sufficient to describe most of the variance in the datasets. All calculations were also performed with and without scaling by the autonorm algorithm, which was neccessary to compensate for intensity variations in LIBS spectra.
Three modeling approaches were tested: classification tree as well as linear and quadratic discrimination analysis (CLT, LDA, QDA). Training sample datasets consisted of 40, 534
535 536 537 538 539 540 541 542 543 544 545 546 547 548 549 550 551 552 553 554 555 556 557 558 559 560 561 562 563 564 565 566 567 568 569 570 571 572 573 574 575 576 577 578 579 580 581 582 583 584 585 586 587
11 randomly selected non-blank spectra of the given sample, according to the procedure described in Section 3.1. The modeling was then performed and repeated 15 times, each time with a different, randomly selected set of 40 spectra. For each statistical model and repetition, the confusion matrix was calculated. The overall accuracy of the model in each repetition was evaluated by calculating the average of the individual accuracies for all five coal aerosol samples (% of correct identifications, in the diagonal of each confusion matrices). Finally, the average and the standard deviation on the accuracy results were calculated (repeatability).
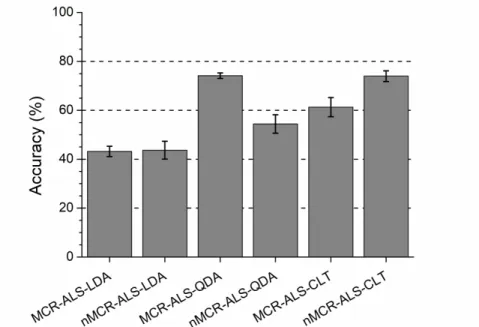
Fig 3. shows the overall discrimination results obtained using the CLT, LDA, QDA methods combined with MCR-ALS data compression. The error bars (standard deviation values) in the graph indicate the repeatability or robustness of the given model; the smaller is the standard deviation, the more reliable or stable the model is.
Figure 3. Comparison of the overall (average) accuracy and repeatability (error bars) of the multivariate statistical models used after MCR-ALS data compression. The ‘n’ in front of the name of the method
indicates that the calculation was performed after an automatic intensity scaling by the autonorm algorithm.
The best overall accuracy of the discrimination was clearly provided by the MCR-ALS- CLT method with normalization (74.0%), and by the MCR-ALS-QDA method without normalization (74.2%), although these values are also not excellent. The other two methods performed poorly; their overall accuracy only amounted to 40-60%. The breakaway of the QDA results from the LDA results is understandable, since the QDA works with nonplanar discrimination surfaces that have more flexibility. The CLT method clearly seems to be the most adaptable. The repeatability of the accuracy was good, a few percents only. Normalization was found to produce mixed results: for some methods it gave a weak or strong improvement (MCR- ALS-LDA or MCR-ALS-CLT), but for MCR-ALS-QDA the normalization strongly deteriorated accuracy. Based on these observations, the use of normalization can not be said to be clearly 593
594 595 596 597 598 599 600 601 602 603 604 605 606 607 608 609 610 611 612 613 614 615 616 617 618 619 620 621 622 623 624 625 626 627 628 629 630 631 632 633 634 635 636 637 638 639 640 641 642 643 644 645 646 647
advantageous. A further investigation of the confusion matrices of the two most accurate compressed methods revealed that although their overall (average) accuracy is very similar, but MCR-ALS-CLT gives a more balanced performance across sample types.
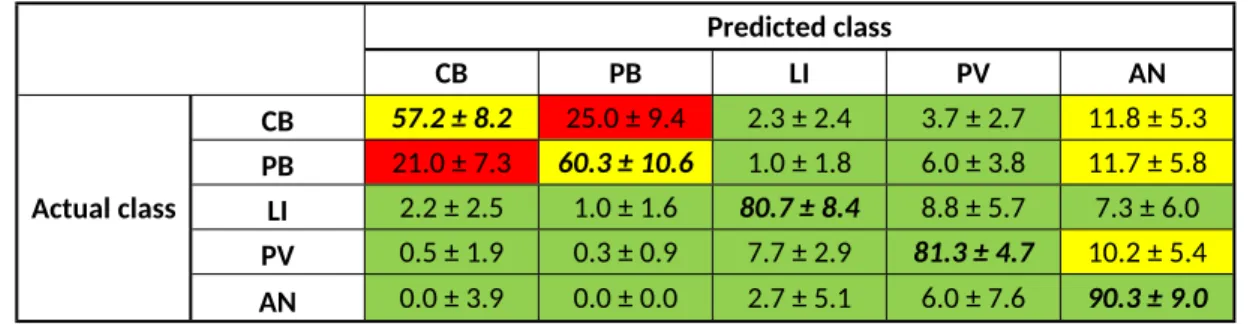
For a numerical illustration of the results, please see Table 2., which presents the confusion matrix for the most accurate model: nMCR-ALS-CLT (the ‘n’ in front of the name of the method indicates that the data was normalized by the autonorm algorithm). The rows of the matrix correspond to the actual sample classes, whereas the columns correspond to the predicted classes. The values in each cell normally represent the number of samples identified as belonging to the corresponding predicted class based on the statistical evaluation of the measurements. Of course, the ideal case is when all samples are correctly sorted into their corresponding classes, thus the diagonal values of the matrix should be equal to the number of samples (observations) in each actual classes, whereas the off-diagonal values would consequently be zeros (for further information, see e.g. [47]). In Table 2, a color coding and the indication of percentages of identifications were employed to allow a facile overview of performance. As it can be seen, the accuracy (% correct identifications, in the diagonal) is only good (above 80%) for just three samples, and it is fair (around 60%), for two samples. The latter sub-par values are clearly due to frequent false cross classifications between samples CB and PB (in above 20% of the cases) and with AN (above 10%). In other cases, false classifications are rare (below 10%).
In summary, the classification results achievable with MCR-ALS compression were deemed fair, but clearly not adequate for a reliable discrimination.
Predicted class
CB PB LI PV AN
CB 57.2 ± 8.2 25.0 ± 9.4 2.3 ± 2.4 3.7 ± 2.7 11.8 ± 5.3 PB 21.0 ± 7.3 60.3 ± 10.6 1.0 ± 1.8 6.0 ± 3.8 11.7 ± 5.8 LI 2.2 ± 2.5 1.0 ± 1.6 80.7 ± 8.4 8.8 ± 5.7 7.3 ± 6.0 PV 0.5 ± 1.9 0.3 ± 0.9 7.7 ± 2.9 81.3 ± 4.7 10.2 ± 5.4 Actual class
AN 0.0 ± 3.9 0.0 ± 0.0 2.7 ± 5.1 6.0 ± 7.6 90.3 ± 9.0
Table 2. Confusion matrix for method nMCR-ALS-CLT, containing data for the average accuracy (%) and repeatability from 15 repeated calculations for all samples with randomly selected spectra. Color coding
indicates good (green), fair (yellow) and poor (red) performance values in terms of accuracy and repeatability (see the text for more information).
3.3.2.2. Discrimination by multivariate methods without compression
In an attempt to further improve the accuracy of the modelling, we also tested the CLT and LDA methods without data compression. The QDA method could not be tested, as it would require a larger set of spectra (in excess of 2048, that is the number of variables). All calculations were 652
653 654 655 656 657 658 659 660 661 662 663 664 665 666 667 668 669 670 671 672 673 674 675 676 677 678 679 680 681 682 683 684 685 686 687 688 689 690 691 692 693 694 695 696 697 698 699 700 701 702 703 704 705
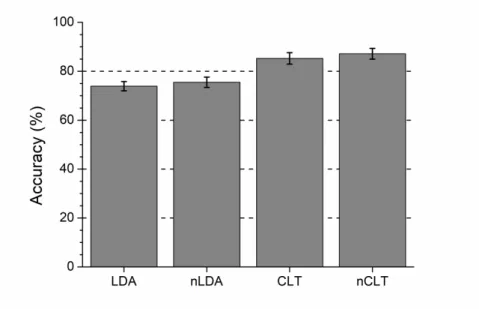
13 performed analoguosly to what was described in the previous section. The overview of the results are shown, with and also without normalization, in Fig 4.
Figure 4. Comparison of the overall accuracy and repeatability (error bars) of the multivariate statistical models used without data compression. The ‘n’ in front of the name of the method indicates that the
calculation was performed after an intensity scaling by the autonorm algorithm.
As it can be seen, the accuracy of the modeling greatly improved as a result of not using data compression (cf. Fig. 3). The best overall accuracy was achieved by using the CLT method with normalization; it was 87.2% with a repeatability of 2.2%. Again, it was found that the advantage brought about by using data normalization is only marginal, so its use can be considered as optional. This is somewhat unexpected, because the CLT method employs a set of conditions based on the intensity of spectral lines (Fig 5.). Nevertheless, this corroborates that the repeatability of LIBS spectra of the coal aerosols used here was good. This can be due to two reasons: a.) the number concentration was high, thus hundreds of particles were located within the blast radius, and b.) the “synthetic” coal aerosol particles were produced by laser ablation under controlled conditions, thus were reasonably similar.
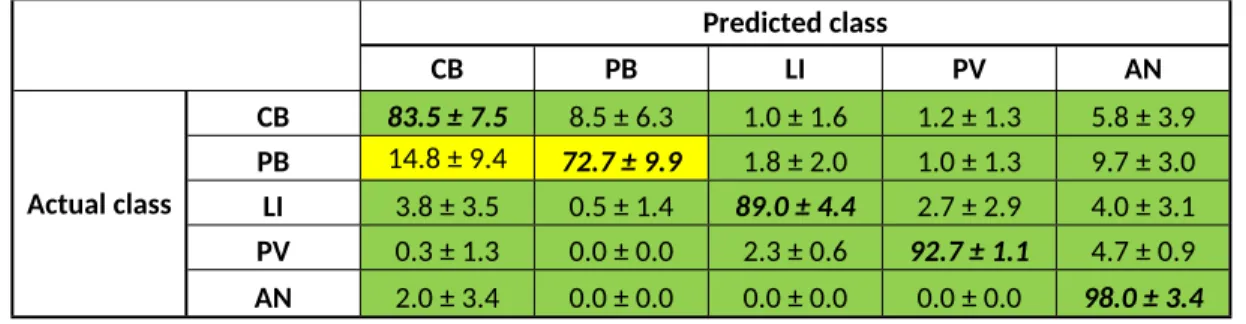
In Table 3., the confusion matrix can be seen for the model CLT that was found to be the most accurate. It is apparent that the performance of this method is good and well balanced: not only that 83.5% to 98.0% accuracy was achieved for 4 out 5 samples, but false classifiations are also rare (below 10%), except for sample PB (14.8%). It is also noteworthy that the classification was also successful for aerosol samples that were found to have a mass concentration close to the detection limit estimated in Section 3.2. This can be most probably attributed to that although the detection of the particles for these samples (e.g. PV and AN) was unfrequent and 711
712 713 714 715 716 717 718 719 720 721 722 723 724 725 726 727 728 729 730 731 732 733 734 735 736 737 738 739 740 741 742 743 744 745 746 747 748 749 750 751 752 753 754 755 756 757 758 759 760 761 762 763 764 765
weak, but their LIBS spectrum is characteristic enough to facilitate discrimination, e.g. due to their elemental fingerprint.
Predicted class
CB PB LI PV AN
CB 83.5 ± 7.5 8.5 ± 6.3 1.0 ± 1.6 1.2 ± 1.3 5.8 ± 3.9 PB 14.8 ± 9.4 72.7 ± 9.9 1.8 ± 2.0 1.0 ± 1.3 9.7 ± 3.0 LI 3.8 ± 3.5 0.5 ± 1.4 89.0 ± 4.4 2.7 ± 2.9 4.0 ± 3.1 PV 0.3 ± 1.3 0.0 ± 0.0 2.3 ± 0.6 92.7 ± 1.1 4.7 ± 0.9 Actual class
AN 2.0 ± 3.4 0.0 ± 0.0 0.0 ± 0.0 0.0 ± 0.0 98.0 ± 3.4
Table 3. Confusion matrix for method nCLT, containing data for the average accuracy (%) and repeatability from 15 repeated calculations for all samples with randomly selected spectra. Color coding
indicates good (green), fair (yellow) and poor (red) performance values in terms of accuracy and repeatability (see the text for more information).
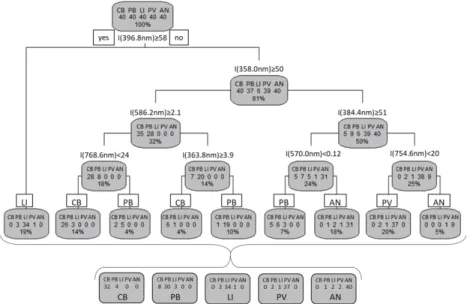
The use of the classification tree discrimination method is particularly useful in physical sciences because it is known to carry meaningful information about the composition or characteristics of the samples [39]. In the present case, the branching conditions are based on intensities measured at certain locations in the spectra, therefore if the condition indices in the classification tree are converted to wavelengths (Fig 5.), then information can be revealed about what spectral lines and hence what elemental components in the coal aerosol particles contributed to the conditions found by the CLT algorithm. The related spectral lines can be of small intensity, not easily detectable by the naked eye, but they can give a substantial contribution to the success of discrimination. In Table 3, we collected a list of elements with a potential contribution. The list is based on a search in the NIST Atomic Spectroscopy Database.
Only major (C, H, S, O, N) and minor (Na, Mg, K, Ca, P, Ti, Mn, Fe, Al, Si) elements reported as typically occurring in coal [48], and in the case of the latter group, only reasonably strong spectral lines were considered. As it can be seen, indeed, there is a potential complience for elements like C, H, S, Ca, Na, Si, Fe, Mn, Ti and Al.
770 771 772 773 774 775 776 777 778 779 780 781 782 783 784 785 786 787 788 789 790 791 792 793 794 795 796 797 798 799 800 801 802 803 804 805 806 807 808 809 810 811 812 813 814 815 816 817 818 819 820 821 822 823
15 CLT condition (nm) Potentially contributing elements
358.0 Fe, Ti, Mn
363.8 Fe, Ti
384.4 Ti, Fe, Mn, S
396.8 H, Ca, Fe, Mn
570.0 C, Na, Si, Fe
586.2 Fe, Al
754.6 Fe
768.6 C, Fe, Ti
Table 4. List of elements generally present in coal at major or minor concentration levels that can potentially contribute to spectral intensities leading to branching conditions found by the CLT algorithm.
Figure 5. A representative classification tree obtained by the nCLT method. Branching conditions are formulated by the algorithm based on spectral intensities.
4. CONCLUSIONS
In the present work, we demonstrated the capabilities of LIBS for the qualitative analysis of carbonaceous aerosols. By adopting the blast radius methodology, the size detection limit for coal aerosols was also estimated and found to be about 2.3 m. This means that for detectability, either the diameter of individual coal aerosol particles should be over this diameter or if they are smaller, their number concentration has to be large enough to exceed the equivalent mass concentration (ca. 600 pgmm-3). We also demonstrated that the statistical evaluation of LIBS aerosol spectra, especially using multivariate methods, can provide coal type (source) discrimination. The effect of data normalization (by the autonorm algorithm) and data compression (by the MCR-ALS methodology) prior to modeling was also tested and it was found 829
830 831 832 833 834 835 836 837 838 839 840 841 842 843 844 845 846 847 848 849 850 851 852 853 854 855 856 857 858 859 860 861 862 863 864 865 866 867 868 869 870 871 872 873 874 875 876 877 878 879 880 881 882 883
that while normalization provides marginal improvement, but data compression is generally not beneficial. The best overall performance was showed by the classification tree method without data compression (87.2% accuracy).
Although our work is a laboratory-based feasibility study, but the results demonstrate, for the first time in the literature according to our knowledge, that LIBS is a method that is capable of identifying the source coal type based on the analysis of coal aerosols with good accuracy, therefore it has the potential to become an important on-line tool for the apportionment of carbonaceous aerosols. The estimated 2.3 µm size detection limit indicates that not only PM10 but, with a more sensitive setup also running with a significantly higher laser repetition rate, also the PM2.5 fine fraction of coal aerosols can be detected and characterized by LIBS.
We would also like to mention that achieving an as low as possible mass concentration limit of detection (LOD) value was not our goal. Nevertheless, it can be estimated that with the optimization of the setup (e.g. higher laser fluence, higher solid angle of light collection, spectrometer throughput optimized for the wavelength of the emission line observed, etc.), a 100-fold improvement in the mass concentration LOD is possible, especially if the particles are composed of elements easily detectable by LIBS. The feasibility of such an improvement is clearly indicated by several LIBS aerosol studies (e.g. [19, 20, 45]).
Our results and the fact that the involved instrumentation is portable and robust suggest that LIBS may be successfully used in coal combustion flue gas imission studies. The protocol we propose for this application includes, as the first step, that a LIBS spectrum database should be constructed in the laboratory for coal aerosols generated by a laser ablation based system similar to the one we used in our study. Such ablation systems can relatively easily fine-tuned to generate particles either in the sub-micron or micron range. All major coal types available and used as fossil fuels in the area should be incorporated in this database. Second, a discrimination model is built and trained using the spectrum database. Our results indicate that the CLT method is a good candidate statistical approach. Following this, the same LIBS system should be transported to the field, to the location where the immission is planned to be investigated. On the spot, the LIBS spectrometer can be used to perform an on-line, continuous monitoring of a stream of air. In the event of particle (ensemble) detection, an individual classification result would be produced. Reasonably long data collection sequences (ca. 10-30 min) could then provide a near real-time, continuous estimation of the average % coal aerosol composition per source coal type by the statistical evaluation of the classification data produced for each spectrum collected. The collected LIBS spectra can also give information about the elements present in the individually identified particles. This may then be further used as a fingerprint to 888
889 890 891 892 893 894 895 896 897 898 899 900 901 902 903 904 905 906 907 908 909 910 911 912 913 914 915 916 917 918 919 920 921 922 923 924 925 926 927 928 929 930 931 932 933 934 935 936 937 938 939 940 941
17 identify the emission source (e.g. power or heating facility) if their input fuel elemental composition is known. This protocol can potentially also be extended to incorporate other fossil fuel types as well.
ACKNOWLEDGMENTS
The authors acknowledge the financial support from various sources including the Ministry of Human Capacities (through project 20391-3/2018/FEKUSTRAT) and the National Research, Development and Innovation Office (through projects K129063, EFOP-3.6.2-16-2017-00005, GINOP-2.3.2-15-2016-00036, EFOP-3.6.1-16-2016-00014 and ÚNKP-16-4) of Hungary, as well as by the János Bolyai Research Scholarship of the Hungarian Academy of Science. The authors are grateful for the insightful suggestions provided by Prof. R. Rajkó (University of Szeged, Hungary) on chemometric matters related to the present study.
REFERENCES
[1] M.O. Andreae, V. Ramanathan, Climate's dark forcings, Science 340 (2013) 280-281.
[2] J.E. Penner, R.E. Dickinson, C.A. O'Neill, Effects of aerosol from biomass burning on the global radiation budget, Science, 256 (1992), 1432-1435.
[3] H. Yu, Y.J. Kaufman, M. Chin, G. Feingold, L.A. Remer, T.L. Anderson, P. DeCola, A review of measurement-based assessments of the aerosol direct radiative effect and forcing, Atm.
Chem. Phys. 6(2006) 613-666.
[4] A. Pope, D. Dockery, Epidemiology of chronic health effects: cross-sectional studies, Chapter 7 in: Particles in Our Air: Concentrations and Health Effects (eds: R. Wilson, J.D.
Spengler), Harvard University Press, 1996.
[5] T.C. Bond, D.S. Covert, J.C. Kramlich, T.V. Larson, R.J. Charlson, Primary particle emissions from residential coal burning: Optical properties and size distributions, J. Geophys. Res.
Atm. 107 (2002) ICC 9-1-ICC 9-14.
[6] Gelencsér, A., Carbonaceous Aerosol, Springer, Dordrecht, 2004.
[7] R. Sempere, K. Kawamura, Comparative distributions of dicarboxylic acids and related polar compounds in snow, rain and aerosols from urban atmosphere, Atm. Environ., 28 (1994) 449-459.
[8] H. Cachier, M.P. Bremond, P. Buat-Ménard, Determination of atmospheric sootcarbon with a simple thermal method, Tellus 41B (1989) 379-390.
[9] M.R. Alfarra, H. Coe, J.D. Allan, K.N. Bower, H. Boudries, M.R. Canagaratna, J.L. Jimenez, J.T.
Jayne, A.A. Garforth, S.-M. Li, D.R. Worsnop, Characterization of urban and rural organic particulate in the Lower Fraser Valley using two Aerodyne aerosol mass 10 spectrometers, Atm. Environ. 38 (2004) 5745–5758.
947 948 949 950 951 952 953 954 955 956 957 958 959 960 961 962 963 964 965 966 967 968 969 970 971 972 973 974 975 976 977 978 979 980 981 982 983 984 985 986 987 988 989 990 991 992 993 994 995 996 997 998 999 1000 1001
[10] N. Utry, T. Ajtai, Á. Filep, M. Pintér, Zs. Török, Z. Bozóki, G. Szabó, Correlations between absorption Angström exponent (AAE) of wintertime ambient urban aerosol and its physical and chemical properties, Atm. Environ. 95 (2014) 52-59.
[11] T. Ajtai, N. Utry, M. Pintér, B. Major, Z. Bozóki, G. Szabó, A method for segregating the optical absorption properties and the mass concentration of wintertime urban aerosol, Atm. Environ. 122 (2015) 313-320.
[12] D. Mukherjee, M-D. Cheng, Quantitative analysis of carbonaceous aerosols using laser- induced breakdown spectroscopy: a study on mass loading induced plasma matrix effects, J. Anal. At. Spectrom. 23 (2008) 119-128.
[13] E. Vors, L. Salmon, Laser-induced breakdown spectroscopy (LIBS) for carbon single shot analysis of micrometer-sized particles, Anal. Bioanal. Chem. 385 (2006) 281–286.
[14] G. Galbács, A critical review of recent progress in analytical laser-induced breakdown spectroscopy, Anal. Bioanal. Chem. 407 (2015) 7537–7562.
[15] D.W. Hahn, N. Omenetto, Laser-induced breakdown spectroscopy (LIBS), Part II: review of instrumental and methodological approaches to material analysis and applications to different fields, Appl. Spectrosc. 66 (2012) 347–419.
[16] A. Metzinger, D. J. Palásti, É. Kovács-Széles, T. Ajtai, Z. Bozóki, Z. Kónya, G. Galbács, Qualitative discrimination analysis of coals based on their laser-induced breakdown spectra, Energy Fuels 30 (2016) 10306−10313.
[17] L. Zhang, Z.Y. Hu, W-B. Yin, D. Huang, W-G. Ma, L. Dong, H-P. Wu, Z-X. Li, L-T. Xiao, S-T. Jia, Recent progress on laser-induced breakdown spectroscopy for the monitoring of coal quality and unburned carbon in fly ash, Frontiers Phys. 7 (2012) 690–700.
[18] M. Noda, Y. Deguchi, S. Iwasaki, N. Yoshikawa, Detection of carbon content in a high- temperature and high-pressure environment using laser-induced breakdown spectroscopy, Spectrochim. Acta B 57 (2002) 701–709.
[19] D.W. Hahn, Laser-induced breakdown spectroscopy for analysis of aerosol particles: the path toward quantitative analysis, Spectrosc. 24 (2009) 26–33.
[20] U. Panne, D.W. Hahn, Analysis of aerosols by LIBS, Chapter 5, in Laser-induced breakdown spectroscopy (LIBS): Fundamentals and Applications (Eds. A.W. Miziolek, V. Palleschi, I.
Schechter), Cambridge University Press, pp. 194-253, 2006.
[21] C.B. Stipe, A.L. Miller, J. Brown, E. Guevara, E. Cauda, Evaluation of laser-induced
breakdown spectroscopy (LIBS) for measurement of silica on filter samples of coal dust, Appl. Spectrosc. 66 (2012) 1286-1293.
[22] J. Zheng, J. Lu, B. Zhang, M. Dong, S. Yao, W. Lu, X. Dong, Experimental study of laser- induced breakdown spectroscopy (LIBS) for direct analysis of coal particle flow, Appl.
Spectrosc. 68 (2014) 672 – 679.
[23] Z.Z. Wang, Y. Deguchi, M. Kuwahara, T. Taira, X.B. Zhang, J.J. Yan, J.P. Liu, H. Watanabe, R.
Kurose, Quantitative elemental detection of size-segregated particles using laser-induced breakdown spectroscopy, Spectrochim Acta B 87 (2013) 130-138.
[24] S. Yao, J. Xu, X. Dong, B. Zhang, J. Zheng, J. Lu, Optimization of laser-induced breakdown spectroscopy for coal powder analysis with different particle flow diameters, Spectrochim.
Acta B 110 (2015) 146-150.
1006 1007 1008 1009 1010 1011 1012 1013 1014 1015 1016 1017 1018 1019 1020 1021 1022 1023 1024 1025 1026 1027 1028 1029 1030 1031 1032 1033 1034 1035 1036 1037 1038 1039 1040 1041 1042 1043 1044 1045 1046 1047 1048 1049 1050 1051 1052 1053 1054 1055 1056 1057 1058 1059
19 [25] J. Kaiser, K. Novotny, M.Z. Martin, A. Hrdlicka, R. Malina, M. Hartl, V. Adam, R. Kizek, Trace
elemental analysis by laser induced breakdown spectroscopy—biological applications, Surf. Sci. Rep. 67 (2012) 233–243.
[26] R.A. Putnam, Q.I. Mohaidat, A. Daabous, S.J. Rehse, A comparison of multivariate analysis techniques and variable selection strategies in a laser-induced breakdown spectroscopy bacterial classification, Spectrochim. Acta B 87 (2013) 161–167.
[27] S. Manzoor, S. Moncayo, F. Navarro-Villoslada, J.A. Ayala, R. Izquierdo-Hornillos, F.J.
Manuel de Villena, J.O. Caceres, Rapid identification and discrimination of bacterial strains by laser induced breakdown spectroscopy and neural networks, Talanta 121 (2013) 65–
70.
[28] M. Gazmeh, M. Bahreini, S.H. Tavassoli, Discrimination of healthy and carious teeth using laser-induced breakdown spectroscopy and partial least square discriminant analysis, Appl. Opt. 54 (2015) 123–131.
[29] S.J. Rehse, H. Salimnia, A.W. Miziolek, Laser-induced breakdown spectroscopy (LIBS): an overview of recent progress and future potential for biomedical applications, J. Med. Eng.
Techn. 36 (2012) 77–89.
[30] P. Pořízka, D. Prochazka, Z. Pilát, L. Krajcarová, J. Kaiser, R. Malina, J. Novotný, P. Zemánek, J. Ježek, M. Šerý, S. Bernatová, V. Krzyžánek, K. Dobranská, K. Novotný, M. Trtílek, O. Samek, Application of laser-induced breakdown spectroscopy to the analysis of algal biomass for industrial biotechnology, Spectrochim. Acta B 74–75 (2012) 169–176.
[31] G. Galbács, N. Jedlinszki, A. Metzinger, Analysis and discrimination of soldering tin samples by collinear multi-pulse laser induced breakdown spectrometry, supported by inductively coupled plasma optical emission and mass spectrometry, Microchem. J. 107 (2013) 17-24.
[32] J. Moros, J. Serrano, C. Sánchez, J. Macías, J. J. Laserna, New chemometrics in laser-induced breakdown spectroscopy for recognizing explosive residues, J. Anal. At. Spectrom. 27 (2012) 2111-2122.
[33] I. Gaona, J. Serrano, J. Moros, J.J. Laserna: Range-adaptive standoff recognition of explosive fingerprints on solid surfaces using a supervised learning method and laser-induced breakdown spectroscopy, Anal. Chem. 86 (2014) 5045–5052.
[34] A. Metzinger, R. Rajkó, G. Galbács, Discrimination of paper and print types based on their laser induced breakdown spectra, Spectrochim. Acta B 94-95 (2014) 48-57.
[35] M. Pintér, T. Ajtai, G. Kiss-Albert, D. Kiss, N. Utry, P. Janovszky, D. Palásti, T. Smausz, A.
Kohut, B. Hopp, G. Galbács, Á. Kukovecz, Z. Kónya, G. Szabó, Z. Bozóki, Thermo-optical properties of residential coals and combustion aerosols, Atm. Environ. 178 (2018) 118- 128.
[36] T. Ajtai, N. Utry, M. Pintér, G. Kiss-Albert, R. Puskás, Cs. Tápai, G. Kecskeméti, T. Smausz, B.
Hopp, Z. Bozóki, Z. Kónya, G. Szabó, Microphysical properties of carbonaceous aerosol particles generated by laser ablation of a graphite target, Atm. Meas. Techn. 8 (2015) 1207-1215.
[37] W.H. Lawton, E.A. Sylvestre, Self modeling curve resolution, Technometrics 13 (1971) 617- 633.
[38] A. de Juan, R. Tauler, Multivariate curve resolution (MCR) from 2000: Progress in concepts and applications, Crit. Rev. Anal. Chem. 36 (2006) 163-176.
1065 1066 1067 1068 1069 1070 1071 1072 1073 1074 1075 1076 1077 1078 1079 1080 1081 1082 1083 1084 1085 1086 1087 1088 1089 1090 1091 1092 1093 1094 1095 1096 1097 1098 1099 1100 1101 1102 1103 1104 1105 1106 1107 1108 1109 1110 1111 1112 1113 1114 1115 1116 1117 1118 1119
[39] L. Breiman, J.H. Friedman, R.A. Olshen, C.J. Stone, Classification and regression trees, Monterey, CA: Wadsworth & Brooks/Cole Advanced Books & Software, 1984.
[40] R. Rajkó, K. István, Analytical solution for determining feasible regions of self-modeling curve resolution (SMCR) method based on computational geometry. J. Chemom. 19 (2005) 448-463.
[41] C.J. Huberty, S. Olejnik, Applied MANOVA and discriminant analysis, Wiley and Sons, 2006.
[42] M. Chen, T. Yuan, Z. Hou, Z. Wang, Y. Wang, Effects of moisture content on coal analysis using laser-induced breakdown spectroscopy, Spectrochim. Acta B 112 (2015) 23–33.
[43] T. Yuan, Z. Wang, S-L. Lui, Y. Fu, Z. Li, J. Liu, W. Ni, Coal property analysis using laser- induced breakdown spectroscopy, J. Anal. At. Spectrom. 28 (2013) 1045-1053.
[44] M. Dong, J. Lu, S. Yao, J. Li, J. Li, Z. Zhong. W. Lu, Application of LIBS for direct
determination of volatile matter content in coal, J. Anal. At. Spectrom. 26 (2011) 2183- 2188.
[45] J. E. Carranza, D. W. Hahn, Plasma volume considerations for analysis of gaseous and aerosol samples using laser-induced breakdown spectroscopy, J. Anal. At. Spectrom. 17 (2002) 1534–1539.
[46] D.R. Lide, ed., CRC handbook of chemistry and physics, CRC Press, 2005.
[47] C. Sammut, G.I. Webb, eds., Encyclopedia of Machine Learning and Data Mining, Springer Science + Business Media, 2017.
[48] M.P. Ketris, Ya.E. Yudovich, Estimations of clarkes for carbonaceous biolithes: World averages for trace element contents in black shales and coals, Int. J. Coal Geol. 78 (2009) 135–148.
1124 1125 1126 1127 1128 1129 1130 1131 1132 1133 1134 1135 1136 1137 1138 1139 1140 1141 1142 1143 1144 1145 1146 1147 1148 1149 1150 1151 1152 1153 1154 1155 1156 1157 1158 1159 1160 1161 1162 1163 1164 1165 1166 1167 1168 1169 1170 1171 1172 1173 1174 1175 1176 1177