Multi-Dimensional Immuno-Profiling of Drosophila Hemocytes by Single Cell 1
Mass Cytometry 2
3
József Á. Balog1,2,#, Viktor Honti3,#, Éva Kurucz3,#, Beáta Kari3, László G. Puskás1, 4
István Andó3,*,§, Gábor J. Szebeni1,4*,§
5 6
1Laboratory of Functional Genomics, Institute of Genetics, Biological Research 7
Centre, Szeged, H-6726, Hungary 8
2University of Szeged, Ph.D. School in Biology, Szeged,H-6726,Hungary 9
3Immunology Unit, Institute of Genetics, Biological Research Centre, Szeged, H-6726, 10
Hungary 11
4Department of Physiology, Anatomy and Neuroscience, Faculty of Science and 12
Informatics, University of Szeged, H-6726, Hungary 13
14 15 16
# Equal contribution 17
* Corresponding authors.
18
E-mail: ando@brc.hu (I Ando), szebeni.gabor@brc.hu (GJ Szebeni) 19
§Current address:
20
[Institute of Genetics], [Biological Research Centre], [Szeged] [H-6726], [Hungary].
21 22
Running title: Balog JA et al / Single Cell Mass Cytometry in Drosophila 23
Total counts of words (4928), figures (4), tables (1), supplementary figures (9), 24
References from 2014:18 25
Abstract
26Single cell mass cytometry (SCMC) combines features of traditional flow cytometry 27
(FACS) with mass spectrometry and allows the measurement of several parameters at 28
the single cell level, thus permitting a complex analysis of biological regulatory 29
mechanisms. We optimized this platform to analyze the cellular elements, the 30
hemocytes, of the Drosophila innate immune system. We have metal-conjugated six 31
antibodies against cell surface antigens (H2, H3, H18, L1, L4, P1), against two 32
intracellular antigens (3A5, L2) and one anti-IgM for the detection of L6 surface 33
antigen, as well as one anti-GFP for the detection of crystal cells in the immune 34
induced samples. We investigated the antigen expression profile of single cells and 35
hemocyte populations in naive, in immune induced states, in tumorous mutants 36
(hopTum bearing a driver mutation and l(3)mbn1 carrying deficiency of a tumor 37
suppressor) as well as in stem cell maintenance defective hdcΔ84 mutant larvae.
38
Multidimensional analysis enabled the discrimination of the functionally different 39
major hemocyte subsets, lamellocytes, plasmatocytes, crystal cell, and delineated the 40
unique immunophenotype of the mutants. We have identified sub-populations of 41
L2+/P1+ (l(3)mbn1), L2+/L4+/P1+ (hopTum) transitional phenotype cells in the 42
tumorous strains and a sub-population of L4+/P1+ cells upon immune induction. Our 43
results demonstrated for the first time, that mass cytometry, a recent single cell 44
technology combined with multidimensional bioinformatic analysis represents a 45
versatile and powerful tool to deeply analyze at protein level the regulation of cell 46
mediated immunity of Drosophila.
47 48
KEYWORDS: Mass Cytometry; Innate Immunity; Drosophila; Single Cell Analysis, 49
Hemocyte 50
51 52 53
Introduction
54In the animal kingdom, insects have multi-layered innate immune defence mechanisms 55
against invading pathogens. Work on insects, including the fruit fly, Drosophila 56
melanogaster which lacks an acquired immune response, plays an important role in our 57
understanding of how innate immunity works [1, 2]. The conserved signaling pathways 58
between insects and vertebrates, combined with the powerful genetic resources 59
provided by Drosophila, make this organism an ideal system to model biological 60
phenomena related to human biology and medicine. In Dorosphila, microbial infection 61
induces a powerful humoral immune response, the release of antimicrobial peptides, 62
the regulation of which is now well understood [3]. Infection by parasites, development 63
of tumours or wounding induce a cellular immune response by blood cells, the 64
hemocytes, which are capable of sophisticated functions, as recognition, encapsulation 65
and killing of parasites and phagocytosis of microorganisms [4−6]. These functions are 66
exerted by specialized blood cells the phagocytic plasmatocytes, the encapsulating 67
lamellocytes and the melanizing crystal cells. For the identification and 68
characterization of the mechanisms of cell mediated immunity through which the 69
immune cells and tissues can be specifically studied and manipulated, quantitative 70
methods are required. For the definition of the functional hemocyte subsets transgenic 71
reporter constructs and monoclonal antibodies have been developed. These systems 72
generally use fluorescent molecules in the form of in vivo markers and antibodies, the 73
use of which significantly contributed to our understanding of innate immunity [7−9].
74
Recently, single cell mass cytometry was developed to monitor the expression of 75
marker molecules in haematological and other pathological conditions [10,11]. The 76
antibodies against cell type specific antigens are applicable to monitor blood cell 77
differentiation during ontogenesis or following immune induction. However, 78
traditional antibody staining against only one or two of the cell type specific antigens 79
is not sufficient to describe individual hemocyte populations with complex antigen 80
expression patterns. Therefore, we adopted and optimized single cell mass cytometry 81
for Drosophila by multiplex analysis of antibodies to transmembrane proteins and 82
intracellular antigens of IgG and IgM type, routinely used for detecting and 83
discriminating hemocyte subsets of Drosophila melanogaster [7, 12−16].
84
The circulating hemocytes of the Drosophila larva are classified into three categories, 85
of which only two cell types are present in naive condition. These are the small round 86
phagocytic plasmatocytes, which account for 95% of the circulating hemocytes, and 87
the melanizing crystal cells, which are similar in size to plasmatocytes, but contain 88
prophenoloxidase crystals in their cytoplasm. The third cell type, the large flattened 89
lamellocytes differentiate only in tumorous larvae and in case of immune induction, 90
such as wounding or parasitic wasp infestation [17]. Lamellocytes, together with 91
plasmatocytes are capable of forming a multilayer capsule around the wasp egg, 92
thereby killing the invader [18−20]. Plasmatocytes, crystal cells and lamellocytes can 93
be distinguished with cell type specific monoclonal antibodies, and in vivo transgenic 94
reporters [7−9, 12−15]. All plasmatocytes express the P1 antigen (coded by the 95
nimC1 gene) [21], while lamellocytes show a characteristic expression of L1 (the 96
product of the atilla gene), L2, L4, and L6 [14]. Following immune induction, a 97
portion of plasmatocytes transdifferentiate into lamellocytes to fight the parasitic 98
wasp egg [22−25]. This transdifferentiation is accompanied by a stepwise alteration 99
of lamellocyte specific antigen expression.
100
Understanding cancer, a devastating disease of multicellular organisms is a challenge 101
for scientists. The conserved signal transduction pathways in Drosophila with 102
mammals and the easy genetic manipulation made the fruit fly a frequently used 103
model organism to study cancer [26]. Therefore, we investigated two different 104
tumorous Drosophila strains, one bearing a driver mutation (hopTum) and one carrying 105
deficiency of a tumor suppressor (l(3)mbn1). Constitutive activation of the Drosophila 106
Janus kinase namely, the Hopscotch (Hop) causes melanotic tumors, lymph gland 107
hypertrophy in the larvae and malignant neoplasia of hopTum Drosophila blood cells 108
[27]. The homozygously mutated state of the tumor suppressor gene, called lethal (3) 109
malignant blood neoplasm causes malignant transformation, enhanced hemocyte 110
proliferation and lamellocyte differentiation of l(3)mbn1 Drosophila blood cells [28].
111
We also investigated the immunophenotype of the mutation of the hdc gene (hdcΔ84), 112
which encodes for the Drosophila homolog (Headcase) of the human tumor 113
suppressor HECA and plays a role in hematopoietic stem cell maintenance [29, 30].
114
Wild type Oregon-R (Ore-R) and white mutant w1118 were used as reference strains 115
because w1118was considered previously as wild type and used for the generation of 116
mutants [31]. Immune activation was monitored successfully by infestation with the 117
Leptopilina boulardi parasitoid wasp of Drosophila larvae in the lozenge>GFP strain 118
(lz-Gal4, UAS-GFP; +; +), in which crystal cells were monitored by metal tag 119
labeled anti- GFP antibody [32, 33].
120
We are the first to demonstrate that single cell mass cytometry is a powerful tool for 121
the characterization of hemocytes in different mutants of Drosophila strains at protein 122
level. Bioinformatic analysis revealed the characteristic protein expression pattern of 123
hemocyte subsets at single cell resolution from the studied different genetic variants.
124
These together suggest that single cell mass cytometry is a valuable tool for 125
characterizing immune phenotypes in any model organism, in which antibodies 126
against immune components are available.
127
Results and Discussion
128Single cell mass cytometry revealed the transitional phenotypes of hemocytes in 129
the tumorous hopTum and l(3)mbn1strains.
130
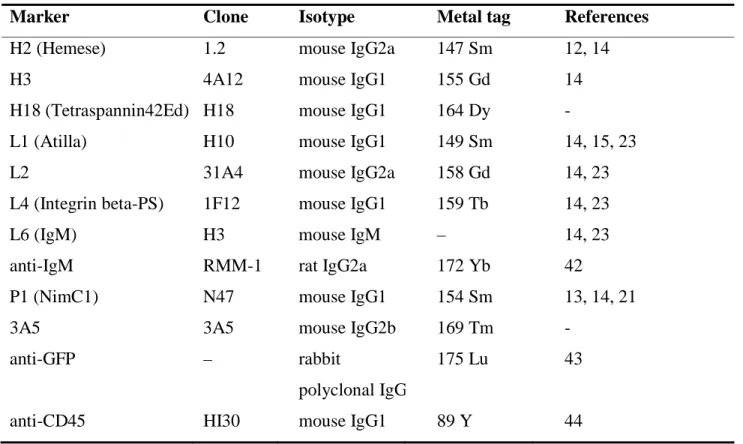
We have built the metal tag labelled panel of discriminative antibodies recognizing 131
Drosophila melanogaster hemocytes and hemocyte subsets for mass cytometry. We 132
have conjugated six antibodies against cell surface antigens (H2, H3, H18, L1, L4, P1), 133
against two intracellular antigens (3A5, L2) and one anti-IgM for the detection of L6 134
surface antigen. List of the antibodies can be found in Table 1. The H18 and 3A5 135
antibodies reported herein first were characterized and validated before the study by 136
indirect immunofluorescence and Western-blot analysis (Figure S1 and S2). The 137
analysis revealed that 3A5 molecule is expressed in plasmatocytes and lamellocytes in 138
l(3)mbn1, but not expressed in lamellocytes of immune (L.b.) induced larvae (Figure 139
S1), while H18 molecule as a pan-hemocyte marker is expressed in all tested samples 140
(Figure S2). To test and optimize the reactions of the antibodies, a comparative 141
analysis was carried out by correlating the fluorescence activated cell sorting (FACS) 142
(Figure S3A) and the mass cytometry histograms (Figure S3B). The comparison 143
showed similar reactivity patterns. Hemese (H2) pan-hemocyte marker positive single 144
live cells were gated for mass cytometry analysis (Figure S4). All metal-tag labelled 145
antibodies were titrated for mass cytometry as shown in Figure S5. Next, we 146
compared the expansion of the hemocyte populations in the mutants in relation to the 147
two wild type Ore-R and w1118. The proportion of hemocytes expressing the 148
investigated markers were similar in wild type (wt) Ore-R and w1118. However, we 149
detected a significant proliferation of hemocytes expressing the L1, L2, and L4 150
markers in l(3)mbn1 and hopTum mutant larvae, reflecting an extensive differentiation 151
of lamellocytes, a phenotypic characteristic to the blood cell malignancy. A slight 152
elevation in the proportion of L6 expressing hemocytes was also detected (Figure S6 153
and Figure 1A). The explanation for this moderate change may be the fact that L6 is 154
only expressed by a subset of lamellocytes in tumorous larvae [14]. All lamellocyte 155
markers showed a higher expression level in the tumorous hopTum mutant compared to 156
the control (Figure S7 and Figure 1B). In the hdc∆84 mutant larvae, we detected a 157
moderate elevation in the expression level of L2, and a decrease in the expression 158
level of P1 (Figure 1B), however, the number of hemocytes expressing lamellocyte 159
markers did not show a significant increase compared to the controls (Figure 1A).
160
This is in line with the finding that in the hdc∆84 mutant larvae, lamellocytes 161
differentiate in low numbers, while the number of plasmatocytes are reduced [30].
162
This reduction of plasmatocyte number is also observable in Figure 1A.
163
Multidimensional analysis by the algorithm of t-distributed stochastic neighbor 164
embedding (tSNE) and the visualization of stochastic neighbor embedding (viSNE) 165
was carried out within the H2 (Hemese) positive live singlets based on H3, H18, L1, 166
L2, L4, L6, P1, and 3A5 marker expression in order to map high parametric single 167
cell data on biaxial plots [34]. The viSNE patterns of hemocyte marker expression 168
correlated to the data shown in Figure 1 (Figure 2). The viSNE bioinformatic analysis 169
revealed the characteristic protein expression pattern of hemocyte subsets at single 170
cell resolution from the studied genetic variants.We observed a dramatic difference in 171
the viSNE patterns between hemocytes isolated from the tumorous l(3)mbn1 and 172
hopTum larvae as compared to either control Ore-R or w1118 larvae (Figure 2). Control 173
Ore-R or w1118 hemocytes were not discriminated on the viSNE plots showing their 174
minimal genetic distance but tumorous l(3)mbn1 and hopTum larvae delineated viSNE 175
maps with the expansion of lamellocytes (Figure 2). In the hdc∆84 larvae, we detected 176
a subset of hemocytes that express the 3A5 marker at a high level. This subset was 177
detected neither in the control, nor in the tumorous larvae, and may represent a cell 178
type that differentiate as a precursor for lamellocytes as a consequence of the defect in 179
the maintenance of the hematopoietic niche [30].
180
The Uniform Manifold Approximation and Projection (UMAP) analysis was 181
performed by the hemocyte subset specific, discriminating markers: L1, L2, L4, L6 182
for lamellocytes and P1 for plasmatocytes on the 5 studied genetic variants of 183
Drosophila melanogaster. The UMAP analysis resulted in the same conclusion as 184
tSNE, namely, that lamellocyte expansion occurs in in tumorous strains l(3)mbn1 and 185
hopTum (Figure S8). Both the viSNE and UMAP analysis demonstrate transitional 186
phenotypes of certain lamellocytes and plasmatocytes by the transitional coloration of 187
marker expression (partially overlapping L2+ or L4+ with some P1+ cells) at protein 188
level in l(3)mbn1 and hopTum. Merging viSNE graphs outlined characteristic maps of 189
each strain based on high parametric mass cytometry data (Figure 3A-C). The Ore-R 190
and w1118 controls showed overlapping patterns on the viSNE diagram (Figure 3A-C), 191
with a somewhat lower expression of all markers observed in case of the w1118, which 192
may be due to uncontrollable genetic background variations. The dots representing to 193
hdc∆84 hemocytes, mutant of the hdc regulator of hematopoietic stem cell maintenance 194
[30], were detected as a zone in between the control and the tumorous patterns (Figure 195
3C). The most likely explanation to this phenomenon is that hdc∆84 homozygous 196
larvae produce lamellocytes, but in a much lower proportion than tumorous larvae, the 197
l(3)mbn1 and hopTum [30]. Tumorous hemocytes l(3)mbn1 and hopTum were closely 198
mapped and partially overlapping, giving a population clearly separated from the 199
cloud of the controls, due to the lamellocye-expansive malignant phenotype (Figure 200
3A-C).
201
Single cell mass cytometry revealed the transitional phenotypes of hemocytes 202
upon immune induction 203
In order to monitor the changes in the composition of hemocyte subsets following 204
immune induction, we used lz>GFP larvae and complemented the experiment with 205
anti-GFP labeling, which enables the detection of crystal cells [32, 33]. The tSNE 206
analysis of H3, H18, L1, L2, L4, L6, P1, 3A5 markers and anti-GFP (marking crystal 207
cells in this particular system) was carried out within the population of pan-hemocyte 208
H2 (Hemese) positive live singlets (Figure 4A). We observed a new subset of 209
hemocytes appearing 72 h after infestation of the lz>GFP larvae with the parasitic 210
wasp (Figure S9. and Figure 4A). This subset of cells accounts for the lamellocytes 211
that differentiate as a result of the immune induction, since these cells fall into the 212
high expression part of the viSNE for the L1, L2, L4, and L6 lamellocyte markers 213
(Figure S9. and Figure 4A). This finding is in correlation with the increase of the 214
number of hemocytes expressing the L1 (35.1% vs. 1.81%), L2 (32% vs. 1.6%), L4 215
(34.36% vs. 1.39%) and L6 (13.82 vs. 0.935%) markers (Figure 4B), and the elevated 216
expression levels of the lamellocyte markers detected in immune induced larvae 217
compared to the naive control (Figure 4C). Interestingly, a new subset of crystal cells 218
(anti-GFP + cells) also appeared in immune induced (lz>GFP i.i.) larvae compared to 219
the control (lz>GFP) (Figure 4A). The viSNE pattern of the 3A5 marker also changed 220
significantly after the immune induction, which may be due to the newly 221
differentiating hemocytes, similarly to that observed in the hdc∆84 larvae (Figure 4A).
222
Taken together, we report herein the first panel of metal-conjugated anti-Drosophila 223
antibodies to present the applicability of mass cytometry for that canonical model 224
organism of genetics. Recent studies identified novel subpopulations of Drosophila 225
hemocytes based on single cell RNA data [35−38]. These findings largely contributed 226
to the definition of hemocyte clusters and to the characterization of intermediate cells 227
in the transition from plasmatocyte to lamellocyte. In these experiments, clusters were 228
defined by the gene expression patterns of individual hemocytes. The application of 229
CyTOF (cytometry by time-of-flight) can complement these comprehensive 230
transcriptomic studies and verify the existence of transitional phenotypes at protein 231
level. The comparative analysis of Ore-R and white1118 with l(3)mbn1, HopTum, hdcΔ83 232
revealed transitional phenotypes at protein level and the differences among reference 233
stains: Ore-R and white1118. Both the viSNE and UMAP analysis demonstrated 234
transitional phenotype of certain sub-populations of lamellocytes and plasmatocytes 235
by the transitional coloration of common marker expression (partially overlapping 236
L2+ or L4+ with P1+ cells) at protein level in l(3)mbn1, hopTum. This has been verified 237
by a functional assay of immune induction (Figure 4). Our study demonstrates 238
transitional phenotypes (Figure 2, Figure 4, Figure S8) from single cell data at protein 239
level which places the innate immunity of Drosophila in a new biological insight.
240
Additionally, we report herein two novel hemocyte markers, H18 located on the cell 241
surface and 3A5 with intracellular localization. The simultaneous detection of several 242
antigens provided by CyTOF could not be achieved earlier by traditional microscopy.
243
The main advantage of CyTOF is the multidimensionality coupled with complex 244
computational tools, therefore we propose the extension of the basic panel used in our 245
study with antibodies recognizing signaling molecules (e.g. MAP kinases), enzymes 246
(to follow metabolic pathways), cellular structural proteins (e.g. cytoskeletal, cargo 247
proteins) up to 42 markers in one single tube. Another advantage of the presented 248
method is that CyTOF enables investigations at protein level (data of transcriptomics 249
should be also verified at protein level) with single cell resolution. However, we may 250
consider the limitations of the CyTOF which are a.) the availability of antibodies 251
against the protein of interest (which is also a limitation for other antibody-based 252
detection approaches). Moreover, anti-tag antibodies are available when the protein of 253
interest is labelled with a fusion tag, or the cell of interest is labelled with the 254
expression of a marker protein (we report herein the use of anti-GFP). Another 255
limitations are b) the availability of the CyTOF technology (it is increasing and most 256
of the research centres are supposed to own the technology, as there were 94 257
instruments already installed in Europe in 2020 January), c) the relative high cost of 258
the CyTOF technology (although the cost should be taken into account by the number 259
of investigated markers at protein level and the number of single cells).
260
We believe that our method serves as a rapid and cost-effective tool to monitor the 261
alteration of hemocyte composition influenced by various agents or mutations. In 262
those cases, it is less expensive and easier to perform than single-cell transcriptome 263
analysis. Additionally, the CyTOF can complement transcriptomic studies verifying 264
up to 42 simultaneous markers at protein level with single cell resolution.
265
Conclusion
266The SCMC combines the features of traditional cytometry with mass spectrometry 267
and enables the detection of several parameters at single cell resolution, thus 268
permitting a complex analysis of biological regulatory mechanisms. We optimized 269
this platform to analyze the cellular elements, the hemocytes of the Drosophila innate 270
immune system. The SCMC analysis with 9 antibodies to all hemocytes and 271
hemocyte subsets showed a good accordance of fluorescence flow cytometry results, 272
in terms of positivity on hemocytes of the tumor suppressor mutant l(3)mbn1. Further, 273
we investigated the antigen expression profile of single cells and hemocyte 274
populations in Ore-R and w1118 controls, and tumorous (l(3)mbn1, hopTum) strains, as 275
well as in a stem cell maintenance defective mutant (hdcΔ84). The immunophenotype 276
of immune activation upon infestation with a parasitoid wasp, the differentiation of 277
lamellocytes was detected by 10 antibodies in the lz>GFP.
278
Multidimensional analysis (viSNE) enabled the discrimination of the major 279
hemocytes: lamellocytes, plasmatocytes, crystal cells and delineated the unique single 280
cell immunophenotype of the mutant strains under investigation. Single cell mass 281
cytometry identified sub-populations of L2+/P1+ (l(3)mbn1), L2+/L4+/P1+ (hopTum) 282
transitional phenotype cells in the tumorous strains and a sub-population of L4+/P1+
283
cells upon immune induction. We demonstrated that mass cytometry, a recent single 284
cell technology coupled with multidimensional bioinformatic analysis at protein level 285
represents a powerful tool to deeply analyze Drosophila, a key multicellular model 286
organism of genetic studies with a wide inventory of available mutants.
287
Materials and methods
288Drosophila stocks 289
The following Drosophila lines were used in the study: w1118 (BSC#9505), ORE-R 290
(wild type), w; hdcΔ84/TM3, Kr>GFP [30], lz-Gal4, UAS-GFP; +; + (a gift from 291
Bruno Lemaitre, Lausanne, Switzerland) [32], l(3)mbn1/TM6 Tb [28], a homozygous 292
hopTum (BSC#8492) line generated by dr. Gábor Csordás (BRC, Szeged, Hungary).
293
The flies were grown on a standard cornmeal-yeast substrate at 25 °C.
294
Production of the H18 and 3A5 antibodies 295
Monoclonal antibodies against Drosophila hemocytes were raised as described 296
previously [14]. Briefly, BALB/c mice were immunized by i.p. injection of 106 297
hemocytes from late third instar larvae of the lethal(3)malignant blood neoplasm 298
[l(3)mbn1] mutant larvae in Drosophila Ringer’s solution (Sigma-Aldrich, St. Louis, 299
MI, USA). Booster injections were given 4, 8, and 13 weeks later. Three days after 300
the last immunization, spleen cells were collected and fused with SP2/O myeloma 301
cells by using polyethylene glycol (PEG1450, P5402 Sigma-Aldrich). Hybridomas 302
were selected in HAT medium (HAT = hypoxanthine-aminopterin-thymidine 303
Supplement, 21060017 Thermo Fischer Scientific Waltham, MA, USA) and 304
maintained as described by Kohler and Milstein [14, 39]. Hybridoma culture 305
supernatants were screened by indirect immunofluorescence on acetone fixed, 306
permeabilized and on live hemocytes. The selected hybridomas were subcloned three 307
times by limiting dilution.
308
Isolation of hemocytes 309
Hemocytes were isolated from late third stage larvae by dissecting the larvae in 310
Drosophila Schneider’s solution (21720001 Thermo Fisher Scientific, Waltham, MA, 311
USA)) supplemented with 5% fetal bovine serum albumin (FBS, F7524-500ML 312
Sigma-Aldrich) plus 0.003% 1-phenyl-2-thiourea (P7629 Sigma-Aldrich).
313
Immune induction 314
lz-Gal4; UAS-GFP flies (lz>GFP) laid eggs for three days in bottles containing 315
standard Drosophila medium. After 72 hours, larvae were infected with Leptopilina 316
boulardi wasps for 6 hours. Larvae with visible melanotic nodules were selected 72 317
hours after infestation for isolation of hemocytes. Age and size-matched larvae were 318
used as control.
319
Immunofluorescent staining 320
Immunofluorescent staining was performed as described previously [23]. Briefly, 321
hemocytes were attached to multispot slides (SM-011, Hendley-Essex, Loughton, 322
UK) at 21 °C for 45 min. Fixation was performed with acetone for 6 min, rehydrated 323
and subsequently blocked for 20 min in PBS supplemented with 0.1% BSA (PBS = 324
phosphate buffered saline, P4417 Sigma-Aldrich; BSA = bovine serum albumin, 325
A2058 Sigma-Aldrich), incubated with the indicated antibodies for 1 h at 21 °C, 326
washed three times with PBS and incubated with CF-568 conjugated anti-mouse IgG 327
(H+L), F(ab’)2 fragment (1:1000, SAB4600082 Sigma-Aldrich) for 45 min. Nuclei 328
were labeled with DAPI (D9542 Sigma-Aldrich). The microscopic analysis was 329
carried out using a Zeiss Axioskope 2MOT epifluorescent microscope and Axiovision 330
2.4 software (Zeiss, Oberkochen, Germany).
331
Western blotting 332
Western blotting was performed in order to test the specificity of the anti-3A5 and 333
anti-H18 antibodies as described previously [12]. Briefly, proteins were differentiated 334
by SDS-PAGE. Following the electrophoresis, the proteins were blotted onto 335
nitrocellulose membrane (Hybond-C, 10564755 Amersham Pharmacia, 336
Buckinghamshire, UK) in the transfer buffer (25 mM Tris pH 8.3, 192 mM glycine, 337
20% (V/V) methanol). The nonspecific binding was blocked with PBS supplemented 338
with 0.1% Tween 20 (PBST, P1379 Sigma-Aldrich) and 5% non-fat dry milk at 21 °C 339
for 1 h. The blotted proteins were reacted to the indicated antibody (anti-3A5 in 340
Figure S1, and anti-H18 in Figure S2) with rotation at 21 °C for 3 h. Washing was 341
performed with PBST three times for 10 min and then incubated with 342
HRPO-conjugated anti-mouse antibody (62-6520 Thermo Fisher Scientific). After 343
three washes with PBST for 10 min, the proteins were detected by the ECL-Plus 344
system (32132 Thermo Fisher Scientific) following the manufacturer’s 345
recommendations.
346
Flow cytometry 347
Flow cytometry was executed as published previously [12]. Briefly, 20 µl of 107/ml 348
hemocyte suspension was plated in insect Schneider’s medium (supplemented with 349
10% FCS) into each well of a 96-well U-bottom microtiter plate (3635 Corning Life 350
Sciences, Tewksbury, MA, USA). Samples for intracellular staining were treated by 351
2% paraformaldehyde (158127 Sigma-Aldrich). Hybridoma supernatants (50 µl) were 352
measured to each well, and reacted at 4 °C for 45 min. The negative control 353
monoclonal antibody was a mouse IgG1 (clone T2/48, anti-human anti-CD45) [40].
354
After the incubation, cells were washed three times with ice-cold Schneider’s 355
medium. The secondary antibody, Alexa Fluor 488-labeled anti-mouse IgG 356
(AP124JA4 Sigma-Aldrich) was added (1:1000). After 45 min incubation at 4 °C, the 357
cells were washed (three times) with ice-cold Schneider’s medium and acquired on 358
FACSCalibur (Beckton Dickinson, Franklin Lakes, NJ, USA).
359
Mass cytometry 360
Mass cytometry was performed as we published earlier with some modifications [10, 361
41]. The affinity purified monoclonal antibodies were provided by Istvan Ando’s 362
group (BRC, Szeged, Hungary) (Table 1) or purchased: anti-IgM, (406527 Biolegend, 363
San Diego, CA, USA [42]), anti-GFP (A11122 Thermo Fisher Scientific [43]), 364
anti-CD45 (3089003B Fluidigm, South San Francisco, CA, USA [44]) and conjugated 365
in house according to the instructions of the manufacturer (Maxpar antibody labeling 366
kit, Fluidigm). Optimal antibody concentrations were titrated prior use (Figure S5).
367
The following antibody concentrations were used: H2: 5 µg/ml, H3: 5 µg/ml, H18: 5 368
µg/ml, L1: 1 µg/ml, L2: 7.5 µg/ml, L4: 7.5 µg/ml, L6: 10 µg/ml, anti-IgM: 10 µg/ml, 369
P1: 7.5 µg/ml, 3A5: 5 µg/ml, anti-GFP: 10 µg/ml. The negative control monoclonal 370
antibody was a mouse IgG1 (clone Hl30, anti-human 89Y labeled anti-CD45) in 371
1:100 dilution. The isotypes of anti-Drosophila antibodies were determined by the 372
IsoStrip™ Antibody Isotyping Kit (11493027001 Roche, Basel, Switzerland) 373
according to the instructions of the manufacturer.
374
Single cell suspensions were centrifugated at 1100 g at 6 °C for 4 min and incubated 375
with viability marker (5 µM cisplatin, 195 Pt, 201064 Fluidigm) on ice in 40 µl PBS 376
for 3 min. Cells were washed twice with 200 µl Maxpar Cell Staining Buffer (MCSB, 377
201068 Fluidigm) and centrifugated at 1100 g at 6°C for 4 min. Cells were 378
resuspended in 50 µl MCSB and 50 µl surface antibody cocktail (2 ×) was added, 379
incubated on ice for 30 min. Cells were washed with 200 µl MCSB and stained with 380
anti-IgM antibody (volumes were the same as in the surface staining), incubated on 381
ice for 30 min. Cells were washed with 200 µl MCSB and suspended in 100 µl 1 × 382
Maxpar Fix I buffer (201065 Fluidigm), incubated on ice for 20 min. Cells were 383
washed twice with 200 µl PermS buffer (201066 Fluidigm) then stained with the 384
intracellular antibody cocktail (L2, 3A5 and anti-GFP in Lz>GFP samples), left on 385
ice for 30 min. Cells were washed once with MCSB then fixed with 200 µl 1.6%
386
formaldehyde solution (freshly diluted from 16% Pierce formaldehyde in PBS, 28906 387
Thermo Fisher Scientific), incubated on ice for 10 minutes then centrifugated at 1300 388
g at 6°C for 4 min. After fixation, cells were resuspended in 300 µl Maxpar Fix and 389
Perm buffer (201067 Fluidigm) containing 125 nM Cell-ID DNA intercalator 390
(191/193 Iridium, 201192A Fluidigm) and incubated at 4 °C overnight. Before the 391
acquisition samples were washed in MCSB twice and in PBS once (without Mg2+ and 392
Ca2+, 10010015 Thermo Fisher Scientific) by centrifugation at 1300 g at 6°C for 4 393
min. Cells were counted using Bürker chamber. For the measurement on Helios, the 394
concentration of cells was set to 0.5 × 10⁶/ml in cell acquisition solution (CAS, 395
201240 Fluidigm) supplemented with 10% EQ Calibration Beads (201078 Fluidigm).
396
Cells were filtered (30 µm, 04-0042-2316 Celltrics, Sysmex Partec, Görlitz, 397
Germany) prior to acquisition. Samples were run on CyTOF (cytometry by 398
time-of-flight) Helios (Fluidigm). Bead based normalization of CyTOF cytofdata was 399
performed. After randomization, normalization and FCS file generation the files were 400
further analyzed in Cytobank (Beckman Coulter, Brea, CA, USA). Analysis of the 401
cells was carried out on live singlets within the pan-hemocyte marker, H2 positive 402
population. The viSNE (visualization of stochastic neighbour embedding) analysis 403
was carried out on 3 × 10⁴ cisplatin negative (live) singlets with the following 404
settings: iterations = 1000, perplexity = 30, theta = 0.5).
405
Authors’ contributions
406JAB carried out the mass cytometric experiments, analysis and visualization 407
VH participated in Drosophila work, drafted the manuscript and supervised the 408
analysis 409
EK produced and affinity purified the antibodies, carried out flow cytometric 410
experiments, prepared graphs and supervised the analysis, and revised the manuscript 411
LGP supervised the study and revised the manuscript 412
IA provided the antibodies, supervised the study, and revised the manuscript 413
GJS designed and supervised the study, designed the experiments and analysis, 414
prepared the figures, drafted the manuscript.
415
The authors read and approved the final version of the manuscript.
416
Competing interests
417The authors have declared no competing interests.
418
Acknowledgements
419This work was supported by the following grants: GINOP-2.3.2-15-2016-00001, 420
GINOP-2.3.2-15-2016-00030 (LGP), GINOP-2.3.2-15-2016-00035 (ÉK), and NKFI 421
NN118207 and NKFI K120142 (IA), NKFI 120140 (EK), OTKA K-131484 (VH) by 422
the National Research, Development and Innovation Office. Gábor J. Szebeni was 423
supported by the New National Excellence Program of the Ministry for Innovation 424
and Technology (UNKP-19-4-SZTE-36) and by the János Bolyai Research 425
Scholarship of the Hungarian Academy of Sciences (BO/00139/17/8). We are grateful 426
to Mrs. Olga Kovalcsik for the technical help.
427 428
ORCID: 0000-0001-8208-9157 (Balog JA) 429
ORCID: 0000-0001-7418-3653 (Honti V) 430
ORCID: 0000-0002-9386-2798 (Kurucz E) 431
ORCID: 0000-0002-4377-6824(Kari B) 432
ORCID: 0000-0003-0271-3517 (Puskas LG) 433
ORCID: 0000-0002-4648-9396 (Ando I) 434
ORCID: 0000-0002-6998-5632 (Szebeni GJ) 435
436
References
437[1] Kim-Jo C, Gatti JL, Poirie M. Drosophila Cellular Immunity Against Parasitoid 438
Wasps: A Complex and Time-Dependent Process. Front Physiol 2019;10:603.
439
[2] Troha K, Buchon N. Methods for the study of innate immunity in Drosophila 440
melanogaster. Wiley Interdiscip Rev Dev Biol 2019;8:e344.
441
[3] Imler JL, Bulet P. Antimicrobial peptides in Drosophila: structures, activities and 442
gene regulation. Chem Immunol Allergy 2005;86:1−21.
443
[4] Williams MJ. Drosophila hemopoiesis and cellular immunity. J Immunol 444
2007;178:4711-6.
445
[5] Loch G, Zinke I, Mori T, Carrera P, Schroer J, Takeyama H, et al. Antimicrobial 446
peptides extend lifespan in Drosophila. PLoS One 2017;12:e0176689.
447
[6] Kenmoku H, Hori A, Kuraishi T, Kurata S. A novel mode of induction of the 448
humoral innate immune response in Drosophila larvae. Dis Model Mech 449
2017;10:271−81.
450
[7] Evans CJ, Liu T, Banerjee U. Drosophila hematopoiesis: Markers and methods for 451
molecular genetic analysis. Methods 2014;68:242−51.
452
[8] Goto A, Kadowaki T, Kitagawa Y. Drosophila hemolectin gene is expressed in 453
embryonic and larval hemocytes and its knock down causes bleeding defects. Dev 454
Biol 2003;264:582−91.
455
[9] Tokusumi T, Shoue DA, Tokusumi Y, Stoller JR, Schulz RA. New 456
hemocyte-specific enhancer-reporter transgenes for the analysis of hematopoiesis in 457
Drosophila. Genesis 2009;47:771−4.
458
[10] Alfoldi R, Balog JA, Farago N, Halmai M, Kotogany E, Neuperger P, et al.
459
Single Cell Mass Cytometry of Non-Small Cell Lung Cancer Cells Reveals 460
Complexity of In vivo And Three-Dimensional Models over the Petri-dish. Cells 461
2019;8.
462
[11] Bandyopadhyay S, Fowles JS, Yu L, Fisher DAC, Oh ST. Identification of 463
functionally primitive and immunophenotypically distinct subpopulations in 464
secondary acute myeloid leukemia by mass cytometry. Cytometry B Clin Cytom 465
2019;96:46−56.
466
[12] Kurucz E, Zettervall CJ, Sinka R, Vilmos P, Pivarcsi A, Ekengren S, et al.
467
Hemese, a hemocyte-specific transmembrane protein, affects the cellular immune 468
response in Drosophila. Proc Natl Acad Sci U S A 2003;100:2622−7.
469
[13] Kurucz E, Markus R, Zsamboki J, Folkl-Medzihradszky K, Darula Z, Vilmos P, 470
et al. Nimrod, a putative phagocytosis receptor with EGF repeats in Drosophila 471
plasmatocytes. Curr Biol 2007;17:649−54.
472
[14] Kurucz E, Vaczi B, Markus R, Laurinyecz B, Vilmos P, Zsamboki J, et al.
473
Definition of Drosophila hemocyte subsets by cell-type specific antigens. Acta Biol 474
Hung 2007;58 Suppl:95−111.
475
[15] Honti V, Kurucz E, Csordas G, Laurinyecz B, Markus R, Ando I. In vivo 476
detection of lamellocytes in Drosophila melanogaster. Immunol Lett 2009;126:83−4.
477
[16] Anderl I, Vesala L, Ihalainen TO, Vanha-Aho LM, Ando I, Ramet M, et al.
478
Transdifferentiation and Proliferation in Two Distinct Hemocyte Lineages in 479
Drosophila melanogaster Larvae after Wasp Infection. PLoS Pathog 480
2016;12:e1005746.
481
[17] Honti V, Csordas G, Kurucz E, Markus R, Ando I. The cell-mediated immunity 482
of Drosophila melanogaster: hemocyte lineages, immune compartments, 483
microanatomy and regulation. Dev Comp Immunol 2014;42:47−56.
484
[18] Nappi AJ, Vass E, Frey F, Carton Y. Superoxide anion generation in Drosophila 485
during melanotic encapsulation of parasites. Eur J Cell Biol 1995;68:450−6.
486
[19] Russo J, Dupas S, Frey F, Carton Y, Brehelin M. Insect immunity: early events 487
in the encapsulation process of parasitoid (Leptopilina boulardi) eggs in resistant and 488
susceptible strains of Drosophila. Parasitology 1996;112 ( Pt 1):135−42.
489
[20] Lanot R, Zachary D, Holder F, Meister M. Postembryonic hematopoiesis in 490
Drosophila. Dev Biol 2001;230:243−57.
491
[21] Melcarne C, Ramond E, Dudzic J, Bretscher AJ, Kurucz E, Ando I, et al. Two 492
Nimrod receptors, NimC1 and Eater, synergistically contribute to bacterial 493
phagocytosis in Drosophila melanogaster. FEBS J 2019;286:2670−91.
494
[22] Avet-Rochex A, Boyer K, Polesello C, Gobert V, Osman D, Roch F, et al. An in 495
vivo RNA interference screen identifies gene networks controlling Drosophila 496
melanogaster blood cell homeostasis. BMC Dev Biol 2010;10:65.
497
[23] Honti V, Csordas G, Markus R, Kurucz E, Jankovics F, Ando I. Cell lineage 498
tracing reveals the plasticity of the hemocyte lineages and of the hematopoietic 499
compartments in Drosophila melanogaster. Mol Immunol 2010;47:1997−2004.
500
[24] Stofanko M, Kwon SY, Badenhorst P. Lineage tracing of lamellocytes 501
demonstrates Drosophila macrophage plasticity. PLoS One 2010;5:e14051.
502
[25] Kroeger PT, Jr., Tokusumi T, Schulz RA. Transcriptional regulation of eater 503
gene expression in Drosophila blood cells. Genesis 2012;50:41−9.
504
[26] Mirzoyan Z, Sollazzo M, Allocca M, Valenza AM, Grifoni D, Bellosta P.
505
Drosophila melanogaster: A Model Organism to Study Cancer. Front Genet 506
2019;10:51.
507
[27] Harrison DA, Binari R, Nahreini TS, Gilman M, Perrimon N. Activation of a 508
Drosophila Janus kinase (JAK) causes hematopoietic neoplasia and developmental 509
defects. EMBO J 1995;14:2857−65.
510
[28] Konrad L, Becker G, Schmidt A, Klockner T, Kaufer-Stillger G, Dreschers S, et 511
al. Cloning, structure, cellular localization, and possible function of the tumor 512
suppressor gene lethal(3)malignant blood neoplasm-1 of Drosophila melanogaster.
513
Dev Biol 1994;163:98−111.
514
[29] Weaver TA, White RA. headcase, an imaginal specific gene required for adult 515
morphogenesis in Drosophila melanogaster. Development 1995;121:4149−60.
516
[30] Varga GIB, Csordas G, Cinege G, Jankovics F, Sinka R, Kurucz E, et al.
517
Headcase is a Repressor of Lamellocyte Fate in Drosophila melanogaster. Genes 518
(Basel) 2019;10.
519
[31] Ferreiro MJ, Perez C, Marchesano M, Ruiz S, Caputi A, Aguilera P, et al.
520
Drosophila melanogaster White Mutant w(1118) Undergo Retinal Degeneration.
521
Front Neurosci 2017;11:732.
522
[32] Binggeli O, Neyen C, Poidevin M, Lemaitre B. Prophenoloxidase activation is 523
required for survival to microbial infections in Drosophila. PLoS Pathog 524
2014;10:e1004067.
525
[33] Lebestky T, Chang T, Hartenstein V, Banerjee U. Specification of Drosophila 526
hematopoietic lineage by conserved transcription factors. Science 2000;288:146−9.
527
[34] Amir el AD, Davis KL, Tadmor MD, Simonds EF, Levine JH, Bendall SC, et al.
528
viSNE enables visualization of high dimensional single-cell data and reveals 529
phenotypic heterogeneity of leukemia. Nat Biotechnol 2013;31:545−52.
530
[35] Cho B, Yoon S-H, Lee D, Koranteng F, Tattikota SG, Cha N, et al. Single-cell 531
transcriptome maps of myeloid blood cell lineages in <em>Drosophila</em>.
532
bioRxiv 2020:2020.01.15.908350.
533
[36] Merkling SH, Lambrechts L. Taking Insect Immunity to the Single-Cell Level.
534
Trends Immunol 2020;41:190−9.
535
[37] Cattenoz PB, Sakr R, Pavlidaki A, Delaporte C, Riba A, Molina N, et al.
536
Temporal specificity and heterogeneity of Drosophila immune cells. EMBO J 537
2020:e104486.
538
[38] Tattikota SG, Cho B, Liu Y, Hu Y, Barrera V, Steinbaugh MJ, et al. A single-cell 539
survey of Drosophila blood. Elife 2020;9.
540
[39] Kohler G, Milstein C. Derivation of specific antibody-producing tissue culture 541
and tumor lines by cell fusion. Eur J Immunol 1976;6:511−9.
542
[40] Oravecz T, Monostori E, Kurucz E, Takacs L, Ando I. Cd3-Induced T-Cell 543
Proliferation and Interleukin-2 Secretion Is Modulated by the Cd45 Antigen.
544
Scandinavian Journal of Immunology 1991;34:531−7.
545
[41] Balog JA, Hackler L, Jr., Kovacs AK, Neuperger P, Alfoldi R, Nagy LI, et al.
546
Single Cell Mass Cytometry Revealed the Immunomodulatory Effect of Cisplatin Via 547
Downregulation of Splenic CD44+, IL-17A+ MDSCs and Promotion of Circulating 548
IFN-gamma+ Myeloid Cells in the 4T1 Metastatic Breast Cancer Model. Int J Mol 549
Sci 2019;21.
550
[42] Tertilt C, Joh J, Krause A, Chou P, Schneeweiss K, Crystal RG, et al. Expression 551
of B-cell activating factor enhances protective immunity of a vaccine against 552
Pseudomonas aeruginosa. Infect Immun 2009;77:3044−55.
553
[43] Kallert SM, Darbre S, Bonilla WV, Kreutzfeldt M, Page N, Muller P, et al.
554
Replicating viral vector platform exploits alarmin signals for potent CD8(+) T 555
cell-mediated tumour immunotherapy. Nat Commun 2017;8:15327.
556
[44] Papo M, Corneau A, Cohen-Aubart F, Robin B, Emile JF, Miyara M, et al.
557
Immune phenotyping of Erdheim-Chester disease through mass cytometry highlights 558
decreased proportion of non-classical monocytes and increased proportion of Th17 559
cells. Ann Rheum Dis 2020.
560 561
Figure legends
562Figure 1 Single cell mass cytometry revealed the expansion of hemocytes in 563
hopTum and l(3)mbn1 564
(A) The percentage of H3, H18, L1, L2, L4, L6, P1, and 3A5 cells were plotted on 565
radar plots for Drosophila mutants on Ore-R or w1118 background. (B) Comparative 566
heatmap of mass cytometry data (arcsinh-transformed median intensity values) 567
regarding marker density at single cell resolution show increased expression of H18, 568
L1, L2, L4 markers in the mutant hopTum and l(3)mbn1 in relation to control, the wild 569
type Ore-R. Analysis was performed within the H2 (Hemese) positive live singlets.
570 571
Figure 2 Multidimensional comparative analysis by the tSNE algorithm 572
dissects the cell relatedness of 5 different Drosophila strains, namely Ore-R, w1118, 573
l(3)mbn1, hopTum and hdcΔ84 574
The wild type Ore-R and white mutant w1118 (genetic backgrounds) are overlapping 575
while both tumorous strains l(3)mbn1and hopTum represent H18, L1, L2, L4 expansion.
576
The tSNE analysis of H3, H18, L1, L2, L4, L6, P1, and 3A5 markers was carried out 577
within the population of pan-hemocyte H2 (Hemese) positive live singlets and 578
visualised as viSNE plots. Subpopulations of cells with common marker expression 579
patterns are grouped close in the multidimensional space, while cells with different 580
marker expression are plotted separately. Coloration is proportional with the intensity 581
of the expression of a given marker: the hotter the plot, the higher the level of 582
expression (red plots). Red boxes mark transitional phenotypes expressing both 583
lamellocyte (L2 or L4) and plasmatocyte (P1) markers.
584 585
Figure 3 Merging viSNE graphs (based on H3, H18, L1, L2, L4, L6, P1, and 586
3A5 marker expression within the pan-hemocyte H2 (Hemese) positive live 587
singlets) outlines characteristic maps of each strain (green = Ore-R, blue = w1118, 588
red = l(3)mbn1, lilac = hopTum, yellow = hdcΔ84) based on high parametric mass 589
cytometry data 590
(A) The viSNE comparison of l(3)mbn1 and its wt counterpart, the Ore-R. (B) The 591
viSNE comparison of w1118, hopTum, and hdcΔ84. (C) The viSNE islands of the control 592
cells (Ore-R and w1118) localize separately from the tumorous l(3)mbn1 and hopTum 593
hemocytes while hdcΔ84 represents a transition phenotype.
594 595
Figure 4 Immune activation was monitored successfully by infestation with the 596
Leptopilina boulardi parasitoid wasp of the lozenge>GFP strain 597
(A) viSNE analysis of naive (lz>GFP) and immune induced (lz>GFP i.i.) Drosophila 598
larvae. The tSNE analysis of H3, H18, L1, L2, L4, L6, P1, 3A5 markers and anti-GFP 599
(marking crystal cells in this particular system) was carried out within the population 600
of pan-hemocyte H2 (Hemese) positive live singlets. Red boxes mark a 601
subpopulation, the transitional phenotype of hemocytes expressing both lamellocyte 602
(L4+) and plasmatocyte (P1) markers upon immune induction. (B) The percentage of 603
H3, H18, L1, L2, L4, L6, P1, anti-GFP (crystal cells), and 3A5 positive cells. (C) The 604
heatmap of the (arcsinh-transformed) median values shows the expression changes of 605
the hemocyte marker expression upon immune induction. Analysis was performed 606
within the pan-hemocyte marker H2 (Hemese) positive live singlets.
607 608 609