New Experimental Method for Measuring Power Characteristics of Photovoltaic Cells at Given
Light Irradiation
A.Varga,*, E. Rácz** and P. Kádár**
* Óbuda University, Doctoral School of Applied Informatics, Budapest, Hungary
** Óbuda University, Kandó Kálmán Faculty of Electrical Engineering / Power System Department, Budapest, Hungary varga.andrea@kvk.uni-obuda.hu, racz.ervin@kvk.uni-obuda.hu, kadar.peter@kvk.uni-obuda.hu
Abstract—U-I characteristics – or electric power – as function of electrical voltage or current – of a solar panel (PV cell or panel) gives important information for developers, engineers and users. From this reason to get U-I plot or characterization of the electric power of a solar panel plays important role at the tests. In this paper a new and easy experimental method for U-I measurement (indirectly measured electric power data) for PV cells will be introduced. The new idea describes a simple, fast and reliable way how to get U-I characteristics – or power properties – of PV cells in a laboratory at a university using basic experimental tools.
I. INTRODUCTION
Solar cells or using the other name for it photovoltaic cells (PV cells) were invented by Antoine Becquerel in the 19th century. According to the records in 1839, when Becquerel was 19 years old, he built the first PV cell on the Earth. Later in 1873 Willoughby Smith published a paper in the Nature about the electric current generation of photovoltaic cells. The real first practical photovoltaic cell was developed at Bell Laboratories (Bell Labs) in the USA in 1954. Between 1954 and 1960 the efficiency of the PV cells were improved with one order of magnitude.
This step was a significant point or milestone in the development of solar cells. In the second half of the 20th century improvement of the PV cells became fast. Now developments of the solar panels go ahead in huge steps.
Nowadays, we reached the point where almost every people can use solar cells to generate electricity for their purpose.
In the 21st century developers and scientists work on PV panel investigation focusing their knowledge on improvement of physical parameters of the cells. From the user side one of the most important physical or technical parameter of the PV cell is the efficiency of the panel. In this case efficiency means the electrical power efficiency, in other words: how many percentage of the light power of the incoming radiated light can be transferred to electrical power? Answer the question or improving the percentage rate is the goal of many developments. In order to work on the problem mentioned above knowing the electrical power function at different loads is a crucial factor. Sometimes knowing the electrical power at the output of the PV panel may go
back to know or measure the electrical current and voltage at the same position, because using the two values the power can be calculated from the simple multiplication. So, measuring electrical current and voltage are important at investigation of solar panels.
To specify the optimum value of the operating point the maximum power output of the PV panel has to be determined at given and constant irradiation. This paper introduces a smart and simple idea how to get fast electrical voltage and current characteristics and as consequences of it: how to get electrical power characteristics for five different photovoltaic panels using given constant irradiation parameters. The irradiation was monitored by a spectroradiometer device. The idea uses relatively basic devices can be found at a laboratory at a university specified its research on electrical systems.
II. EXPERIMENT FOR MEASURING U-I CHARACTERISTICS OF PV PANELS A. Older Method
One of the most general specific functions for description of a PV cell is the U-I (voltage-current) characteristics what belongs to given light irradiation. In order to measure the U-I characteristics of a PV panel two main types of experiments can be run. Hand-made or in other words manually performed experiments belong to the first group. Second type of experiments holds automatic experiments. Basically, manually performed experiments have been made by researchers and automatic experiments can be assigned to industrial companies. In the last case manufacturers can made above mentioned measurements using luminous light effects of artificial light sources during manufacturing the PV cells. This measurement takes only less than one minute.
In our laboratories at our universities we are not able to run industrial type investigations, therefore manually performed experiments were planned and run earlier.
After building an experimental arrangement especially set up for the measurement scientist read the signs from voltage and current meters and wrote up the data in his/her notebook by handwriting. In the phase of data evaluation the given person made U-I plots based on the handwritten experimental data. The outputs of the PV cells were closed by different resistances. This way we were able to save our data at some measurement positions (saving U-I
data pairs), but the number of measurement positions were limited and not enough to make continuous plots and to take precise conclusions. Other problem was: during the relatively slow measurement the natural irradiation of the PV cells could change. It meant that when for example a cloud blocked the clean sunlight generating cloudy weather instead of nice sunny minutes. With changing irradiances the data were not comparable to each other.
The above mentioned measurement method was working before, but running this type of measurements went slowly and data saving included possibility to take mistakes (i.e.
misreading, mistyping). As it well known, a mistake can easily generate more mistakes or errors, so at the end of the analyzing data problems may be summarized and it can introduce instabilities at taking conclusions or making summaries.
B. Newer Method
In order to decrease the possibility to make mistakes and to run experiments faster, we tried to automatize the measurements. Taking constant most of the experimental parameters a new measurement method has been worked out. Using the new method changing the resistances at the end of the PV tables can be occurred during a very short time.
The experimental arrangement based on the new idea is shown on Figure 1. at the top and bottom side.
Figure 1.: Scheme of the experimental arrangement (figure on the upper side). Schematics of the measurements setup with the variable resistance and storage digital oscilloscope (figure on the bottom).
Base of the idea was the following: modification of the resistances (loads) was made using variable resistor (sliding resistance). Our resistance was variable between 0 and 570 ohms with maximum electric current of 1A.
Different loads have been generated by sliding the arm of the resistance with relatively fast and very uniform
motion. Value of the velocity of the movement was approximately 0.2 m/s specified by empirical way. During the experiment – sliding the arm of the variable resistor – both the voltage and current fell and flow on the PV cell were saved using a data storage digital oscilloscope. For this purpose a Tektronix TDX 210 digital oscilloscope was used. The electrical currents fell on the PV cell were measured indirectly. It means that instead of currents voltages were measured and saved directly using a shunt resistance of 1 ohm in the electrical circuit. This way, using the shunt resistance, we were able to go back to voltage measurement instead of measuring the electric current directly. Running the new type of experiment we found many advantages: (1) the oscilloscope could save our data during less than one second automatically and therefore we did not need to write down any data by hand.
(2) This way we were able to save numerous data points at numerous measurement positions. During the fast measurement we could save 2500 data point pairs more precisely. Comparing this value earlier in our old experiment we could write down less than 50 data pairs only during a relatively longer time (several minutes). (3) Quantity of the data also increased highly. Using the new method saving precision of the data has been highly improved (automatic data saving process opposed to manual process). Oscilloscope gave us the data in tabular form as a .cvs file format. This file format can easily be analyzed by plotting programs. For studying the measurement setup see the bottom part on Figure 1. [1]
C. Experimental Arrangement
One part of the experimental arrangement was installed at the roof top of the university building. PV panels (drawn on the upper part of Figure 1.) were placed on the roof. The mechanical holder for PV panels is called as adjustable measurement stand. The holder is a rotating and tilting mechanical stand which is able to hold, rotate and tilt five types of PV cell tables same time using remote control box. Rotation around the vertical axis is possible in 360°. This way to set any directionality of the solar panels became possible. Other adjustable degree of freedom of the holder is the tilt around a horizontal axis.
The minimum azimuthal angle is approximately 30° and the maximum is around 90° measured relative to the horizontal roof top plate. Using the mechanical pad the PV panels can be moved to any positions what the user or investigator needs.
2.a.
2.b. 2.c.
Figure 2.: Photos showing the measurement place designed for
Outlets for electrical signals of the PV tables are positioned in inner laboratory using cable connections.
For each PV panel a user friendly measurement place was designed and built on the laboratory wall.
The measurement places give output voltage signals of the PVs through special inverters for the users. This way the user easily can connect his/her meters and can measure the voltage data. Figure 2.a., b., and c. present photos from the building roof top and the inner laboratory showing the adjustable mechanical stand with the five types of PV tables (2.a.), and the measurement places with inverters and voltage outlets (2.b., 2.c.), respectively.
Five types of PV cells were used for the experiments.
The PV cells were got from the companies mentioned below [2], [3]:
(A) SANYO HIP (B) KORAX (C) RENESOLA (D) UPSOLAR (E) FLEXCELL
During the measurement all five solar panels were facing to the same direction. Giving better definition for the directionality: they were set especially facing to south and their azimuthal angles were also set to same value of ~30°
measured relative to the horizontal plane.
Measurement results will be discussed in the next chapter.
III. RESULTS
Using the new methods described in chapter II. the following results are presented:
A. Electric Voltage and Current Characteristics of the Solar Panels
After building the experimental setup and sliding the arm of the variable resistance the voltage signals were projected and saved by the storage digital oscilloscope.
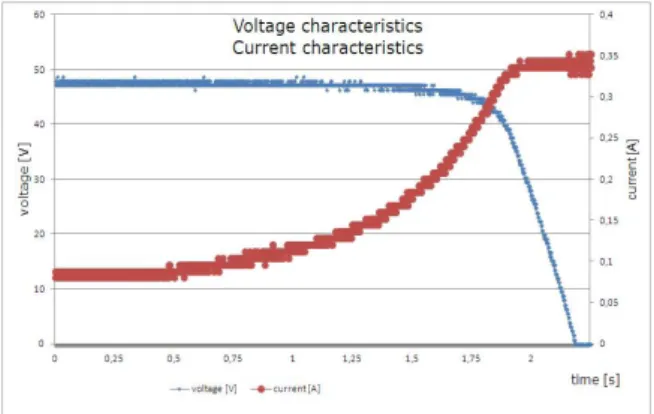
Finishing the fast experiment – or other words after two seconds – the oscilloscope promptly projects the plots showed on Figure 3. On Figure 3. the blue curve describes the voltage and the red curve can be corresponded to the electric current because 1 ohm of shunt resistance was used for current measurement.
Figure 3.: U and I curves of the SANYO HIP type solar panel. Red curve shows the electrical current and blue plot shows the voltage fell on
the PV panel in function of the time sliding the arm of the variable resistor.
Both plots are represented in function of the sliding time of the arm of the variable resistance. Figure 3. represents a traditional U and I plots of a PV cell. Using the row data saved by the oscilloscope another plots – for example U-I plots or I(U) function – can be easily prepared by a plotter software. In our case Microsoft Excel was used to get the plots.
Figure 4. shows the measured I(U) characteristics for the SANYO HIP type solar panel. Plotted measurement points placed very close to each other are due to the operation (saving) and readout properties of the oscilloscope. Due to this issue the overplotted black solid line shows the real shape of the measurement curve.
Figure 4.: U-I or I(U) characteristics for the SANYO HIP type solar panel.
Figure 4. presents the saturated electric current of
~0.34A between 0V and ~35V. In this range the PV panel works in current generator mode. At ~35V a fast current breakdown will be observed where the value of the electric current fells down from 0.34 A to less than 0.1A.
In the last part of the breakdown the voltage is going to be almost constant representing that the PV panel works as voltage generator in this region. Other solar panels showed similar but not same characteristics (see in the oral presentation), so getting the I(U) functions separately on the five solar cells was possible.
B. Electric Power Plot and Optimal Load of the Solar Panels
Going further at analyzing the data knowing the U-I data pairs at given measurement points (at given resistance values) electric power at the outlets of the solar panel can be calculated. The calculated values of the electric power for example in function of the actual load can be plotted. Figure 5. shows the electric power plot in function of the actual load or resistance. The form of the measured power function curve is very similar to the electric power curve in function of resistance graphs given by the manufacturers. The measured and manufacturer given plots were compared to each other and the similarity is easily can be observed.
Figure 5.: Electric power (P – green curve) calculated at the outlets of the PV in function of the actual sliding resistance position for the
SANYO HIP type solar panel.
Maximum of the electric power can be easily read from Figure 5 taking into consider the overplotted vertical line.
In our case the maximum of the power was about 13W reached at the time of ~1.85s (not shown on the figure). At 1.85s the voltage reached the value of 42-43V. The electrical current at the outlet belongs to this position were
~0.32-0.33A. Taking the look at the Figure 5 the optimal resistance – where the output electrical power is the maximum – is ~130 ohms. It meant that in our case the maximum electrical power was available at ~130 ohms of resistance or load value. This is the optimum load where the useful power shows maximum using our experimental devices.
Showing our main results all in one Figure 6. was generated. Figure 6. shows the represented electric current (red curve), the voltage (blue curve) and the output power (green curve) in function of the actual load in ohms.
Important working points or positions are easily comparable.
Figure 6.: The most important measured functions such as current (red), voltage (blue) and power (green) plots in function of the resistance
variable during the run for the SANYO HIP type solar panel.
C. Irradiation Measurements and Results for Electrical Characterization of the Solar Panels
In order to know the operation of the solar panels and in order to investigate the operation of the PV cells at actual weather or natural irradiation conditions the spectrum of the irradiated natural light for the solar panels was measured. It can be suspected that the operation of the solar cells or in other words the possible maximum or optimal electrical power output of the solar panels is
highly depends on the spectrum of the irradiated light source. It is almost sure that the electrical power outputs for the same PV panel are completely different in sunny weather, in cloudy and at rainy weather conditions.
To measure the spectrum of the incoming natural light a spectroradiometer system (Apogee PS100 cosine corrected head with StellarNet Inc. spectroradiometer) was used. The spectrometer has three main parts: a light sensitive detector head, electronics, and computer software. The detector head is a photodiode with 16bits resolution in count values. Photons of the incoming and detected light can be transferred to electrical signals using the 16bits resolution by the electronics. The electronics can be connected to the personal desktop computer or laptop by USB connector. Using the special software for example the photon counts spectrum or irradiation spectrum can be plotted in function of the wavelength of the incoming light.
Figure 7.: Set up of the StellarNet – Apogee spectroradiometer system used for measuring the spectrum of the incoming natural light. [4]
The typical recorded spectrum is shown on Figure 8.
On the day when the experiments were made the weather showed the following conditions: it was a day in winter time with temperature values close to zero °C and the sky was cloudy or overcast. Dense clouds were blocked the natural sunshine from the solar panels. In other words, the solar panels were irradiated by scattered natural light without sunshine.
Figure 8.: Typical recorded spectrum of the natural light irradiated the solar panels during the measurement.
Figure 8. represents the typical spectral curve for the day when the experiments were run. Analyzing Figure 8.
typical absorption spectral edges of the natural light can be observed (see the relatively strong or intense spectral edges at about 690nm and 760nm). The irradiation plot on Figure 8. also projects one more important parameter: the infrared components (right side of the spectrum at the
longer wavelengths) of the natural light is completely missing from the spectrum. This fact also indicates that the clear sunshine was missed from the light on the day we ran our experiments. Natural sunshine is reach in infrared components which would be equivalent with higher counts at the longer wavelengths.
IV. SUMMARY
This paper introduced a new experimental method to get I(U) U-I characteristics of one or more PV panels faster than our group did it before. The presented idea ensures possibility to record thousands of data pairs relatively easily and fast keeping the data saving process reliable. This way the data can be analyzed easily. The method is shown by measuring U-I characteristics and plotting electrical power characteristics for one PV panel (SANYO HIP). Using the method the optimal load relative to the optimum power output at the outlets of the PV was easily calculated and presented. Parallel with the SANYO panel other four solar cell panels were also investigated. The oral presentation of our group will show the results from other PV cells.
ACKNOWLEDGMENT
Authors say special thank you very much for our Colleagues Attila Barlangi, László Berke and Imre Fejes, who helped the authors preparing the experiments. The authors gratefully acknowledge the grant provided by the project TÁMOP-4.2.2/B-10/1-2010-0020, support of the scientific training, workshops and establish talent management system at the Óbuda University.
REFERENCES
[1] P. Kádár, , A. Varga, “ Measurement of spectral sensitivity of PV cells”, Intelligent Systems and Informatics (SISY), 2012 IEEE 10th Jubilee International Symposium Subotica, Serbia, pp. 549 – 552, Sept 20-22, 2012
[2] Panasonic-HIP-214NKHE5 datasheet containing SANYO HIP- 215NKHE5 and HIP-214NKHE5 solar cell parameters given by the manufacturer, www.sanyo-solar.eu
[3] KORAX KS-240P datasheet containing data for KORAX solar cells, www. koraxsolar.com
[4] StellarNet Apogee spectroradiometer users manual, www.stellarnet-inc.com
[5] Ehojla: Tiberiu Tudorache, Liviu Kreindler Design of a Solar Tracker System for PV Power Plants, Acta Polytechnica Hungarica Volume 7, Issue Number 1, 2010
[6] Fatima Zohra Zerhouni, M’hamed Houari Zerhouni, Mansour Zegrar, M. Tarik Benmessaoud, Amine Boudghene Stambouli, Abdelhamid Midoun Proposed Methods to Increase the Output Efficiency of a Photovoltaic (PV) System, Acta Polytechnica Hungarica Volume 7, Issue Number 2, 2010