MŰHELYTANULMÁNYOK DISCUSSION PAPERS
INSTITUTE OF ECONOMICS, CENTRE FOR ECONOMIC AND REGIONAL STUDIES, HUNGARIAN ACADEMY OF SCIENCES BUDAPEST, 2015
MT-DP – 2015/54
Various approaches to measuring business innovation:
their relevance for capturing social innovation
ATTILA HAVAS
2
Discussion papers MT-DP – 2015/54
Institute of Economics, Centre for Economic and Regional Studies, Hungarian Academy of Sciences
KTI/IE Discussion Papers are circulated to promote discussion and provoque comments.
Any references to discussion papers should clearly state that the paper is preliminary.
Materials published in this series may subject to further publication.
Various approaches to measuring business innovation:
their relevance for capturing social innovation
Author:
Attila Havas senior research fellow
Institute of Economics - Centre for Economic and Regional Studies Hungarian Academy of Sciences
e-mail: havas.attila@krtk.mta.hu
November 2015
ISBN 978-615-5594-22-9 ISSN 1785 377X
Various approaches to measuring business innovation:
their relevance for capturing social innovation Attila Havas
Abstract
This paper reviews various approaches to measuring business innovation from the angle of capturing social innovations and offers several methodological and policy conclusions. First, the Innovation Union Scoreboard (IUS) indicators in principle could be useful in settings where the dominant mode of innovation is based on R&D activities. In practice, however, both R&D and non-R&D-based modes of innovation are fairly important. IUS, therefore, only provides a partial picture. Social innovations can certainly rely on R&D-based technological innovations. Their essence, however, tends to be organisational, managerial and behavioural changes. The IUS indicators do not capture these types of changes. Second, an assessment of the 81 indicators used to compile the Global Innovation Index reveals that it would neither be a fruitful effort to rely on those indicators to capture social innovations.
Third, given the diversity among innovation systems, a poor performance signalled by a composite indicator does not automatically identify the area(s) necessitating the most urgent policy actions. Only tailored, thorough comparative analyses can do so. Fourth, analysts and policy-makers need to be aware of the differences between measuring (i) social innovation activities (efforts) themselves, (ii) the framework conditions (pre-requisites, available inputs, skills, norms, values, behavioural patterns, etc.) of being socially innovative, and (iii) the economic, societal or environmental impacts of social innovations.
Keywords: Evolutionary economics of innovation; Business innovation; Social innovation; Measurement of innovation; Composite indicators; Scoreboards, league tables;
Unit of analysis
Journal of Economic Literature (JEL): B52, C80, O31, O35, O38, Y10 Acknowledgments
This paper draws on work conducted for the CrESSI, Creating Economic Space for Social Innovation project that has received funding from the European Union’s Seventh Framework Programme for Research, Technological Development and Demonstration (grant agreement No. 613261).
ii
Az üzleti célú innovációk mérése: kiterjeszthetjük-e ezeket a módszereket a társadalmi innovációk elemzésére?
Havas Attila
Összefoglaló
A tanulmány abból a szemszögből tekinti át az üzleti célú innovációk mérésére széles körben használt különböző módszereket, hogy azok milyen mértékben (lennének) alkalmasak a társadalmi innovációk elemzésére. A tanulmány következtetései szerint: 1) Az Innovációs Unió Eredménytábla (Innovation Union Scoreboard, IUS) összeállításához használt mérőszámok többsége a K+F alapú innovációs folyamatokat méri. A gyakorlati tudásra támaszkodó innovációk azonban legalább ilyen fontosak a vállalatok számára, ezért az IUS csak részleges képet ad az innovációs teljesítményről. Bár a társadalmi innovációk K+F eredményeket is hasznosíthatnak, a legtöbb esetben a döntő mozzanat egy új működési mód bevezetése, illetve az ehhez szükséges szervezeti, vezetési és magatartásbeli változások. Ez utóbbiak megragadására nem alkalmasak az IUS mutatószámai. 2) A Globális Innovációs Index kiszámításához használt 81 mutató közül egyiket sem érdemes átvenni a társadalmi innovációk mérésére. 3) A számított (kompozit) mutatók csak korlátozottan alkalmasak az egymástól jelentősen eltérő innovációs rendszerek teljesítményének elemzésére: egy ilyen mutató alacsony szintje nem elégséges annak megállapítására, hogy melyik alrendszerben és milyen típusú szakpolitikai intézkedés szükséges. Az elégtelen teljesítmény okait és a kilábalás lehetőségeit alapos nemzetközi összehasonlító elemzésekkel lehet feltárni. 4) A társadalmi innovációk elemzése során is meg kell különböztetni, hogy mi a megfigyelés tárgya: (i) az innovációs tevékenységek (erőfeszítések) szintje; (ii) a társadalmi innovációk keretfeltételei (az erőforrások, a társadalmi innovációhoz szükséges tudás és gyakorlati tapasztalat megléte, az értékrend, a magatartásminták jellege stb.); vagy (iii) a társadalmi innovációk gazdasági, társadalmi és környezeti hatása.
Tárgyszavak: Az innováció evolúciós közgazdaságtana, Üzleti innováció; Társadalmi innováció; Az innováció mérése; Összetett (kompozit) mutatók; Eredménytáblák, rangsorok;
A mérés tárgya
Journal of Economic Literature (JEL): B52, C80, O31, O35, O38, Y10 Köszönetnyilvánítás
A tanulmányt megalapozó kutatást a CrESSI, Creating Economic Space for Social Innovation (EU RTD FP7, No. 613261) projekt tette lehetővé.
iii Table of Contents
1 Introduction ... 1
2 Models and economic theories of innovation ... 2
2.1 Linear, networked and interactive learning models of innovation and policy implications ... 3
2.2 Innovation in economics paradigms ... 5
2.3 Policy rationales derived from economic theories ... 7
3 The Innovation Union Scoreboard ... 10
4 The Global Innovation Index ... 17
5 Further methodological considerations ... 24
5.1 Degree of novelty, unit of analysis ... 24
5.2 Innovation activities, their framework conditions and impacts ... 26
5.3 Composite indicators ... 26
6 Summary and conclusions ... 27
References ... 30
Appendix 1: Sources of information for innovation ... 36
Appendix 2: The EIS and IUS indicators ... 38
Appendix 3: The Global Innovation Index indicators ... 46
1 INTRODUCTION
The basic objective of this paper is to review established approaches to capturing and measuring various types of innovations from the angle of measuring social innovations.
Social innovation is defined by the CrESSI project as follows: “The development and delivery of new ideas (products, services, models, markets, processes) at different socio-structural levels that intentionally seek to improve human capabilities, social relations, and the processes in which these solutions are carried out.” It is important to clarify at the outset that this paper considers all sorts of business (or: profit-oriented) innovations on the one hand, and social (socially-oriented or societal) innovations, on the other, irrespective of their nature. In other words, we should take into account not only technological (product, service, and process) innovations when discussing profit-oriented innovations, but organisational and marketing innovations as well.1 Innovation studies also show that it is more of an exception than a rule to introduce technological innovations without organisational innovations and in many cases marketing and market innovations are also needed.
Moreover, the latter ones are vital for the success of the former ones. (Pavitt, 1999; Tidd et al., 1997) In particular, radical innovations often create new markets and that is, by definition, a market innovation as well.
In a similar vein, technological innovations, aimed at tackling societal challenges, should not be neglected when considering social innovations. Further, most likely certain organisational and marketing innovations might also be useful – or even indispensible – to achieve societal goals. In sum, we should keep in mind a distinction between the nature of innovations (technological, organisational, and marketing) and the goals of innovation efforts (business vs. societal purposes).
Significant progress has been achieved in measuring R&D and innovation activities since the 1960s (Grupp, 1998; Grupp and Schubert, 2010; Smith, 2005) with the intention to provide comparable data sets as a solid basis for assessing R&D and innovation performance and thereby guiding policy-makers in devising appropriate policies.2 Although there are widely used guidelines to collect data on R&D and innovation – the Frascati and Oslo Manuals (OECD, 2002 and 2005, respectively) –, it is not straightforward to find the most
1 These three types of innovations are defined by the Oslo Manual (OECD, 2005), aimed at providing guidelines to interpret and measure innovations introduced by businesses. Interestingly, market innovations, that is, entering new markets to purchase inputs or sell outputs (not to be confused with marketing innovations) are not mentioned by the Manual (although these are parts of the classic description of innovation by Schumpeter, and important ones, indeed). Perhaps it would be almost impossible to measure these crucial innovations. Further financial innovations are not mentioned either as a separate category. Certain types of financial innovations can be interpreted as service innovations (e.g. new financial ‘products’), while others (e.g. e- and m-banking) as new business practices, that is, organisational innovations using the definitions presented in the Manual.
2 “The Innovation Union Scoreboard 2013 gives a comparative assessment of the innovation performance of the EU27 Member States and the relative strengths and weaknesses of their research and innovation systems.” (EC, 2013a: 4)
2
appropriate way to assess R&D and innovation performance. To start with, R&D is such a complex, multifaceted process that it cannot be sufficiently characterised by two or three indicators, and that applies to innovation a fortiori. Hence, there is always a need to select a certain set of indicators to depict innovation processes, and especially to analyse and assess innovation performance. The choice of indicators is, therefore, an important decision reflecting the mindset of those decision-makers who have chosen them. These figures are
‘subjective’ in that respect, but as they are expressed in numbers, most people perceive indicators as being ‘objective’ by definition.
For this reason – besides several others – it is important to review how innovation is understood in particular models of innovations and analysed by various schools of economics. (Section 2) Based on this, two major measurement endeavours, namely the Innovation Union Scoreboard and the Global Innovation Index can be assessed in depth.
(Sections 3-4) Further methodological issues are discussed in Section 5, while conclusions are summarised in Section 6.
2 MODELS AND ECONOMIC THEORIES OF INNOVATION
Besides Schumpeter, only a few economists had perceived innovation as a relevant research theme in the first half of the 20th century.3 At that time, however, natural scientists, managers of business R&D labs and policy advisors had formulated the first models of innovations – stressing the importance of scientific research –, and these ideas are still highly influential.4 Since the late 1950s, more and more economists have shown interest in studying innovation, leading to new models of innovation, as well as an explicit mention of innovation in various economics paradigms. The role of innovation in economic development, however, is analysed by various schools of economics in diametrically different ways.5 The underlying assumptions and key notions of these paradigms lead to diverse policy implications.
3 This section heavily draws on Section 2 in Havas (2015a).
4 For further details, see, e.g. Fagerberg et al. (2011: 898) and Godin (2008: 64-66).
5 The ensuing overview can only be brief, and thus somewhat simplified. More detailed and nuanced accounts, major achievements and synthesising pieces of work include Baumol (2002); Baumol et al. (2007); Castellacci (2008a); Dodgson and Rothwell (eds) (1994); Dodgson et al. (eds) (2014); Dosi (1988a), (1988b); Dosi et al. (eds) (1988); Edquist (ed.) (1997); Ergas (1986), (1987); Fagerberg et al. (eds) (2005); Fagerberg et al. (2012); Freeman (1994); Freeman and Soete (1997); Grupp (1998); Hall and Rosenberg (eds) (2010); Klevorick et al. (1995);
Laestadious et al. (2005); Lazonick (2013); Lundvall (ed.) (1992); Lundvall and Borrás (1999); Martin (2012);
Metcalfe (1998); Mowery and Nelson (1999); Nelson (ed.) (1993); Nelson (1995); OECD (1992), (1998); Pavitt (1999); Smith (2000); and von Tunzelman (1995).
3
2.1 LINEAR, NETWORKED AND INTERACTIVE LEARNING MODELS OF INNOVATION AND POLICY IMPLICATIONS
The first models of innovation had been devised by natural scientists and practitioners before economists showed a serious interest in these issues.6 The idea that basic research is the main source of innovation had already been proposed at the beginning of the 20th century, gradually leading to what is known today as the science-push model of innovation, forcefully advocated by Bush (1945).
It is worth recalling some of the main building blocks of Bush’s reasoning:
“We will not get ahead in international trade unless we offer new and more attractive and cheaper products. Where will these new products come from? How will we find ways to make better products at lower cost? The answer is clear. There must be a stream of new scientific knowledge to turn the wheels of private and public enterprise. There must be plenty of men and women trained in science and technology for upon them depend both the creation of new knowledge and its application to practical purposes. (…)
New products and new processes do not appear full-grown. They are founded on new principles and new conceptions, which in turn are painstakingly developed by research in the purest realms of science.
Today, it is truer than ever that basic research is the pacemaker of technological progress. In the nineteenth century, Yankee mechanical ingenuity, building largely upon the basic discoveries of European scientists, could greatly advance the technical arts. Now the situation is different.
A nation which depends upon others for its new basic scientific knowledge will be slow in its industrial progress and weak in its competitive position in world trade, regardless of its mechanical skill.” (Bush, 1945, chapter 3)
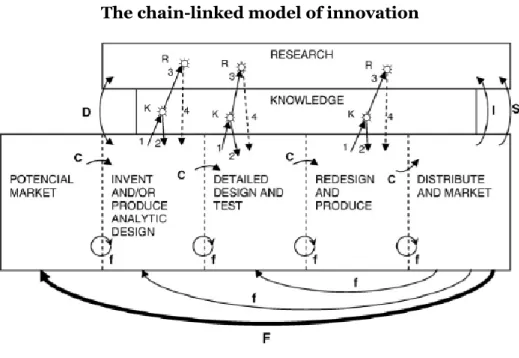
By the second half of the 1960s the so-called market-pull model contested that reasoning, portraying demand as the driving force of innovation. Then a long-lasting and detailed discussion started to establish which of these two types of models is correct, that is, whether R&D results or market demands are the most important information sources of innovations.7
Both the science-push and the market-pull models portray innovation processes as linear ones. (Figure 1)
6 This brief account can only list the most influential models; Balconi et al. (2010); Caraça et al. (2009); Dodgson and Rothwell (1994); and Godin (2006) offer detailed discussions on their emergence, properties and use for analytical and policy-making purposes.
7 It is telling that a recent review of this discussion by Di Stefano et al. (2012) draws on one hundred papers.
4
Figure 1 Linear models of innovation
Source: Dodgson and Rothwell (eds) (1994), Figures 4.3 and 4.4 (p. 41)
This common feature has somewhat eclipsed the differences among these models when Kline and Rosenberg (1986) suggested the chain-linked model of innovation, stressing the non-linear property of innovation processes, the variety of sources of information, as well as the importance of various feedback loops. (Figure 2)
Figure 2 The chain-linked model of innovation
Source: Kline and Rosenberg (1986)
5
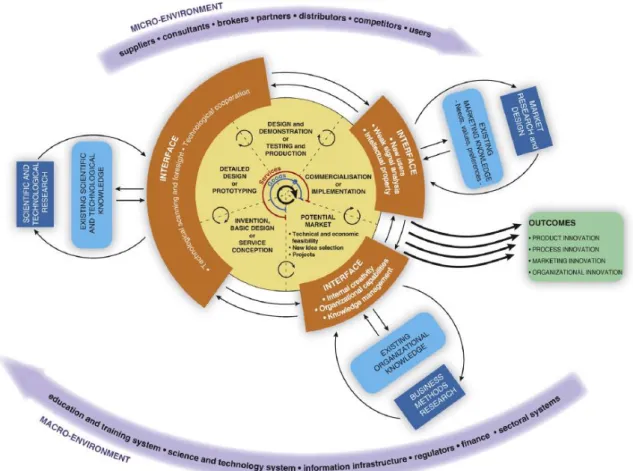
The chain-link model has then been extended into the networked model of innovation;
its recent, highly sophisticated version is called the multi-channel interactive learning model.
(Caraça et al., 2009) (Figure 3) This model
“has representational purposes and not representative ones, i.e. it does not assume that all factors have to be in place for innovation to be realised and successful. Rather, it tries to provide a stylised representation of the main classes of variables, and their interrelationships, which are involved in the innovation process taking place in a wide array of industries. (...)
Thus, the model is an analytical grid that describes and contextualises elements, but it also provides a set of flexible generalisations upon which to base our thinking when trying to explain the sources and stages of the innovation process. It points to the ubiquitous experience-based learning processes taking place within firms, as well as at the interfaces with users, suppliers and competitors.” (Caraça et al., 2009: 864- 866; emphasis added – AH; footnotes are removed from the original)
Figure 3 The multi-channel interactive learning model of innovation
Source: Caraça et al. (2009)
2.2 INNOVATION IN ECONOMICS PARADIGMS
Technological, organisational, managerial changes and opening up new markets had been a major theme in classical economics – without using the term innovation. (Havas, 2015b) Then neo-classical economics essentially abandoned research questions concerned with dynamics, and instead focused on static allocative efficiency. Optimisation was the key issue
6
for this school, assuming homogenous products, diminishing returns to scale, technologies accessible to all producers at zero cost, perfectly informed economic agents, perfect competition, and thus zero profit. Technological changes were treated as exogenous to the economic system, while other types of innovations were not considered at all. Given the empirical findings and theoretical work on firm behaviour and the operation of markets, mainstream industrial economics and organisational theory has relaxed the most unrealistic assumptions, especially perfect information, deterministic environments, perfect competition, and constant or diminishing returns. Yet, “this literature has not addressed institutional issues, it has a very narrow concept of uncertainty, it has no adequate theory of the creation of technological knowledge and technological interdependence amongst firms, and it has no real analysis of the role of government.” (Smith, 2000: 75)
Evolutionary economics of innovation rests on radically different postulates compared to mainstream economics.8 The latter assumes rational agents, who can optimise via calculating risks and taking appropriate actions, while the former stresses that “innovation involves a fundamental element of uncertainty, which is not simply the lack of all the relevant information about the occurrence of known events, but more fundamentally, entails also (a) the existence of techno-economic problems whose solution procedures are unknown, and (b) the impossibility of precisely tracing consequences to actions”. (Dosi, 1988a: 222 – emphasis added) Thus, optimisation is impossible on theoretical grounds.
Availability of information (symmetry vs. asymmetry among agents in this respect) has been the central issue in mainstream economics until recently. Evolutionary economics, in contrast, has stressed since its beginnings that the success of firms depends on their accumulated knowledge – both codified and tacit –, skills, as well as learning capabilities.
Information can be purchased (e.g. as a manual, blueprint, or licence), and hence can be accommodated in mainstream economics as a special good relatively easily and comfortably.
Yet, knowledge – and a fortiori, the types of knowledge required for innovation, e.g. tacit knowledge, skills, and competence in pulling together and exploiting available pieces of information – cannot be bought and used instantaneously. A learning process cannot be spared if one is to acquire knowledge and skills, and it is not only time-consuming, but the
8 The so-called new or endogenous growth theory is not discussed here separately because its major implicit assumptions on knowledge are very similar to those of mainstream economics. (Lazonick, 2013; Smith, 2000) Moreover, knowledge in new growth models is reduced to codified scientific knowledge, in sharp contrast to the much richer understanding of knowledge in evolutionary economics of innovation. When summarising the
“evolution of science policy and innovation studies” (SPIS), Martin (2012: 1230) also considers this school as part of mainstream economics: “Endogenous growth theory is perhaps better seen not so much as a contribution to SPIS but rather as a response by mainstream economists to the challenge posed by evolutionary economics.”
7
costs of trial and error need to be incurred as well.9 Thus, the uncertain, cumulative and path-dependent nature of innovation is reinforced.
Cumulativeness, path-dependence and learning lead to heterogeneity among firms, as well as other organisations. On top of that, sectors also differ in terms of major properties and patterns of their innovation processes. (Castellacci, 2008b; Malerba, 2002; Pavitt, 1984;
Peneder, 2010)
Innovators are not lonely champions of new ideas. While talented individuals may develop radically new, brilliant scientific or technological concepts, successful innovations require various types and forms and knowledge, rarely possessed by a single organisation. A close collaboration among firms, universities, public and private research organisations, and specialised service-providers is, therefore, a prerequisite of major innovations, and can take various forms, from informal communications through highly sophisticated R&D contracts to alliances and joint ventures. (Freeman, 1991, 1994, 1995; Lundvall and Borrás, 1999;
OECD, 2001; Smith, 2000, 2002; Tidd et al., 1997) In other words, ‘open innovation’ is not a new phenomenon at all. (Mowery, 2009)
2.3 POLICY RATIONALES DERIVED FROM ECONOMIC THEORIES
Different policy rationales can be drawn from competing schools of economic thought.
Mainstream economics is primarily concerned with market failures: the unpredictability of knowledge outputs from inputs, the inappropriability of full economic benefits of private investment in knowledge creation, and the indivisibility in knowledge production lead to a
‘suboptimal’ level of business R&D efforts. Policy interventions, therefore, are justified if they aim at (a) creating incentives to boost private R&D expenditures by ways of subsidies and protection of intellectual property rights, or (b) funding for public R&D activities.
Evolutionary economics of innovation investigates the role of knowledge creation and exploitation in economic processes; that is, it does not focus exclusively on R&D. This school considers various types and forms of knowledge, including practical or experience-based
9 Arrow (1962) was already discussing „The Economic Implications of Learning by Doing”, and Rosenberg (1982) stressed the importance of learning by using (ch. 6). Recently, learning has become a more regular subject in mainstream economics, most notably in game theory. For instance, while „learning” only appeared twice in the title of NBER working papers in 1996, it occurred 5 times in 1999, 6 times in 2002, 13 times in 2008, 10 times in 2013, and 12 times in 2014, among others in the forms of „learning by doing”, „learning from experience”, and
„learning from exporting” – but also „learning from state longitudinal data systems” and „learning millennial- style”. (It should be added that at least 15-20 NBER working papers are published a week.) Taking the titles and abstracts of articles published in the American Economic Review, „learning” occurred first in 1999, then 2-3 times a year in 2002-2006; 4 times in 2008, 2011, and 2012; 5 times in 2013; 6 times in 2007, 2010, and 2014; and 7 times in 2009. These articles discuss a wide variety of research themes – e.g. behaviour of firms and other organisations, business cycles, stock exchange transactions, forecasting of economic growth, mortgage, art auctions, game theory, behavioural economics, energy, health, labour market – and modes of learning. Thus, not all these articles are relevant from the point of analysing innovation processes (e.g. „learning [one’s] HIV status”
is not part of an innovation process). Further, in several cases knowledge is narrowed down to patents, which is clearly a misconception. Yet, a detailed analysis of the substance of these articles is beyond the scope of this paper.
8
knowledge acquired via learning by doing, using and interacting. As these are all relevant to innovation, scientific knowledge is far from being the only type of knowledge required for a successful introduction of new products, processes or services, let alone non-technological innovations. R&D is undoubtedly among the vital sources of knowledge. Besides in-house R&D projects, however, results of other R&D projects are also widely utilised during the innovation process: extramural projects conducted in the same or other sectors, at public or private research establishments, home or abroad. More importantly, there are a number of other sources of knowledge, also essential for innovations, such as design, scaling up, testing, tooling-up, trouble-shooting, and other engineering activities, ideas from suppliers and users, inventors’ concepts and practical experiments (Hirsch-Kreinsen et al. (eds), 2005;
Klevorick et al., 1995; Lundvall (ed.), 1992; Lundvall and Borrás, 1999; Rosenberg, 1996, 1998; von Hippel, 1988), as well as collaboration among engineers, designers, artists, and other creative ‘geeks’. Further, innovative firms also utilise knowledge embodied in advanced materials and other inputs, equipment, and software.
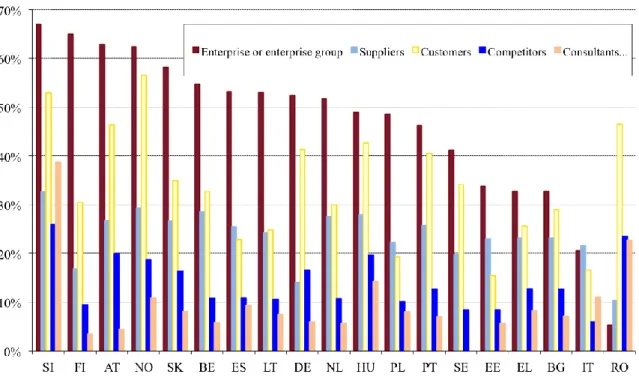
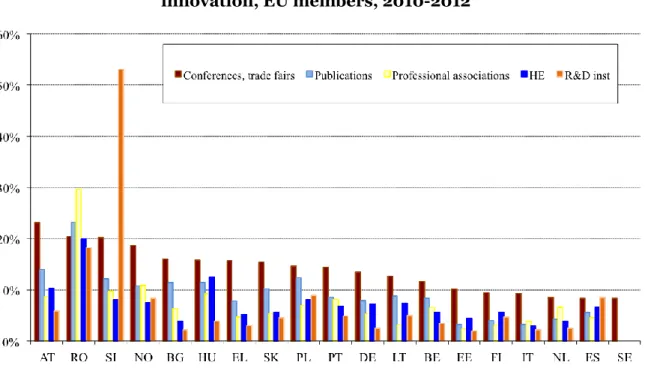
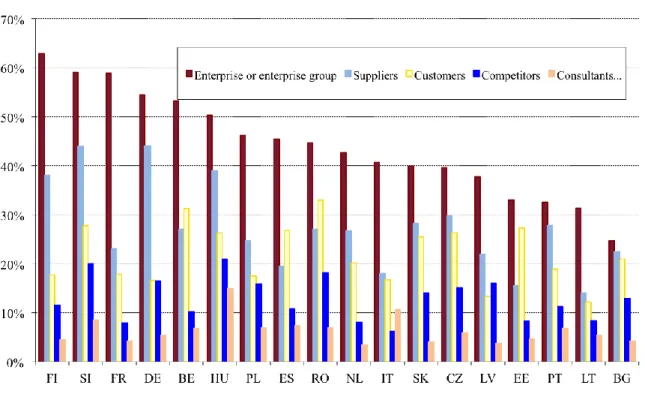
The Community Innovation Survey (CIS) defines its own set of categories as highly important sources of information for product and process innovation: the enterprise or the enterprise group; suppliers of equipment, materials, components or software; clients or customers; competitors or other enterprises from the same sector; consultants, commercial labs or private R&D institutes; universities or other higher education institutes; government or public research institutes; conferences, trade fairs, exhibitions; scientific journals and trade/ technical publications; and professional and industry associations. All rounds of CIS clearly and consistently show that firms regard a wide variety of sources of information as highly important ones for innovation, but given space limits, only the 2010-2012 data are reported in Figures 4-5.10
10 Data for the 2006-2008 and 2008-2010 periods are presented in Appendix 1.
9
Figure 4 Highly important ‘business’ sources of information for product and process
innovation, EU members, 2010-2012
Source: Eurostat, CIS2012
Note: Data for Cyprus, Luxembourg and Malta are not included in this figure.
Figure 5 Highly important ‘scientific’ sources of information for product and process
innovation, EU members, 2010-2012
Source: Eurostat, CIS2012
Note: Data for Cyprus, Luxembourg and Malta are not included in this figure.
10
The wide variety of knowledge drawn on in innovation processes is a crucial point to bear in mind as the OECD classification of industries only takes into account expenditures on formal R&D activities, carried out within the boundaries of a given sector.11 In other words, a number of highly successful, innovative firms, exploiting advanced knowledge created externally in distributed knowledge bases (Smith, 2002) and internally by non-R&D processes, are classified as medium-low-tech or low-tech, just because their R&D expenditures are below the threshold set by the OECD.
In sum, evolutionary economics of innovation posits that the success of firms is largely determined by their abilities to exploit various types of knowledge, generated by both R&D and non-R&D activities. Knowledge generation and exploitation takes place in, and is fostered by, various forms of internal and external interactions. The quality and frequency of the latter is largely determined by the properties of a given innovation system, in which these interactions take place. STI policies, therefore, should aim at strengthening the respective innovation system and improving its performance by tackling systemic failures hampering the generation, diffusion and utilisation of any type of knowledge required for successful innovation.12 (Edquist, 2011; Foray (ed.), 2009; Freeman, 1994; Lundvall and Borrás, 1999;
OECD, 1998; Smith, 2000) From a different angle, conscious, co-ordinated policy efforts are needed to promote knowledge-intensive activities in all sectors.
3 THE INNOVATION UNION SCOREBOARD
As shown above, firms exploit various types of knowledge for their innovation activities.
Applying this general observation to the Danish case, and relying on the DISKO survey, Jensen et al. (2007) made an elementary distinction between two modes of innovation: (a) one based on the production and use of codified scientific and technical knowledge (in brief, the ST mode), and (b) another one relying on informal processes of learning and experience- based know-how (called DUI: learning by Doing, Using and Interacting).
Following this distinction, the indicators used in the various editions of the Innovation Union Scoreboard13 are characterised below, using a rudimentary classification. An indicator can be relevant to reflect:
11 The so-called indirect R&D intensity has been also calculated as R&D expenditures embodied in intermediates and capital goods purchased on the domestic market or imported. Yet, it has been concluded that indirect R&D intensities would not influence the classification of sectors. (Hatzichronoglou, 1997: 5)
12 In an attempt to systematically compare the market and systemic failure policy rationales, Bleda and del Río (2013) introduce the notion of evolutionary market failures, and reinterpret „the neoclassic market failures” as particular cases of evolutionary market failures, relying on the crucial distinction between knowledge and information.
13 The Innovation Union Scoreboard originally was called European Innovation Scoreboard (EIS). The EIS and IUS indicators have been revised several times since the first edition of the scoreboard, that is, EIS 2002. The current name of the scoreboard was introduced in 2010.
11
only R&D-based innovations
mainly R&D-based innovations
only non-R&D-based innovations
mainly non-R&D-based innovations
both types of innovations.
This rudimentary classification reveals a bias towards R&D-based innovations in the first edition of the EIS: 10 indicators were only relevant for R&D-based innovations; 8 could be relevant for both types of innovations; and none focused on non-R&D-based innovations.14 (Table 1)
14 A fairly detailed, partly technical, partly substantive discussion would be needed to refine this simple classification.
12
Table 1 The 2002 European Innovation Scoreboard indicators
Relevance for R&D-
based innovation
Relevance for non-
R&D- based innovation 1 Human resources
New S&E graduates (ISCED 5a and above) per 1000 population aged
20-29 X
Population with tertiary education (% of 25–64 years age class) b b Participation in life-long learning (% of 25–64 years age class) b b Employment in medium-high and high-tech manufacturing (% of
total workforce) X
Employment in high-tech services (% of total workforce) X 2 Knowledge creation
Public R&D expenditures (GERD – BERD) (% of GDP) X Business expenditures on R&D (BERD) (% of GDP) X EPO high-tech patent applications (per million population) X USPTO high-tech patent applications (per million population) X 3 Transmission and application of knowledge
SMEs innovating in-house (% of manufacturing SMEs) b b
SMEs involved in innovation co-operation (% of manufacturing
SMEs) b b
Innovation expenditures (% of all turnover in manufacturing) b b 4 Innovation finance, output and markets
High technology venture capital investment (% of GDP) X Capital raised on parallel markets plus by new firms on main markets
(% of GDP)i X
Sales of ‘new to market’ products (% of all turnover in
manufacturing) b b
Home internet access (% of all households) b b
ICT expenditures (% of GDP) b b
Share of manufacturing value-added in high-tech X Legend:
X: only relevant x: mainly relevant b: relevant for both types
Source: own compilation, drawing on the detailed definition of indicators, EC (2002).
Notes: Public R&D expenditures do not equal to GERD – BERD; rather, it should be the sum of government- funded parts of BERD, GOVERD, and HERD
Three indicators, namely EPO patent applications (per million population), Home internet access (per 100 population), and Inward FDI stock (% of GDP) were only used for candidate countries.
i“Parallel stock exchanges focus on high technology sectors.” (EC, 2002: 31)
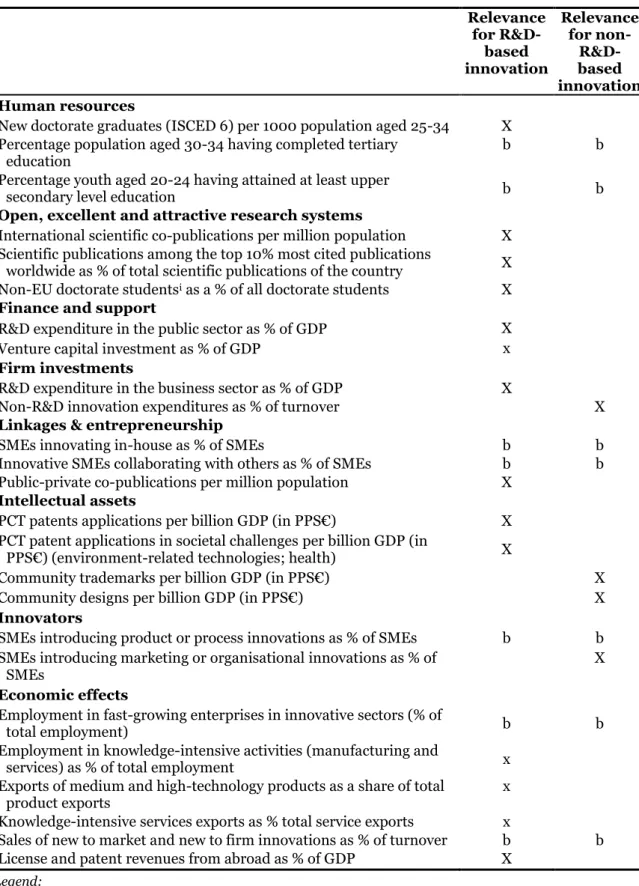
The 2014 and 2015 editions of the IUS use 25 indicators, grouped by 8 innovation dimensions. (EC, 2014, 2015) Repeating the same exercise shows that the bias towards R&D- based innovations has been kept: 10 of the most recent IUS indicators15 are only relevant for, and a further four mainly capture, R&D-based innovations; seven could be relevant for both types of innovations; and a mere four focus on non-R&D-based innovations. (Table 2)
15 There was only a slight change introduced in 2015: the indicator called “Contribution of medium and high-tech product exports to the trade balance” was replaced by “Exports of medium and high-technology products as a share of total product exports”. This change had no effect on the nature of the indicators, and thus the 2014 edition of the IUS is not presented here.
13
Table 2 The 2015 Innovation Union Scoreboard indicators
Relevance for R&D-
based innovation
Relevance for non-
R&D- based innovation Human resources
New doctorate graduates (ISCED 6) per 1000 population aged 25-34 X Percentage population aged 30-34 having completed tertiary
education b b
Percentage youth aged 20-24 having attained at least upper
secondary level education b b
Open, excellent and attractive research systems
International scientific co-publications per million population X Scientific publications among the top 10% most cited publications
worldwide as % of total scientific publications of the country X Non-EU doctorate studentsi as a % of all doctorate students X Finance and support
R&D expenditure in the public sector as % of GDP X
Venture capital investment as % of GDP x
Firm investments
R&D expenditure in the business sector as % of GDP X
Non-R&D innovation expenditures as % of turnover X
Linkages & entrepreneurship
SMEs innovating in-house as % of SMEs b b
Innovative SMEs collaborating with others as % of SMEs b b Public-private co-publications per million population X
Intellectual assets
PCT patents applications per billion GDP (in PPS€) X PCT patent applications in societal challenges per billion GDP (in
PPS€) (environment-related technologies; health) X
Community trademarks per billion GDP (in PPS€) X
Community designs per billion GDP (in PPS€) X
Innovators
SMEs introducing product or process innovations as % of SMEs b b SMEs introducing marketing or organisational innovations as % of
SMEs X
Economic effects
Employment in fast-growing enterprises in innovative sectors (% of
total employment) b b
Employment in knowledge-intensive activities (manufacturing and
services) as % of total employment x
Exports of medium and high-technology products as a share of total
product exports x
Knowledge-intensive services exports as % total service exports x
Sales of new to market and new to firm innovations as % of turnover b b License and patent revenues from abroad as % of GDP X
Legend:
X: only relevant x: mainly relevant b: relevant for both types Source: own compilation
i It is a somewhat strict definition of openness, which only takes into account non-EU doctorate students.
14
Again, a fairly detailed, partly technical, partly substantive discussion would be needed to refine this simple classification, especially concerning the following issues: to what extent upper secondary education, venture capital, employment in knowledge-intensive activities, and knowledge-intensive services exports are relevant indicators to capture non-R&D-based innovations; and to what extent non-R&D-based innovation activities are needed for successful R&D-based innovations?
The indicators used in the previous editions of the EIS and IUS are characterised in Appendix 2 (Tables A1-A7). To give an overview of the evolution of the EIS and IUS indicators, results are summarised in Table 3. In sum, the bias towards R&D-based innovations has been rather persistent, although there has been some fluctuation.
Several conclusions can be drawn from the above considerations for analysing social innovation.
First, while the number and definitions of indicators used to compile the various editions of EIS and IUS have changed to a non-negligible extent since 2002, these indicators consistently focus on measuring R&D activities (inputs and outputs) and R&D-based innovation activities. In other words, they can be relevant in settings characterised predominantly by the so-called ST mode of innovation, but significantly less so in other settings, characterised by other types of innovation activities. In other words, using the EIS or IUS indicators would not help establishing if a certain system is characterised by a low level of innovation activities altogether – or a low level of R&D-based innovation activities.
Yet, that is a fairly important distinction both from an analytical and a practical (policy) point of view: these two systems (settings) are fundamentally different.
Several analysts and policy-makers tend to believe that advanced economies can be sufficiently characterised by focussing on the ST mode of innovation, on the one hand, and less advanced economies should also attempt to change the sectoral composition of their economy by increasing the weight of the so-called high-tech (HT) sectors, on the other.
These views, however, cannot be corroborated by empirical evidence.
15
Table 3 The evolution of the EIS and IUS indicators, 2002-2014
EIS 2002 EIS 2003 EIS 2004 EIS 2005 EIS 2006 EIS 2007 EIS 2008 EIS 2009 IUS 2010 – IUS 2013
IUS 2014 IUS 2015 Indicators reflecting
only R&D-based innovations 10 9 9 8 7 8 8 10 10
mainly R&D-based innovations - 3 3 5 5 4 4 4 4
both types 8 9 9 12 12 15 16 6 7
only non-R&D-based innovations - - - - - 1 1 4 4
mainly non-R&D-based innovations - - 1 1 1 1 1 - -
Number of indicators 18 21 22 26 25 29 30 24 25
Source: own compilation
16
Any simple statistical analysis reveals that the so-called high-tech sectors – supposed to be drivers of economic development, due to their intense ST mode innovation activities – have a fairly low weight either in output or employment. Innovation studies have shown that technological innovations can hardly be introduced without organisational and managerial innovations. Moreover, the latter ones – together with marketing innovations – are vital for the success of the former ones.16 (Pavitt, 1999; Tidd et al., 1997) Further, those companies are the most successful ones, which consciously combine the ST and DUI modes of innovation. (Jensen et al., 2007)
Yet, the high-tech myth is so powerful that even those researchers who base their work on thorough analysis of facts are taken by surprise when the facts are at odds with the widespread obsession with high-tech. A telling example is Peneder’s excellent study on the
‘Austrian paradox’:
“On the one hand, macroeconomic indicators on productivity, growth, employment and foreign direct investment indicate that overall performance is stable and highly competitive. On the other hand, an international comparison of industrial structures reveals a severe gap in the most technologically advanced branches of manufacturing, suggesting that Austria is having problems establishing a foothold in the dynamic markets of the future.” (Peneder, 1999: 239)
In contrast, evolutionary economics of innovation claims that any firm – belonging to either a low- and medium-technology (LMT) or a HT sector – can become competitive in ‘the dynamic markets of the future’ if it is successful in combining its own, firm-specific innovative capabilities with ‘extra-mural’ knowledge available in distributed knowledge bases. In other words, Austrian policy-makers need not be concerned with the observed
‘paradox’ as long as they help Austrian firms sustain their learning capabilities, and maintain thereby their innovativeness. That would lead to good economic performance – irrespective of the share of LMT industries in the economy.
From a different angle, while the bulk of innovation activities in the LMT sectors are not based on intramural R&D efforts, these sectors also improve their performance by various types of innovations. These firms are usually engaged in the DUI mode of innovation, but they also draw on advanced S&T results available through the so-called distributed knowledge bases (Robertson and Smith, 2008; Smith, 2002), as well as advanced materials, production equipment, software and various other inputs (e.g. electronics components and sub-systems) supplied by HT industries. (Bender et al. (eds), 2005; Hirsch-Kreinsen et al.
(eds), 2005; Hirsch-Kreinsen and Jacobson (eds), 2008; Hirsch-Kreinsen and Schwinge (eds) 2014; Jensen et al., 2007; Kaloudis et al., 2005; Mendonça, 2009; Sandven et al.,
16 Although it goes without saying that not all technological innovations are based on R&D results, people tend to forget this basic fact. Certain organisational, managerial, marketing and financial innovations, in turn, draw on R&D results (but usually not stemming from R&D activities conducted or financed by firms). For these two reasons it would be a mistake to equate technological innovations with R&D-based innovations.
17
2005; von Tunzelmann and Acha, 2005) Thus, demand by the LMT sectors constitutes major market opportunities for HT firms, and also provides strong incentives – and ideas – for their RTDI activities. (Robertson et al., 2009)
It is worth recalling that the 2003 EIS report also stressed the importance of the LMT sectors, as well as the significance of their innovation activities:
„The EIS has been designed with a strong focus on innovation in high-tech sectors.
Although these sectors are very important engines of technological innovation, they are only a relatively small part of the economy as measured in their contribution to GDP and total employment. The larger share of low and medium-tech sectors in the economy and the fact that these sectors are important users of new technologies merits a closer look at their innovation performance. This could help national policy makers with focusing their innovation strategies on existing strength and overcome areas of weakness.” (EC, 2003a: 20)
Since then, however, these ideas have been given less prominence. No doubt, it would be an interesting research question why this is the case, but this paper cannot address this issue. More recently, another EC document, namely the 2013 EU Competitiveness Report is sending ‘mixed’ messages on these issues. At certain points it reinforces these adverse effects:
„the EU has comparative advantages in most manufacturing sectors (15 out of 23) accounting for about three quarters of EU manufacturing output. (…) Of the 15 sectors with comparative advantages mentioned above, about two-thirds are in the low-tech and medium-low tech manufacturing groups. On a positive note though, even in those sectors EU competitiveness is based on high-end innovative products.”
(EC, 2013d: 3-4, emphasis added – AH)
Is it a negative phenomenon, then, that around 10 EU LMT sectors are internationally competitive?!? A more balanced view is also offered:
“… the policy priority attached to key enabling technologies which lead to new materials and products in all manufacturing sectors has a strong potential to upgrade EU competitiveness not only in the high-tech sectors but also in the traditional industries.” (ibid: 5)
To sum up the first conclusion, analysts and policy-makers dealing with innovation should pay attention to both R&D-based and non-R&D-based innovations.
The second conclusion: while social innovations can indeed utilise R&D-based technological innovations, their essence tends to be organisational, managerial and behavioural changes. The EIS and IUS indicators, in turn, do not capture these types of changes.
4 THE GLOBAL INNOVATION INDEX
The Global Innovation Index (GII) has a significantly broader coverage – compared to the IUS – in two respects: it covers well over 100 countries, and considers 81 indicators,
18
arranged in 7 “pillars”. The seven pillars used in the 2014 edition of the GII include:
Institutions (9 indicators), Human capital and research (11), Infrastructure (10), Market sophistication (10), Business sophistication (14), Knowledge and technology outputs (14), and Creative outputs (13). The themes considered by each pillar are summarised in Figure 6.
Figure 6 Framework of the Global Innovation Index 2014
Source: Global Innovation Index 2014
To assess the relevance of these 81 indicators, and especially the ‘match’ between the themes (or headings) captured by the 7 pillars would require a fairly lengthy paper. In other words, the GII indicators are characterised in a somewhat simplified way here. It should be stressed that most elements are indices themselves, that is, not ‘stand-alone’ indicators. In other words, several methodological weaknesses are likely to remain hidden.
Pillar 1: Institutions
Pillar 1 is composed of 3 sub-pillars. The political environment sub-pillar incorporates three indices with the intention to reflect the following aspects: “perceptions of the likelihood that a government might be destabilized; the quality of public and civil services, policy formulation, and implementation; and perceptions of violations to press freedom”.
The second sub-pillar, called regulatory environment, is comprised of two indices to capture “perceptions on the ability of the government to formulate and implement cohesive
19
policies that promote the development of the private sector and at evaluating the extent to which the rule of law prevails (in aspects such as contract enforcement, property rights, the police, and the courts)”. A third indicator is meant to evaluate “the cost of redundancy dismissal as the sum, in salary weeks, of the cost of advance notice requirements added to severance payments due when terminating a redundant worker”.
The third sub-pillar, that is, the business environment one is aimed at summarising three aspects directly affecting private entrepreneurial endeavours. It uses the World Bank indices
“on the ease of starting a business; the ease of resolving insolvency (based on the recovery rate recorded as the cents on the dollar recouped by creditors through reorganization, liquidation, or debt enforcement/foreclosure proceedings); and the ease of paying taxes”.
(Cornell University et al., 2014: 45-46)
Not all the above elements are institutions (“rules of the game”), and not all are directly related to innovation processes and performance. It can be argued, though, that the aspects (attempted to be) captured by these indices are relevant to characterise the political, regulatory and business environment for innovation. Among the important missing elements, one should mention legislation on competition,17 as well as the entrepreneurial culture in a given country.
Pillar 2: Human capital and research
Pillar 2 is also comprised of 3 sub-pillars. Sub-pillar 2.1 is composed of several of indicators with the intention to capture achievements at the first two levels of education, namely elementary and secondary education. Education expenditure and school life expectancy are taken as “good proxies for coverage”. Government expenditure per pupil at secondary level is meant to indicate “the level of priority given to secondary education by the state”. The quality of education is measured via (a) PISA (OECD Programme for International Student Assessment) results indicating 15-year-old students’ performances in reading, mathematics, and science, as well as (b) the pupil-teacher ratio.
Sub-pillar 2.2 on tertiary education is designed to measure coverage at this level of education. “(…) priority is given to the sectors traditionally associated with innovation (with a series on the percentage of tertiary graduates in science and engineering, manufacturing, and construction); and the inbound mobility of tertiary students, which plays a crucial role in the exchange of ideas and skills necessary for innovation.”
Sub-pillar 2.3 on R&D is meant to capture the level and quality of R&D activities by using the number of researchers (headcounts, per million of population), gross expenditures on
17 The intensity of comepetition is included in Pillar 4.
20
R&D as percentage of GDP, and the quality of scientific and research organisations proxied by the average score of the top three universities in the QS World University Ranking as of 2013. “(…) this indicator aims at capturing the availability of at least three higher education institutions of quality within each economy (i.e., included in the global top 700), and is not aimed at assessing the average level of all institutions within a particular economy.” (Cornell University et al., 2014: 46-47)
Formal education is a crucial factor determining the quality of human capital, no doubt, but life-long learning and other, informal modes of learning are also important. Research is conducted outside universities, too, both by other publicly financed research organisations and businesses. Moreover, the quality of research conducted by these latter types of organisations is not necessarily lower than that at universities. Moreover, university rankings themselves suffer from several major methodological weaknesses. Thus, the name of this pillar is more ‘ambitious’ than its actual content.
Pillar 3: Infrastructure
The third pillar on infrastructure is also built by three sub-pillars: information and communication technologies (ICT), general infrastructure, and ecological sustainability.
Sub-pillar 3.1 on ICT is computed by using four indices developed by international organisations on ICT access, ICT use, on-line service by governments, and on-line participation of citizens. Sub-pillar 3.2 on general infrastructure is composed of “the average of electricity output in kWh per capita; a composite indicator on logistics performance; and gross capital formation, which consists of outlays on additions to the fixed assets and net inventories of the economy, including land improvements (fences, ditches, drains); plant, machinery, and equipment purchases; and the construction of roads, railways, and the like, including schools, offices, hospitals, private residential dwellings, and commercial and industrial buildings”. Sub-pillar 3.3 on ecological sustainability is constructed by using three indicators: “GDP per unit of energy use (a measure of efficiency in the use of energy), the Environmental Performance Index of Yale and Columbia Universities, and the number of certificates of conformity with standard ISO 14001 on environmental management systems issued”. (Cornell University et al., 2014: 47)
Ecological sustainability is certainly an important issue, but it is difficult to grasp why it is part of the “Infrastructure” pillar, especially when it is measured by the above three components. These are more relevant to reflect those environmental challenges that are to be addressed by innovation efforts – or the outcome of previous eco-innovation efforts. In other words, there is a certain mismatch between the name of this pillar and its actual content.
21 Pillar 4: Market sophistication
The fourth pillar on market sophistication integrates three sub-pillars “structured around market conditions and the total level of transactions”. Sub-pillar 4.1 on credit intends to reflect “the ease of getting credit aimed at measuring the degree to which collateral and bankruptcy laws facilitate lending by protecting the rights of borrowers and lenders, as well as the rules and practices affecting the coverage, scope, and accessibility of credit information”. Transactions are measured by the total value of domestic credit to the private sector (as a percentage of GDP) as well as by the gross loan portfolio of microfinance institutions (as a percentage of GDP) with the intention to make the method applicable to emerging markets, too.
Sub-pillar 4.2 on investment is composed of the ease of protecting investors index and three indicators on the level of transactions. Besides stock market capitalisation, the total value of shares traded (as percentage of GDP) is also taken into account to show if market size is matched by market dynamism. Data on venture capital deals (a total of 18,860 deals in 71 countries in 2013) are also exploited.
Sub-pillar 4.3 considers trade and competition. The market conditions for trade are measured by two indicators: the average tariff rate weighted by import shares and a metric on non-agricultural market access conditions to foreign markets (five major export markets weighted actual applied tariffs for non-agricultural exports). The last indicator is a result from a survey: the intensity of competition in local markets. “Efforts made at finding hard data on competition have so far proved unsuccessful.” (Cornell University et al., 2014: 48)
Pillar 5: Business sophistication
The fifth pillar is intended to capture the level of business sophistication to assess “how conducive firms are to innovation activity”. Sub-pillar 5.1 on knowledge workers is built by four indicators: employment in knowledge-intensive services; the availability of formal training at the firm level; R&D performed by business enterprise (BERD) as a percentage of GDP; and the percentage of gross expenditures of R&D (GERD) financed by businesses.
Further, it includes an indicator taken from the Graduate Management Admission Test (GMAT). “The total number of GMAT test takers (scaled by population aged 20 to 34 years old) [was] taken as a proxy for the entrepreneurial mindset of young graduates.”
Sub-pillar 5.2 on innovation linkages exploits data on business-university R&D collaborations, “the prevalence of well-developed and deep clusters”, the ratio of GERD financed from abroad, and “the number of deals on joint ventures and strategic alliances.
The latter covers a total of 2,978 deals announced in 2013, with firms headquartered in 127 participating economies. In addition, the total number of Patent Cooperation Treaty (PCT)
22
and national office published patent family applications filed by residents in at least three offices is included this year to proxy for international linkages.”
“The rationale behind sub-pillars 5.3 on knowledge absorption (an enabler) and 6.3 on knowledge diffusion (a result) — two sub-pillars designed to be mirror images of each other
— is precisely that together they will reveal how good countries are at absorbing and diffusing knowledge. Sub-pillar 5.3 includes four statistics that are linked to sectors with high-tech content or are key to innovation: royalty and license fees payments as a percentage of total trade; high-tech imports (net of re-imports) as a percentage of total imports; imports of communication, computer and information services as a percentage of total trade; and net inflows of foreign direct investment (FDI) as a percentage of GDP.” (Cornell University et al., 2014: 48-49; some obvious mistakes are corrected – A.H.)
The name of this pillar is not explained, although it does not seem to be self-explanatory.
It is not clear, either, why firms should be conducive to innovation activity. Usually analyses have a different logic: market and regulatory conditions, that is, factors external to the firms, can be conducive for – or hamper – innovation activities performed by businesses. Further, it is difficult to accept the ratio of GMAT test takers “as a proxy for the entrepreneurial mindset of young graduates”. The name of sub-pillar 5.2 (innovation linkages) only partially matches its components, of which two concern R&D activities, and a third one (on patents) is also more relevant to characterise R&D activities than reflect innovation activities. Data on high-tech imports can only partially reflect knowledge absorption.
Pillar 6: Knowledge and technology outputs
The sixth pillar – just as all the previous ones – is composed of 3 sub-pillars. Sub-pillar 6.1 on knowledge creation “includes five indicators that are the result of inventive and innovative activities: patent applications filed by residents both at the national patent office and at the international level through the PCT; utility model applications filed by residents at the national office; scientific and technical published articles in peer-reviewed journals; and an economy’s number of articles (H) that have received at least H citations”.
Sub-pillar 6.2 on knowledge impact is meant to measure “the impact of innovation activities at the micro- and macro-economic level or related proxies: increases in labour productivity, the entry density of new firms, spending on computer software, and the number of certificates of conformity with standard ISO 9001 on quality management systems issued”. The indicator on high- and medium-high-tech industrial output over total manufactures output is for the first time in this edition of the GII.
Sub-pillar 6.3 on knowledge diffusion “is the mirror image of the knowledge absorption sub-pillar of pillar 5. It includes four statistics all linked to sectors with high-tech content or
23
that are key to innovation: royalty and license fees receipts as a percentage of total trade;
high-tech exports (net of re-exports) as a percentage of total exports (net of re-exports);
exports of communication, computer and information services as a percentage of total trade;
and net outflows of FDI as a percentage of GDP.” (Cornell University et al., 2014: 49-50) The first sub-pillar is meant to be composed of indicators on “the result of inventive and innovative activities”. Yet, most of these indicators are relevant to characterise R&D (and not innovation) activities. As for the knowledge impact sub-pillar, only one of the five components is related to knowledge impacts, and even that one is only partially: reflecting the impact of certain types of knowledge. As for knowledge diffusion, all the four components of that sub-pillar can indicate knowledge diffusion outside a given country (with certain limitations), and thus none of these seems to be relevant to characterise knowledge diffusion inside a given country.
Pillar 7: Creative outputs
The seventh pillar is also composed of 3 sub-pillars. The first one on intangible assets includes data on trademark applications by residents at the national office; trademark applications under the Madrid System by country of origin, and results obtained via two survey questions on the use of ICTs by businesses.
Sub-pillar 7.2 on creative goods and services is aimed to capture creativity and the creative outputs of an economy by using five indicators: cultural and creative services exports, including information services, advertising, market research and public opinion polling, and other personal, cultural, and recreational services (as a percentage of total trade); national feature films produced in a given country (per capita count); global entertainment and media output (per capita); printing and publishing output (as a percentage of total manufactures output); and creative goods exports (as a percentage of total trade).
Sub-pillar 7.3 on online creativity is composed of four indicators, all by population aged 15–69 years: generic (biz, info, org, net, and com) and country-code top level domains, average monthly edits to Wikipedia, and video uploads on YouTube. “Attempts made to strengthen this sub-pillar with indicators in areas such as blog posting, online gaming, the development of applications, and have so far proved unsuccessful.” (Cornell University et al., 2014: 50-51)
It is not clear why “the use of ICTs in business and organizational models” is an output indicator. Only a small fraction of printing and publishing output is a creative output, with the bulk being the paper and other printing costs. It would be really costly to establish what portion of video uploads on YouTube can be regarded creative output.