Milan Nikolić1 - Jelena Vukonjanski1 - László Szabó – Milena Nedeljković2 - Edit Terek1
1 University of Novi Sad, Technical Faculty “Mihajlo Pupin”, Zrenjanin, Serbia
2 University of Novi Sad, Faculty of Sciences, Novi Sad, Serbia
Milan Nikolić1 – Jelena Vukonjanski1 – László Szabó – Milena Nedeljković2 - Edit Terek1
RELATIONSHIP BETWEEN LEADERSHIP AND FINANCIAL PERFORMANCES: TRANSITION CONDITIONS
Abstract
This research was aimed at determining the state of leadership in companies in Serbia, as well as its influence on financial performances (FP). The research was conducted using questionnaires. The data were collected by polling 256 managers from 131 companies.
The result of the survey implies that, in companies in Serbia, transactional leadership is present more frequently than transformational leadership. Basic analysis has revealed that in companies in Serbia there is a statistically significant influence of leadership dimensions on FP. Then, the analyses of the influence of leadership dimensions on FP were carried out by the help of the following moderators: National Origin of Companies and Company Ownership Structure. The results indicate the existence of moderating effects in both cases, but only on some correlations between leadership dimensions and financial performances. These results can be considered relevant for the analysis and understanding of the here mentioned issues of leadership in a number of countries in Eastern Europe, which are in the process of transition.
Key words: Leadership, Financial Performances, National Origin of Companies, Company Ownership Structure, Serbia.
Introduction
There is a large volume of published literature on the impact of leadership on various aspects of business performance (Ahearne, Mathieu, & Rapp, 2005; Bass, Avolio, Jung, &
Berson, 2003; Barling, Weber, & Kelloway, 1996; Meindl, Ehrlich, & Dukerich, 1985; Lieberson
& O’Connor, 1972).
According to (Eubanks and Mumford, 2010), some leadership strategies are successful, while others are less so. This, self-evidently, supports the fact that leaders exert a certain
influence on business outcomes. The theoretical study Cannella and Monroe (1997) among other leadership theories, emphasises the importance of transformational leadership theory.
Indeed, there are a number of references confirming a significant correlation between CEO transformational leadership and organisational outcomes, such as (Zhu, Chew, & Spangler, 2005; Thomas, 1988). Moreover, CEO transformational leadership has a direct impact on performance in small and medium sized enterprises (Ling et al., 2008a).
It is important to describe the differences between transformational and transactional leadership in regard to their influence on organisational performance. Some studies point to the increasing influence of transformational leadership on performance.
According to (Howell, Neufeld, & Avolio, 2005), transformational leadership is a positive predictor of unit performance, while transactional leadership (Contingent Reward Behaviour segment) has no effect on performance. In dynamic environmental conditions, transformational leadership has a significantly positive effect on new venture performance (Ensley, Pearce & Hmieleski, 2006), whereas transactional leadership has a significantly negative effect. According to (MacKenzie, Podsakoff, & Rich, 2001), transformational leader behaviour has a stronger direct and indirect impact on sales performance than transactional leader behaviour.
Another group of studies show that in addition to transformational leadership, organisational performance is also influenced by transactional leadership. The reference (Hofmann & Jones, 2005) confirms that leadership (both transformational and transactional) has a predictive effect on collective personality, which is in turn significantly linked to collective performance. Both transformational leadership and transactional leadership (Contingent Reward Behaviour segment) positively affect the performance of army units (Bass et al., 2003). In Russian companies, (Elenkov, 2002) transformational leadership positively predicts organizational performance. This influence is stronger than in the case of transactional leadership, but transactional leadership is also positively related to performance.
What is of particular importance for this study is the fact that financial performance also relates to leadership. According to (Koene, Vogelaar & Soeters, 2002), there is a clear relationship between local leadership and financial performance in stores, while (Waldman, Ramirez, House, & Puranam, 2001) view transactional and charismatic CEO leadership as a financial performance predictor. In the reference (Barling et al., 1996), it has been established that transformational leadership training can significantly increase financial performance levels. The research (Yukl, 2008) has demonstrated that high organizational effectiveness and high financial performance require a leader to be cooperative, flexible and adaptive to changes in the environment.
There are a number of studies which confirm the indirect influence of leadership on company performance. For example, effective leadership behaviour has a positive relation to organizational commitment, which in turn leads to an also positive influence on company performance (Steyrer, Schiffinger, & Lang, 2008). According to (Kim & Brymer, 2011), ethical leadership has a positive relation to subordinate job satisfaction. This further leads to the subordinate will to invest additional effort, and consequently improved business performance.
According to (Aragón-Correa, García-Morales & Cordón-Pozo, 2007), transformational leadership has a significant impact on organizational learning, and indirectly affects company innovativeness. Innovativeness, in turn, has a positive important influence on performance.
The research (Wang, Tsui, & Xin, 2011), demonstrated that CEO relationship-focused behaviour is related to employee attitudes, which through employee attitudes, indirectly relates to company performance.
Some references, such as (Tosi et al., 2004; Ahearne et al., 2005; Waldman, Javidan &
Varella, 2004), suggest the influence of leadership on performance. There is also a group of references which minimise the influence of leadership in this area. For instance, in the reference (Meindl et al., 1985), it is stated that leadership can serve to gain an understanding of the relationships and relations within organisational systems, but has no significant influence on organisational performance. According to (Pfeffer, 1977), the very conditions and circumstances in the environment can lead to higher/lower business outcomes, and the leader as such has little to take merit/blame for. Similarly, in (Lieberson & O’Connor, 1972) it is claimed that performance levels depend on leadership influence, but also on environmental conditions. Practically, the leader and his/her results are restricted by environmental influences.
Most European countries in transition (Russia, Hungary, Romania, Bulgaria, and the countries formed after the breakup of Yugoslavia, including Serbia), characterized by high unemployment rate and a still insufficient readiness for competition, are very interesting area of research from the point of application of the results of Western researchers especially in the area of leadership. These countries still have relatively low standard of living while the salaries are much lower than those in the highly developed countries of Western Europe and the United States. There is a high degree of uncertainty related to job security and therefore for the majority of employees in Serbia, keeping their job is a greater motive for achieving high performance, rather than rewarding and promotion prospects. In the last two decades, many foreign investors have been interested in opening facilities in transition countries due to their relatively cheap, but educated workforce. For the management of these facilities and for the scientific community as well, it is important to examine the possibility of application
of the results of Western researchers in the field of leadership in organizations in transition countries.
Besides the similarities between Serbian and Eastern European countries in terms of transition conditions, there is a similarity in the national culture. Serbia is not a part of the GLOBE project (House, Hanges, Javidan, Dorfman, & Gupta, 2004), which is focused on exploring cross-cultural aspects of leadership. However, the most likely is that the results in Serbia would be the closest to the results of the Eastern European cluster, consisting of eight countries: Albania, Georgia, Greece, Hungary, Kazakhstan, Poland, Russia and Slovenia (Bacacsi, Takacs, Kracsonyi, & Imrek, 2002). For these reasons, any research in the area of leadership in Serbia can be taken as a good basis for an analogue analysis and understanding of leadership in other Eastern European countries.
In addition to the general fact that there are still many unclear areas and room for further research into the field of leadership, the situation in European transition countries (Russia, Hungary, Romania, Bulgaria, Slovenia, Croatia, Serbia) suffers from yet another problem:
there are only several researches dealing with this problem area. This paper seeks to fill in this gap and determine the state of leadership and its influence on business performance in companies in transition countries. Such research has additional significance in the light of transitional conditions, the existence of state and private owned companies, and the recent increase in the number of foreign companies operating in these countries.
Theory and hypotheses
Transformational and Transactional Leadership
Burns (1978) described leadership as a developing interrelationship process in which leaders influence followers, whereby the leaders themselves ‘suffer’ from such an influence resulting in a change of behaviour as they face acceptance or opposition. Moreover, Burns (1978) was in fact the first to make a clear distinction between transactional and transformational leadership. According to him, transactional leadership is based on leaders who motivate followers through a system of reward and punishment, while transformational leadership is based on motivating followers to achieve collective goals. Transactional leadership motivates followers by appealing to their own interests. Transactional leaders seek to provide appropriate rewards to their subordinates when they perform their work on the required level (Burns, 1978). Transactional leadership behaviours are mainly focused on following and maintaining the desired level of organisational operations and tasks.
However, according to (Bryman, 1992; MacKenzie et al., 2001), transactional leadership has failed to show significant results in terms of achieving higher business performance. Consequently, the theory of transformational leadership has gained importance (Bass, 1985; Burns, 1978; Conger & Kanungo, 1987; House, 1977). Contrary to transactional leadership, transformational leaders focus their attention on the relationships with their followers (Cannella & Monroe, 1997). Under the conditions of transformational leadership behaviour, subordinates feel confidence in their leader, feel good in his presence and respect and admire their leader (Conger & Kanungo, 1987; House et al., 1991). Almost all authors in the field of transformational leadership agree that the key characteristic of transformational leaders is the ability to motivate followers to exceed their own expectations (Bass, 1985; Burns, 1978; House, 1977; House
& Shamir, 1993).
According to (Bass, 1985), there are two main dimensions of transactional leadership:
contingent reward behaviour (positive supervisory feedback) and management-by- exception (negative supervisory feedback). Some authors (Podsakoff, Todor, Grover,
& Huber, 1984) refer to the second dimension as contingent punishment behaviour, because this form refers to corrections, criticism and other forms of punishment.
Financial Performance
Some references examine certain financial performance sets. For example, the papers (Tan & Litschert, 1994; Wang, Tsui, Zhang, & Ma, 2003), and the recent study (Wang, Tsui, & Xin, 2011) describe research into the following financial performance aspects:
profitability, sales growth, asset growth, market share, and competitive status in the firm’s industry. In the reference (Nikolić, Savić, Ćoćkalo, Spasojević – Brkić, & Ivin, 2011), an investigated was carried out into the influence of public relations in Serbian companies on the following financial performance aspects: salary share in business revenue, productivity, efficiency, profitability, liquidity, profit margin (profit share in business revenue), and potential financial risks (exchange rate fluctuations, high interest rates and the like).
Research hypotheses
Based on the aforementioned theoretical studies, we propose the following hypotheses:
H1: Transformational and transactional leadership dimensions exert a statistically significant influence on financial performance in companies in Serbia.
H2: A company’s national origin has a moderating effect on the correlation between leadership dimensions and financial performance, in companies in Serbia.
H3: Company ownership structure has a moderating effect on the correlation between leadership dimensions and financial performance, in companies in Serbia.
Method
Survey Instruments (Measurements)
Transformational leadership behaviour. The research (Podsakoff, MacKenzie, Moorman,
& Fetter, 1990) used Transformational Leadership Behaviour Inventory (TLI), developed by Podsakoff et al. This questionnaire was used in the reference (MacKenzie et al., 2001).
The questionnaire contains six dimensions dealing with transformational leadership behavior: articulating a vision, providing an appropriate model, fostering the acceptance of group goals, having high performance expectations, providing individualized support and providing intellectual stimulation. The first three dimensions have high intercorrelations, so as a result they are merged into a single construct called the core transformational leader behavior (Podsakoff et al., 1990; MacKenzie et al., 2001). In this way, four dimensions of transformational leadership are defined (which are investigated in this paper), which are:
Core transformational leader behavior (three - item), High performance expectations (three - item), Supportive leader behavior (four - item) and Intellectual stimulation (four - item).
Transactional leadership behaviour. In this paper, transactional leadership behaviour measurement was carried out through two dimensions: contingent reward behaviour and contingent punishment behaviour. In the reference (Podsakoff et al., 1984; MacKenzie et al., 2001) a four - item Contingent Reward Behaviour Scale was used to measure contingent reward behaviour and a three - item Contingent Punishment Behaviour Scale (Podsakoff et al., 1984; MacKenzie et al., 2001) to measure contingent punishment behaviour. In this paper, the respondents carried out their evaluation of all leadership related items (transformational and transactional leadership behaviour) on seven-point Likert scales ranking from 1 (strongly disagree) to 7 (strongly agree). This model was used according to the reference (MacKenzie et al., 2001).
Financial performance. In selecting the financial performance aspects to be correlated to leadership in this study we were guided by the references (Tan & Litschert, 1994; Wang et al., 2003; Wang et al., 2011). These articles examined the following aspects of financial performance: profitability, sales growth, asset growth, market share, and competitive status
in the firm’s industry. The group of the said five financial performance aspects was extended by two more: productivity and salaries. Based on previous analysis we formed a seven-item financial performance set to be examined in this paper: FP1 - Productivity, FP2 - Profitability, FP3 - Market share, FP4 - Sales growth, FP5 - Competitive status, FP6 - Asset growth and FP7 - Employee salaries. All financial performance items were assessed by the respondents on five-point Likert scales. This was modelled on the references (Tan & Litschert, 1994; Wang et al., 2003; Wang et al., 2011).
Participants and Data Collection
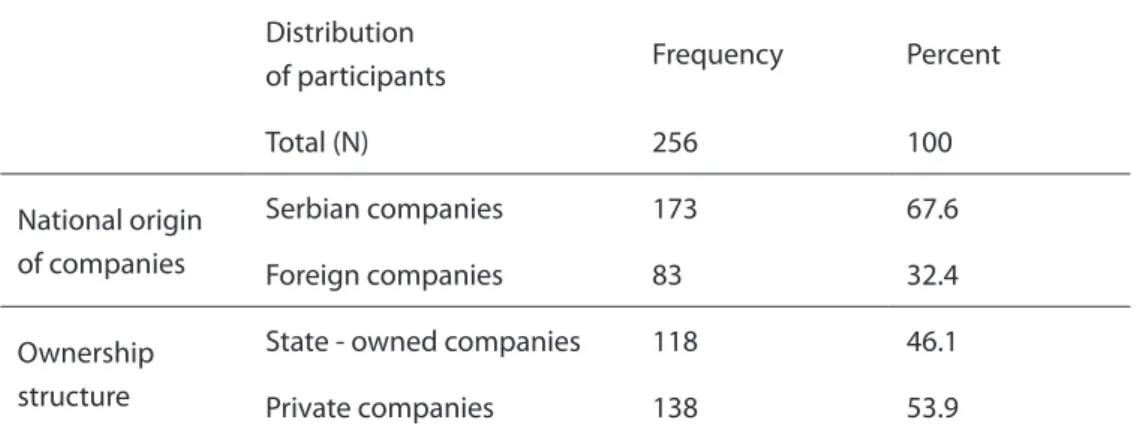
The research was carried out in Serbian companies. The survey was conducted by respondents (middle managers) completing a questionnaire. The questionnaire is composed of items for measuring the dimensions of the transformational leadership behavior, items for measuring the dimensions of the transactional leadership behavior and items for measuring financial performance. In addition, in the questionnaire there were questions related to general information on the respondents, including questions about the National origin of companies and Company ownership structure. The questionnaire completing was carried out at the respondents’ workplace. The examiner would present the distributed questionnaires to the middle managers, gave some general instructions and wait for them to complete the questionnaire. A total of N = 256 middle managers from 131 companies in Serbia completed the questionnaire. The correspondent distribution is presented in Table 1.
Distribution
of participants Frequency Percent
Total (N) 256 100
National origin of companies
Serbian companies 173 67.6
Foreign companies 83 32.4
Ownership structure
State - owned companies 118 46.1
Private companies 138 53.9
Table 1. Distribution of survey respondents
Results
Descriptive Statistics
The descriptive statistics for the leadership dimensions and financial performance are shown in Table 2. Cronbach’s alpha values are relatively high and range in the interval from α = 0.83 to α = 0.93.
Dimensions Short
name N Min. Max. Mean Cronbach’s
alpha Core transformational
leader behaviour L1 256 1.00 7.00 4.5 .93
High performance expecta-
tions L2 256 1.00 7.00 5.5 .83
Supportive leader behaviour L3 256 1.00 7.00 3.8 .87
Intellectual stimulation L4 256 1.00 7.00 4.1 .92
Contingent reward behaviour L5 256 1.00 7.00 3.9 .88 Contingent punishment be-
haviour L6 256 1.00 7.00 5.1 .88
Financial performance FP 256 1.00 5.00 3.4 .88
Valid N (listwise) 256
Table 2. Descriptive statistics
Correlational Analysis
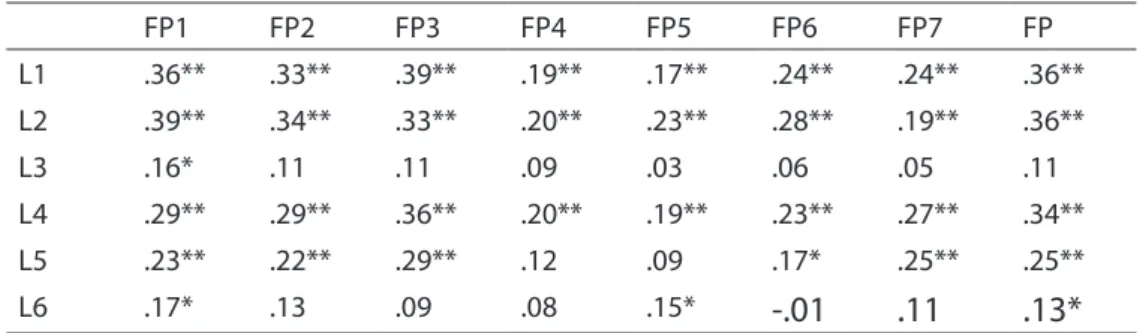
Table 3 shows the basic results: the correlations of all leadership dimensions and certain financial performance aspects, followed by the correlations of leadership dimensions and financial performance in total (FP construct). These results refer to a sample of a total of N = 256 respondents. In Table 3, statistically significant correlations are marked in the following way: *p<0.05; **p<0.01. As can be seen, out of a total of 48 correlations, there are 29 correlations with **p<0.01, 5 correlations with *p<0.05 and 14 correlations with no statistical significance.
FP1 FP2 FP3 FP4 FP5 FP6 FP7 FP
L1 .36** .33** .39** .19** .17** .24** .24** .36**
L2 .39** .34** .33** .20** .23** .28** .19** .36**
L3 .16* .11 .11 .09 .03 .06 .05 .11
L4 .29** .29** .36** .20** .19** .23** .27** .34**
L5 .23** .22** .29** .12 .09 .17* .25** .25**
L6 .17* .13 .09 .08 .15* -.01 .11 .13*
Table 3. Correlations of leadership dimensions and financial performance (Pearson’s Correlation)
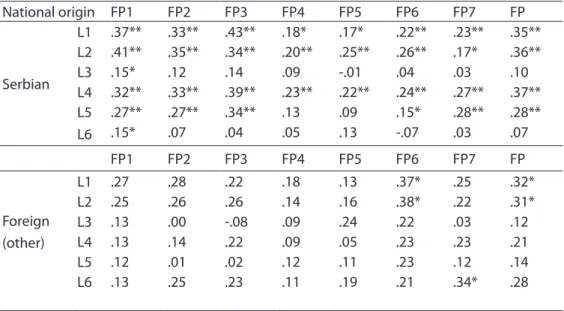
Table 4 shows the results of the examination of the moderating effect of National origin of companies on leadership influence on financial performance. In Serbian companies, out of a total of 48 correlations, there are 26 correlations with **p<0.01, 6 correlations with *p<0.05 and 16 correlations with no statistical significance. In foreign companies, out of a total of 48 correlations, there is no one correlation with **p<0.01, 5 correlations with *p<0.05 and 43 correlations with no statistical significance.
National origin FP1 FP2 FP3 FP4 FP5 FP6 FP7 FP
Serbian
L1 .37** .33** .43** .18* .17* .22** .23** .35**
L2 .41** .35** .34** .20** .25** .26** .17* .36**
L3 .15* .12 .14 .09 -.01 .04 .03 .10
L4 .32** .33** .39** .23** .22** .24** .27** .37**
L5 .27** .27** .34** .13 .09 .15* .28** .28**
L6 .15* .07 .04 .05 .13 -.07 .03 .07
FP1 FP2 FP3 FP4 FP5 FP6 FP7 FP
Foreign (other)
L1 .27 .28 .22 .18 .13 .37* .25 .32*
L2 .25 .26 .26 .14 .16 .38* .22 .31*
L3 .13 .00 -.08 .09 .24 .22 .03 .12
L4 .13 .14 .22 .09 .05 .23 .23 .21
L5 .12 .01 .02 .12 .11 .23 .12 .14
L6 .13 .25 .23 .11 .19 .21 .34* .28
Table 4. The moderating effect of National origin of companies on leadership influence on financial performance (Pearson’s Correlation)
The Chow test is used to determine whether the independent variables (leadership dimensions) have different impacts on dependent variables (performance measures) in different subgroups of the population (Chow, 1960; Dougherty, 2007). To test the moderating effect of National origin of companies, the Chow test analysis was used. Table 5 presents the regression coefficients of independent variables Li and the dependent variables FPi, as well as the value of F-statistic greater than the critical value of F = 2,252, according to the Chow test. In foreign companies, there is only one statistically more stronger correlation than in Serbian companies. All the other correlations are either statistically more stronger in Serbian companies (8 correlations), or statistically equally strong (39 correlations).
FP1 FP2 FP3 FP4 FP5 FP6 FP7 FP
L1
RS 195.569 240.061 235.688 271.197 299.953 274.964 257.721 140.813 RS1 144.101 184.064 184.266 198.246 240.229 221.209 203.631 110.69
RS2 48.074 54.846 49.565 71.469 58.996 51.508 52.044 29.44
F 2.225284 0.607032 1.000785 0.692331 0.306552 1.038153 1.008296 0.61413 L2
RS 190.147 238.235 249.499 270.344 292.41 270.279 263.424 140.246 RS1 137.991 181.393 199.648 196.791 232.664 217.094 208.826 109.975
RS2 48.582 55.511 48.591 72.373 58.589 51.27 52.887 29.631
F 2.413661 0.707907 0.639545 0.552377 0.500534 0.899115 0.82375 0.577626 L3
RS 218.8 265.471 276.018 278.874 308.843 291.057 273.166 159.314 RS1 162.811 203.11 221.506 203.559 247.566 232.022 214.284 125.252
RS2 50.87 59.512 51.672 73.244 56.567 56.905 55.517 32.394
F 3.01849 1.366885 1.309915 0.942714 1.951317 0.928885 1.571492 1.333164 L4
RS 204.949 245.313 243.302 269.86 296.991 276.516 253.489 142.235 RS1 148.923 184.272 192.154 194.698 234.907 219.132 198 109.298
RS2 50.887 58.313 49.489 73.154 59.923 56.699 52.627 31.468
F 3.240649 1.416938 0.865053 0.944581 0.923536 0.312909 1.438839 1.314906 L5
RS 212.913 255.816 256.689 277.461 306.75 284.067 257.287 151.285 RS1 154.616 190.575 199.305 201.837 245.688 226.847 197.763 116.486
RS2 51.053 59.508 52.024 72.754 59.361 56.594 54.741 32.231
F 4.437927 2.88847 2.68716 1.31694 0.702595 0.27828 2.386727 2.17573 L6
RS 218.169 264.696 277.311 279.852 302.092 292.169 270.384 158.682 RS1 162.628 205.232 225.42 204.706 243.359 231.232 214.374 125.887
RS2 50.815 55.737 49.252 72.839 57.9 57.065 49.201 30.312
F 2.78986 1.799455 1.210586 1.047333 0.348398 1.692255 3.25499 2.002945 Table 5. Results of the Chow test for moderator National origin of companies
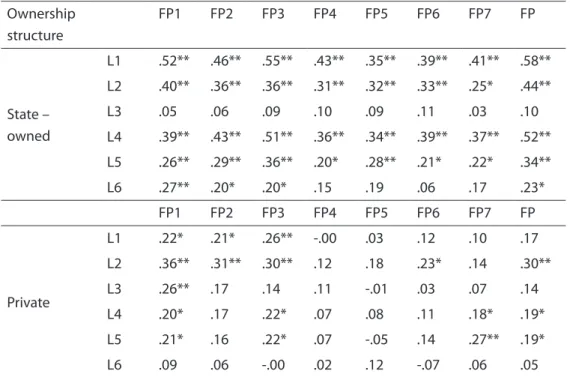
Table 6 shows the results of the examination of the moderating effects of Company ownership structure on leadership influence on financial performance. In state owned companies, out of a total of 48 correlations, there are 29 correlations with **p<0.01, 7 correlations with *p<0.05 and 12 correlations with no statistical significance. In private companies, out of a total of 48 correlations, there are 7 correlations with **p<0.01, 10 correlations with *p<0.05 and 31 correlations with no statistical significance.
Ownership structure
FP1 FP2 FP3 FP4 FP5 FP6 FP7 FP
State – owned
L1 .52** .46** .55** .43** .35** .39** .41** .58**
L2 .40** .36** .36** .31** .32** .33** .25* .44**
L3 .05 .06 .09 .10 .09 .11 .03 .10
L4 .39** .43** .51** .36** .34** .39** .37** .52**
L5 .26** .29** .36** .20* .28** .21* .22* .34**
L6 .27** .20* .20* .15 .19 .06 .17 .23*
FP1 FP2 FP3 FP4 FP5 FP6 FP7 FP
Private
L1 .22* .21* .26** -.00 .03 .12 .10 .17
L2 .36** .31** .30** .12 .18 .23* .14 .30**
L3 .26** .17 .14 .11 -.01 .03 .07 .14
L4 .20* .17 .22* .07 .08 .11 .18* .19*
L5 .21* .16 .22* .07 -.05 .14 .27** .19*
L6 .09 .06 -.00 .02 .12 -.07 .06 .05
Table 6. The moderating effect of Company ownership structure on leadership influence on financial performance and new product development (Pearson’s Correlation)
In order to test the moderating effect of company ownership structure, the Chow test analysis was used. Table 7 presents the regression coefficients of independent variables Li and the dependent variables FPi, as well as the value of F-statistic greater than the critical value of F = 2,252, according to the Chow test. In privately owned companies, there are two statistically stronger correlations than in state owned companies. All other correlations are either statistically stronger in state owned companies (21 correlations), or statistically equally strong (25 correlations).
FP1 FP2 FP3 FP4 FP5 FP6 FP7 FP L1
RS 195.569 240.061 235.688 271.197 299.953 274.964 257.721 140.813
RS1 64.294 94.76 86.946 94.283 110.28 92.415 100.318 44.803
RS2 124.859 140.134 141.871 162.521 182.11 177.781 150.033 88.852 F 4.27387 2.77164 3.78372 7.06188 3.25913 2.223453 3.70927 6.74803 L2
RS 190.147 238.235 249.499 270.344 292.41 270.279 263.424 140.246 RS1 73.872 103.899 108.676 104.421 112.345 97.238 112.393 54.427
RS2 114.03 132.182 138.414 160.267 176.65 171.031 148.303 83.08
F 1.505412 1.149622 1.228435 2.69244 1.488918 0.944052 1.318501 2.50979 L3
RS 218.8 265.471 276.018 278.874 308.843 291.057 273.166 159.314 RS1 87.995 119.373 124.208 114.176 124.489 107.821 119.939 66.512 RS2 122.002 142.314 148.959 160.61 182.285 180.441 150.718 89.741 F 5.28188 1.821963 1.315042 1.874506 0.849792 1.221701 1.168024 2.46834 L4
RS 204.949 245.313 243.302 269.86 296.991 276.516 253.489 142.235
RS1 74.357 97.788 92.348 100.126 110.613 92.884 103.399 48.779
RS2 125.58 142.08 144.563 161.823 181.228 178.448 146.623 88.23
F 3.15855 2.8602 3.39902 3.80527 2.223471 2.40732 1.747214 4.80608 L5
RS 212.913 255.816 256.689 277.461 306.75 284.067 257.287 151.285 RS1 82.133 109.453 108.67 110.801 116.001 104.504 114.178 59.376 RS2 125.389 142.478 144.181 161.795 181.841 177.016 140.506 88.305 F 3.27322 1.943032 1.912541 2.248712 3.76847 1.139962 1.287784 3.0749 L6
RS 218.169 264.696 277.311 279.852 302.092 292.169 270.384 158.682 RS1 81.811 115.097 120.336 112.726 121.123 108.834 116.591 63.674 RS2 130.134 145.881 151.842 162.469 179.644 179.745 150.91 91.284 F 3.70013 1.795048 2.37623 2.132241 0.555081 1.567474 1.357969 3.02807 Table 7. Results of the Chow test for moderator Company ownership structure
Discussion
Within descriptive statistics (Table 2), it is important to give consideration to the mean values of individual dimensions (observing the available evaluation items range: min - max).
Since the total average grade for the four transformational leadership dimensions is 4.4966, and the total average grade for the two transactional leadership dimensions is 4.5464, it can be concluded that in Serbian companies under investigation, transactional leadership has a slightly larger share than transformational leadership. The highest average grade of all leadership dimensions is evidenced for the L2 - High Performance Expectations dimension.
Similarly, the L6 - Contingent Punishment Behaviour dimension also has a high grade.
The lowest average grade is evidenced for the L3 - Supportive Leader Behaviour dimension, followed by L5 - Contingent Reward Behaviour. This suggests that management in Serbia is task and result oriented, with the emphasis on punishment, while rewards and leadership support are less frequent. Transformational leaders show little interest in employee emotions, while transactional leaders rarely reward subordinates. The dimension of FP - Financial Performance has almost average value.
Table 3 shows the basic results of the correlational analysis in this study. The high percentage of statistically significant correlations (71%) clearly indicates the statistically significant effect of leadership dimensions on financial performance, in Serbian companies. Thus, hypothesis H1 is confirmed. The leadership dimensions with the strongest correlations are L1 - Core Transformational Leader Behaviour and L2 - High Performance Expectations. On this basis, it can be concluded that the most significant impact on the business performances (financial ratios) has visionary and strategic components in the work of top managers, as well as its focus on achieving high performance. On the other hand, the strongest correlations between leadership dimensions and the individual financial performance aspects are evidenced for FP1 - Productivity and FP3 - Market Share and leadership dimensions L1 - Core Transformational Leader Behavior and L2 - High Performance Expectations. Significant correlations are also evidenced for FP - Financial Performance in total (dimension). Observed individually, the three strongest correlations, listed in order starting from the strongest, are as follows: 1. L1 - Core Transformational Leader Behaviour and FP3 - Market Share, 2. L2 - High Performance Expectations and FP1 - Productivity, 3. L2 - High Performance Expectations and FP - Financial Performance in Total (dimension). Analysis of the correlations suggests a simple and logical conclusion: the strategy and vision of leaders significantly influence the market share, while striving for results and performance directly affects productivity. These correlations are the strongest at the correlation analysis.
As it can be seen from Table 3, the correlations between L3 - Supportive Leader Behaviour leadership dimension to all the performance aspects under consideration are very weak. This can be explained by the low value of this dimension (it has already been stated that this is the dimension with the lowest grade of all leadership dimensions in companies in Serbia). The improvement of this dimension is likely to increase its correlation to financial performance.
The analyses presented below will further support this claim.
Examined within the context of the transformational and transactional leadership division, transformational leadership can be said to be correlated to financial performance with the exception of the L3 - Supportive Leader Behaviour segment. Transactional leadership
dimension L5 - Contingent Reward Behaviour is correlated to financial performance. The findings were somewhat different in (Howell, Neufeld, & Avolio, 2005), where transformational leadership is viewed as a positive predictor of unit performance, while transactional leadership (the Contingent Reward Behaviour segment) has no effect on performance. However, according to this reference, in some cases there can be positive relation between performance and Contingent Reward Behaviour (for example, the physical distance between a leader and his/her followers). It seems that, due to the poor financial situation and low standard of living of employees, rewards, at the moment, nevertheless yield better performance results in Serbian companies. However, this study has similar findings to those in the references (Elenkov, 2002;
Bass et al., 2003). Namely, according to (Elenkov, 2002), transformational leadership positively predicts organizational performance in Russian companies. This influence is stronger than that of transactional leadership, but transactional leadership is also positively related to performance. Moreover, according to (Bass et al., 2003), both transformational leadership and transactional leadership (the Contingent Reward Behaviour segment) positively affect the performance of military units. In companies in Serbia, there is a similar influence of transactional leadership in the reward segment. This can be explained by the fact that to a soldier any reward (leave of absence, permission to go out, etc.) means a great deal, just as it does to employees with a low standard of living (companies in Serbia).
The findings presented in Table 4 and Table 5 confirms the moderating effect of National origin of companies on some correlations between leadership dimensions and financial performance, in companies in Serbia. Thus, hypothesis H2 is partially confirmed.
Generally, based on Table 4, the following can be concluded: the correlations between leadership dimensions and financial performance are much stronger in Serbian companies than in foreign ones. A possible explanation for this can be found in the fact that foreign companies in Serbia have clearly set goals and tasks, so generally speaking, it could be stated that the management system is better organised in foreign organisations than in their Serbian counterparts. Under such conditions leadership can, but does not have to, affect financial performance. In foreign companies in Serbia, a high level of performance is inherent and leadership alone is not enough to achieve high outcomes and change the desired management system.
On the other hand, there are two possible explanations for the significant influence of leadership on performance in Serbian companies. Firstly, in most cases, Serbian companies have less stable organisational systems in comparison to foreign ones, so, under such circumstances, weak leadership has a strong negative effect on performance. Secondly, it is not rare in Serbian companies to have an ambitious and capable individual who decides ‘to
take matters into his own hands’ and, owing to his leadership abilities as such, achieve high business performance. There are far fewer opportunities for such individual initiatives in foreign companies. This does not imply that in their countries of origin (for the purposes of this study they are referred to as foreign), leadership has no influence on performance. This only suggests that, in foreign companies in Serbia, local management mostly has no significant role in regard to strategic goals and plans, and consequently in achieved performance.
However, Table 5 shows that there are only nine pairs in which the moderator effect of National origin of the companies was confirmed. In Serbian companies, there are eight more statistically stronger correlations than in foreign companies. According to the results given in Table 5, these findings are most pronounced in FP1 - Productivity. At the same time, this result is consistent with the results of the basic correlation analysis (Table 2). Among the dimensions of leadership, where there is a significant moderator effect of the National origin of companies, the L5 - Contingent Reward Behavior segment can be extracted. This result is also consistent with the results of the basic correlation analysis (Table 2), as previously was explained. The fact that foreign companies show only one correlation of statistically higher significance than Serbian companies deserves special attention. This is the relation between Contingent Punishment Behaviour and Employee Salaries. One possible explanation may be that foreign companies in Serbia offer significant income opportunities, but expect a high level of company loyalty in exchange.
The findings presented in Table 6 and Table 7 confirms the moderating effect of Company ownership structure on some correlations between leadership dimensions and financial performance, in companies in Serbia. Thus, hypothesis H3 has been partially confirmed. Generally, based on Table 6, the following can be concluded the correlation of leadership dimensions and financial performance is stronger in state owned companies than in private ones.
A similar explanation to that offered for the moderating effect on Serbian and foreign companies may also apply to the confirmed moderating effect of Company ownership structure in the relation between leadership dimensions and financial performance. The explanation given for Serbian companies may be applied to state owned companies, while that given for foreign ones may hold true for private companies. There are similarities, with somewhat stronger correlations between leadership and the observed performance aspects in private with respect to foreign companies (based on the results given in Tables 4 and 6).
Observing all companies in Serbia, the findings for these two moderators indicate that the influence of leadership on financial performance has the greatest significance for Serbian state-owned companies. Commentaries about Serbian companies (as opposed to foreign
ones) are the most pronounced here. Yet another aspect of interpreting this phenomenon deserves to be pointed to. Namely, such findings may partially be explained due to the fact that the ‘custom’ of appointing leaders through political power still survives in Serbian state-owned companies. Such leaders often have political strength and possibilities, so some companies have good business results as a consequence of this power, rather than as an actual reflection of their market success. At the same time, this does not diminish the importance and role of transformational leaders in state-owned enterprises. It may be better to say that a transformational leader has a vision that is presented to employees, and employees know that his “political power” (for example, to get a favorable low interest rate loan from the state development bank in order to invest in production modernization), allows easier and more certain realization of this vision. This knowledge gives employees confidence that the set goal can be realized, which, according to Locke’s theory of motivation is an important motivator for achieving high performance.
On the basis of Table 7, it can be seen that there are 23 pairs where the moderator effect of the Company ownership structure was confirmed. At state owned companies, there are 21 statistically stronger correlations than at private companies. Here are valid the set conclusions. According to the results in Table 7, these findings are most pronounced at FP1 - Productivity and FP - Financial Performance in total (dimension). At the same time, as at the previous moderator, this result is consistent with the results of the basic correlation analysis (Table 2). Among the dimensions of leadership, where there is a significant effect of the moderator effect of Company ownership structure, strongly distinguish L1 - Core Transformational Leader Behavior and L4 - Intellectual stimulation.
The pronounced impacts of the dimensions L1 - Core Transformational Leader Behavior on financial indicators at state owned companies, can be understood in accordance with the explanations given in the analysis of both moderators: Serbian state-owned companies have less stable strategy and vision, and any change (positive or negative) has a greater impact on the overall performance . When it comes to size L4 - Intellectual stimulation, its influence at state owned enterprises on the financial indicators can be understood as follows: in private enterprises more attention is paid to the work activities of the company, in other words, to the owner of the company (director) it is not important what degree has his employee, but what and how he can do. On the other hand, at state-owned companies the formal education is more important (primarily through the function and salary), and the employee is more stimulated for further progress. This leads to a higher concentration of knowledge in the companies, but also to increased job satisfaction of employees, and the result of all this appears in a positive impact on financial performances.
In private companies, there are only two correlations that are statistically more stronger than in state owned ones. These two correlations are between L3 - Supportive Leader Behaviour to FP1 - Productivity and L3 - Supportive Leader Behaviour to FP - Financial Performance. It is obvious that the influence of the L3 - Supportive Leader Behaviour dimension is the exception in this analysis. It is a dimension of leadership with a minimum score (Table 2). Generally speaking, the leaders support is often absent. However, at state- owned companies, employees are somewhat “lulled” and “spoiled” and the support of leaders is considered as “something normal” and “something that implies”. In contrast, employees in private companies earn the leaders support harder, so they appreciate it more.
This support, either leads to better financial performance or it was created precisely as a result of satisfaction of the owner with the business performances (financial performances).
However, this relation is more pronounced in the private companies. In addition, a strong correlation between Contingent Reward Behaviour and Employee Salaries should not go unobserved. This can be explained in the following way: in private companies in Serbia, rewards are mostly expressed in material terms, through salaries and other forms of monetary income.
The obtained moderations may be observed from another angle. It was stated in the introduction that some studies support the increased influence of leadership under conditions of crisis, uncertainty and change (Waldman et al., 2001; House et al., 1991). There is an analogy to the findings presented here, where higher uncertainty appears in Serbian and state-owned companies. Uncertainty appears as a result of transitional conditions, changes in the environment, competitive position and employee standard of living. Serbian and state- owned companies are those which suffer the most from such a reality.
Conclusion
Transactional leadership has a slightly higher share in companies in Serbia in comparison to transformational leadership. Transformational leadership is pronouncedly weaker in the Supportive Leader Behaviour segment, while transactional is weaker in the Contingent Reward Behaviour segment. It can be said that the leaders in the companies in Serbia show low level of supportive behavior and use penalties more than rewards. These are the consequences of a high unemployment rate and low standards of living of employees, who are forced to work under these conditions.
The basic analysis has generally demonstrated that, in companies in Serbia, there is a statistically significant influence of leadership dimensions on financial performance. There
is a link between transformational leadership and financial performance with the exception of the Supportive Leader Behaviour segment. Transactional leadership is related to financial performance, but only in the Contingent Reward Behaviour segment. Based on these findings it is clearly recommended that transformational leaders should improve Supportive Leader Behaviour, while transactional ones should improve the Contingent Reward Behaviour segment. This will lead to better business outcomes.
National origin of companies and Company ownership structure has a moderating effect on some correlations between leadership dimensions and financial performance. Based on the findings it can be concluded that hypothesis H1 is confirmed, while hypotheses H2 and H3 have been confirmed only partially. At Serbian state-owned companies the strongest effect is between the leadership influences on financial performances. These companies have less stable visions and strategic plans, so every impact of leadership, positive or negative, have stronger influence on their financial performances and, consequently this affects the overall business.
The application of the findings depends, in the first place, on the leaders in companies in Serbia. They should develop an awareness of the importance of leadership, and of their own role in business operations and numerous aspects of business, including financial performance. This can be achieved through the education of current, potential and future leaders. This study will contribute to the improvement of leadership in companies in Serbia, and consequentially numerous other aspects of business.
The results obtained in this study are significantly influenced by the transition conditions in Serbia. These conditions are characterized by: high unemployment, fear of job loss, the privatization of state enterprises, entry of foreign companies on the Serbian market, low standard of living, and cheap labor force. A similar situation exists in many countries of Eastern Europe, which are still undergoing the process of transition. Because of this, the results of research on the effect of leadership on financial performances in companies in Serbia can be considered representative for a larger number of countries in Eastern Europe.
Therefore, the results presented in this paper are of theoretical, and of practical importance for researchers, top managers and potential investors.
References
Ahearne, M. – Mathieu, J. – Rapp, A. (2005): To empower or not to empower your sales force? An empirical examination of the influence of leadership empowerment behavior on customer satisfaction and performance. Journal of Applied Psychology, 90(5), 945-955.
Aragón-Correa, J.A. – García-Morales, V.J. – Cordón-Pozo, E. (2007): Leadership and organizational learning’s role on innovation and performance: Lessons from Spain.
Industrial Marketing Management, 36(3), 349-359.
Bacacsi, Gy. – Takacs, S. – Kracsonyi, A. – Imrek, V. (2002): Eastern European Cluster:
tradition and transition. Journal of World Business, 37, 69-80.
Barling, J. – Weber, T. – Kelloway, E.K. (1996): Effects of transformational leadership training on attitudinal and financial outcomes: A field experiment. Journal of Applied Psychology, 81(6), 827-832.
Bass, B.M. (1985): Leadership and performance beyond expectations. New York: Free Press.
Bass, B.M. – Avolio, B.J. – Jung, D.I. – Berson, Y. (2003): Predicting unit performance by assessing transformational and transactional leadership. Journal of Applied Psychology, 88(2), 207-218.
Bryman, A. (1992): Charisma and leadership in organizations. London: Sage.
Burns, J.M. (1978): Leadership, New York: Harper and Row.
Cannella, A.A.JR. – Monroe, M.J. (1997): Contrasting perspectives on strategic leaders:
Toward a more realistic view of top managers. Journal of Management, 23(3), 213-237.
Conger, J. A. – Kanungo, R. N. (1987): Toward a behavioral theory of charismatic leadership in organizational settings. Academy of Management Review, 12(4), 637-647.
Chow, G.C. (1960): Tests of Equality Between Sets of Coefficients in Two Linear Regressions.
Econometrica 28(3), 591–605.
Dougherty, Ch. (2007): Introduction to Econometrics. 3rd ed., Oxford University Press, p. 194.
Elenkov, D.S. (2002): Effects of leadership on organizational performance in Russian companies. Journal of Business Research, 55(6), 467-480.
Ensley, M.D. – Pearce, C.L. – Hmieleski, K.M. (2006): The moderating effect of environmental dynamism on the relationship between entrepreneur leadership behavior and new venture performance. Journal of Business Venturing, 21(2), 243-263.
Eubanks, D.L. – Mumford, M.D. (2010): Leader errors and the influence on performance: An investigation of differing levels of impact. The Leadership Quarterly, 21(5), 809-825.
Hofmann, D.A. – Jones, L.M. (2005): Leadership, Collective Personality, and Performance.
Journal of Applied Psychology, 90(3), 509-522.
House, R.J. (1977): A 1976 theory of charismatic leadership. In Leadership: The Cutting Edge.
Eds. James G. Hunt & Lars L. Larson. Carbondale: Southern Illinois University Press.
House, R.J. – Hanges, P.J. – Javidan, M. – Dorfman, P.W. – Gupta. V. (2004): Leadership, culture and organizations: The GLOBE study of 62 societies. Thousand Oaks, CA: Sage.
House, R.J. – Shamir, B. (1993): Toward the integration of transformational, charismatic, and visionary theories? In Leadership theory and research: perspectives and directions. Eds.
Martin M. Chemers and Roya Ayman. San Diego: Academic Press, pp. 81 - 107.
House, R.J. – Spangler, W.D. – Woycke, J. (1991): Personality and charisma in the U.S.
presidency: a psychological theory of leader effectiveness. Administrative Science Quarterly, 36(3), 364-396.
Howell, J.M. – Neufeld, D.J. – Avolio, B.J. (2005): Examining the relationship of leadership and physical distance with business unit performance. The Leadership Quarterly, 16(2), 273-285.
Kim, W.G. – Brymer, R.A. (2011): The effects of ethical leadership on manager job satisfaction, commitment, behavioral outcomes, and firm performance. International Journal of Hospitality Management, 30(4), 1020-1026.
Koene, B.A.S. – Vogelaar, A.L.W. – Soeters, J.L. (2002): Leadership effects on organizational climate and financial performance: Local leadership effect in chain organizations. The Leadership Quarterly, 13(3), 193-215.
Lieberson, S. – O’Connor, J.F. (1972): Leadership and organizational performance: A study of large corporations. American Sociological Review, 37(2), 117-130.
Ling, Y. – Simsek, Z. – Lubatkin, M.H. – Veiga, J.F. (2008a): The impact of transformational CEOs on the performance of small- to medium-sized firms: Does organizational context matter? Journal of Applied Psychology, 93(4), 923-934.
MacKenzie, S.B. – Podsakoff, Ph.M. – Rich, G.A. (2001): Transformational and transactional leadership and salesperson performance. Journal of the Academy of Marketing Science, 29(2), 115-134.
Meindl, J.R. – Ehrlich, S.B. – Dukerich, J. M. (1985): The romance of leadership. Administrative Science Quarterly, 30(1), 78-102.
Nikolić, M. – Savić, M. – Ćoćkalo, D. – Spasojević - Brkić, V. – Ivin, D. (2011): The impact of Serbian public relations on economic indices, Public Relations Review, 37(3), 332-335.
Pfeffer, J. (1977). The ambiguity of leadership. Academy of Management Review, 2, 104−112.
Podsakoff, Ph.M. – MacKenzie, S.B. – Moorman, R.H. – Fetter, R. (1990): Transformational leader behaviors and their effects on followers’ trust in leader, satisfaction, and organizational citizenship behaviors. The Leadership Quarterly, 1(2), 107-142.
Podsakoff, Ph.M. – Todor, W.D. – Grover, R.A. – Huber, V.L. (1984): Situational moderators of leader reward and punishment behaviors: fact or fiction? Organizational Behavior and Human Performance, 34(1), 21-63.
Steyrer, J. – Schiffinger, M. – Lang, R. (2008): Organizational commitment - A missing link between leadership behavior and organizational performance? Scandinavian Journal of Management, 24(4), 364-374.
Tan, J.J. – Litschert, R.J. (1994): Environment-strategy relationship and its performance implications: An empirical study of the Chinese electronics industry. Strategic Management Journal, 15(1), 1-20.
Thomas, A. B. (1988): Does leadership make a difference to organizational performance?
Administrative Science Quarterly, 33(3), 388−400.
Tosi, H.L. – Misangyi, V.F. – Fanelli, A. – Waldman, D.A. – Yammarino, F.J. (2004): CEO charisma, compensation, and firm performance. The Leadership Quarterly, 15(3), 405-420.
Waldman, D.A. – Javidan, M. – Varella, P. (2004): Charismatic leadership at the strategic level:
A new application of upper echelons theory. The Leadership Quarterly, 15(3), 355-380.
Waldman, D.A. – Ramirez, G.G. – House, R.J. – Puranam, P. (2001): Does leadership matter?
CEO leadership attributes and profitability under conditions of perceived environmental uncertainty. Academy of Management Journal, 44(1), 134-143.
Wang, D. – Tsui, A.S. – Zhang, Y. – Ma, L. (2003): Employment relationships and firm performance: evidence from an emerging economy. Journal of Organizational Behavior, 24(5), 511–535.
Wang, H. – Tsui, A.S. – Xin, K.R. (2011): CEO leadership behaviors, organizational performance, and employees’ attitudes. The Leadership Quarterly, 22(1), 92-105.
Yukl, G.A. (2008): How leaders influence organizational effectiveness. The Leadership Quarterly, 19(6), 708-722.
Zhu, W. – Chew, I.K.H. – Spangler, W.D. (2005): CEO transformational leadership and organizational outcomes: The mediating role of human–capital-enhancing human resource management. The Leadership Quarterly, 16(1), 39-52.
ACKNOWLEDGMENT This paper is a part of the research project „The impact of organizational culture and leadership on some organizational and business performances in companies in Serbia”, which is funded by the Provincial Secretariat for Science and Technological Development within the action „Right for first chance”.
MILAN NIKOLIĆ was born on 21 September 1971 in Zrenjanin, Serbia. He defended the PhD thesis entitled:
“Quantitative model for selecting a new product with research into relevant criteria”, on 3 december 2004 at the Mechanical faculty University of Belgrade at the department of Industrial engineering. He has been working at the Technical faculty “Mihajlo Pupin” in Zrenjanin (University of Novi Sad) since 1 October 1998 as assistant teacher. In September 2015 Milan Nikolić got the title of full time professor at the Technical faculty “Mihajlo Pupin” in Zrenjanin, University of Novi Sad, Serbia. He teaches the subjects: Strategic management, Public relations, Decision theory and Leadeship. The basic fields of interest of Milan Nikolić are using quantitative methods in management with a particular stress on the business decision making, product development, organizational culture and public relations.
JELENA VUKONJANSKI was born on 13th September 1979 in Zrenjanin, Serbia. In September 2005 she graduated at Technical Faculty “Mihajlo Pupin” in Zrenjanin at the Department of Management. She defended the PhD thesis in 2013 at Technical faculty
“Mihajlo Pupin” in Zrenjanin at the Department of management. The PhD thesis was titled: Relations of organizational culture dimensions and various organizational outcomes in organizations in Serbia.
Areas of research and theoretical interest include Organizational Culture, Human Resource Management and Knowledge Management.
LÁSZLÓ SZABÓ was born on 6th September 1979 in Nagykanizsa, Hungary. He received his Agricultural Mechanical Engineering MSc and Teacher of Engineering MSc degree from Szent István University of Gödöllő in 2005. His career he worked in logistics area as logistics project manager. From April 2011 he is Assistant with the Faculty of Business and Economics, University of Pannonia in Nagykanizsa, Hungary. He has special interest in logistics, warehouse management, logistics services, logistics centres. He teaches Logistics, Warehouse Management, Material Handling, Production Management.
MILENA NEDELJKOVIĆ was born on 28th October 1980 in Belgrade, Serbia. In 2006 she finished her master studies in Human Resource Management at the Faculty of Technical Sciences, University of Novi Sad, Serbia. She defended the PhD thesis in 2009 in Human Resource Management at the Faculty of Technical Sciences, University of Novi Sad, Serbia. The PhD degree thesis was titled: Investigation of work motivation and job satisfaction in professional organizations during transition. From 2014 to present she works as an Associate Professor at the Faculty of Sciences, Department of Geography, Tourism and Hotel Management, University of Novi Sad, Serbia. Areas of research and theoretical interest include:
HR Management, Organizational Behavior, Work motivation, Job satisfaction, Organizational communication, GLOBE model of national culture.
EDIT TEREK 1was born on 21st March 1986 in Zrenjanin, Serbia. In September 2008 she graduated at Tehnical Faculty “Mihajlo Pupin” in Zrenjanin, Department of Management. After graduating she continued with her studies on Master degree in Business communication. From November 2010 she works at Tehnical Faculty “Mihajlo Pupin” in Zrenjanin, University of Novi Sad, Serbia as an assistant on the subjects: Strategic management, Public relations, Benchmarking, Leadership. From 2012 she is a PhD student at University of Novi Sad Technical faculty “Mihajlo Pupin”, Zrenjanin.
Areas of research and theoretical interest include: Public relations, Organizational Culture and Leadership.
1 Corresponding author e-mail: edit@tfzr.uns.ac.rs