The third chapter assesses the readiness of the Croatian economy to join the EU and EMU. Candidate countries are obliged to adopt national programs for implementing the acquis, and the EU regularly assesses the progress made in implementing these programmes.
Evaluation of the European Commission from April 2002
European Commission assessment from April 2002. EU) are considered non-competitive on the EU market. In the development of the energy sector, Croatia has a potentially key role in the region.
The functioning of the market and the competitiveness of the economy
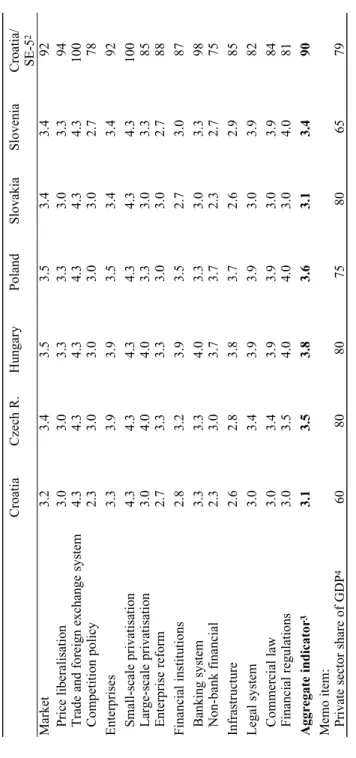
In particular, there is a lack of capacity, in terms of staff numbers and the right expertise needed for the adaptation of many sectors to European standards and the gradual implementation of the acquis (ibid. p. 19). Significant progress still needs to be made in many areas, for example consumer protection, industrial standards, the implementation of market competition legislation, the regulation of state aid to industry. According to the overall transition indicator, Croatia lags behind the average of the selected transition economies by about 10% and is comparable to Slovakia.
The low value of this indicator reflects high barriers for new firms to enter the market and inadequate implementation of legislation and competition policy in the market for firms that have a dominant position in the market. In the category of non-banking financial institutions, Croatia remains up to 25% behind the average of applicant countries. A simple regression shows that for every 10 percentage point increase in the share of the private sector in GDP, the aggregate transition indicator increases by 0.3, i.e., by one tenth of the average value of this indicator in 2000 (Figure 1). xi.
Convergence to the EMU
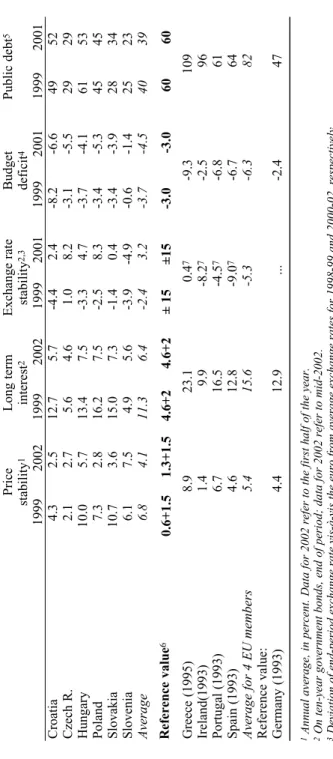
Since then, there has been progress in some reform areas in Croatia, but also in the other CE economies, so the relative position of Croatia has probably not improved significantly. 6Inflation and interest rate data for three euro countries with the lowest inflation (in first half of 2002, Germany and Finland (1.3%), and Austria and Belgium (1.4%); other criteria based on the Maastricht Treaty. One must also point out that the transition economies have to meet much stricter inflation and interest rate criteria than Ireland, Portugal and Spain in the mid-nineties.
At the time, inflation and interest rates in the reference country Germany were significantly higher due to macroeconomic pressures following German reunification. Compared to the other CE countries, Croatia is in a healthy position in terms of three criteria: inflation (it had the lowest inflation in the first half of 2002, only 2.5%), long-term interest rates and exchange rate stability. Another cause for concern is the high public debt (52% of GDP), especially if you take into account the rapid increase in debt in the second half of the 90s.
IDENTIFICATION OF MACROECONOMIC VULNERABILITIES
Croatia had a deficit of up to 6.6% of GDP, the highest in Central Europe in 2001. xii However, the transition economies were again much closer to meeting this criterion than Greece, Ireland, Portugal and Spain five years before. to join the EMU. However, together with the Czech Republic and Poland, Croatia must undertake significant fiscal adjustments: the budget deficit must be cut by more than 3.5% of GDP. Therefore, although Croatia meets the macroeconomic criteria for EMU membership at the moment (with the exception of the budget deficit), the question is whether the current macroeconomic performance is sustainable in the medium term.
As Croatia and the other CE countries also face high balance of payments and fiscal deficits, and capital inflows create more or less constant pressure on exchange rates and monetary policy, the question arises whether they too will meet a similar fate. , regardless of the high degree of macroeconomic stability already achieved. To answer this question, it is necessary to establish the actual degree of macroeconomic stability and the main points of vulnerability at the macroeconomic level. This paper addresses four issues: the prospects for rapid and sustainable long-term growth, the prospects for low inflation; external vulnerability and the dynamics of budget deficits and public debt.
Outlook for long-term growth
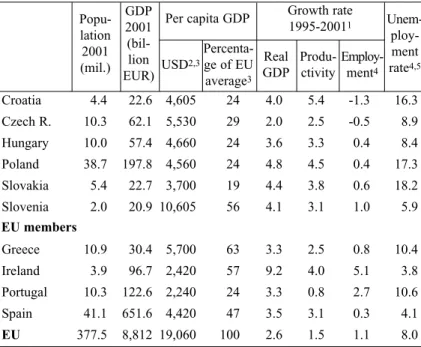
With an investment rate that is 6% of GDP lower compared to the Czech Republic and 9% lower compared to Slovakia, Croatia had achieved a GDP growth rate that is twice as high as in Czech Republic and almost the same as in Slovakia. . Along with Poland and Hungary, Croatia has achieved a similar investment efficiency as the USA in 1993-99, i.e. an average growth rate of 4% with an investment rate of around 20% of GDP ( Andersen, Ho and Miha-lejk, 2001). Since the efficiency of investment in the EU is significantly lower (with an investment rate of 20% of GDP, the EU achieved an average growth rate of only 2.5% per year during 1993-99), there are prospects of good that Croatia will accelerate its real convergence with the EU compared to other EC countries, if it increases the investment rate in the medium term.
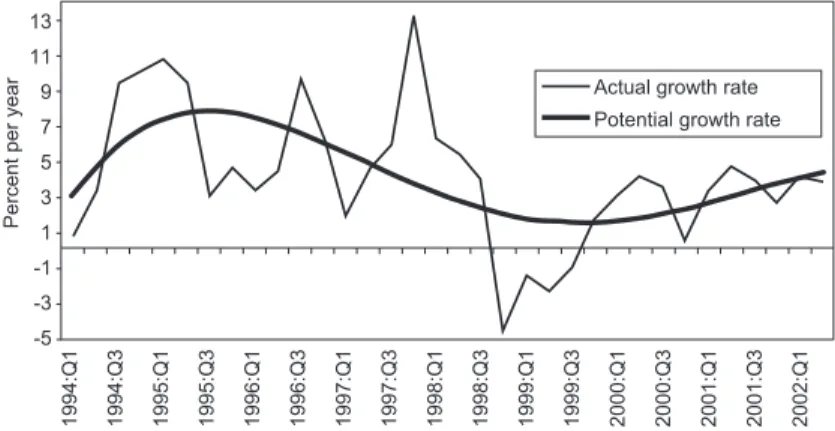
A previous article by this author showed that Croatia, with an average growth rate of 5.5%, could double its current real per capita income to USD 10,000 in the next 13 years, reaching 50% ( instead of 33% at the time of writing). today) of the average per capita income of Greece, Ireland, Portugal and Spain (Mihaljek, 2000). To determine whether this “desirable” growth rate is close to the current estimate of the potential growth rate, we used additional data for the period from the end of 1998 through the first quarter of 2002 (Exhibit 3). The results show that even with the 1999 recession and downward revisions to GDP growth rates, the potential growth rate from 1994 to mid-2002 was almost 5%.xv Similar potential growth rates were also found for other CE countries (Table 4). and range from 3.5% for the Czech Republic to 5-6% for Slovenia.

Outlook for inflation
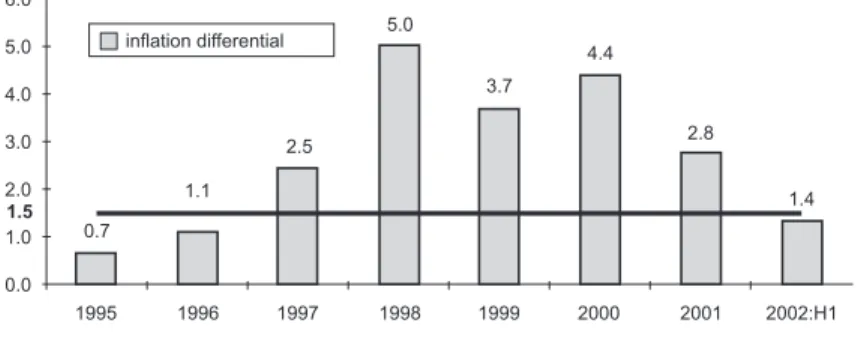
If CE countries have difficulty meeting the inflation criterion, the reason will likely be bad economic policies and not the operation of the Balassa-Samuelson effect. For the time being, Croatia meets the inflation criterion relatively comfortably compared to other CE countries; this criterion was met in the first half of 2002 and in Figure 4). However, we should not forget that Croatia is still experiencing significant adjustments in relative prices in the protected sectors (energy, real estate, healthcare, education).
External stability
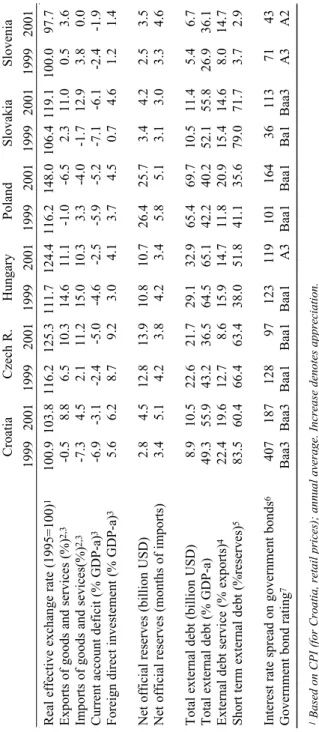
At the end of 2001, disposable foreign exchange reserves of the SNB covered more than five months of imports of goods and services, the same as in Poland. However, foreign debt and credit rating indicators are less favorable than those of the other CE countries, with the exception of Slovakia. The public sector is the largest debtor (43% of total external debt); followed by the non-financial sector (27%) and domestic commercial banks (19%); while 10% of the foreign debt stems from direct investment.
This debt structure provides some room for reducing total indebtedness in the medium term without negative consequences for economic growth. This indicator is even more unfavorable in the Czech Republic and Slovakia (75-80% of reserves) and reveals potential problems with servicing short-term debt in the event of a sudden depreciation of the domestic currency. Together with Slovakia, the credit rating of Croatia's sovereign debt is the lowest in the region and lies on the border between speculative and mature investment forms.
The budget deficit and the public debt
The financial markets, on the other hand, view large deficits with suspicion, regardless of the possible justification for temporarily higher deficits in the transition economies. In both cases, the key question will be whether deficit reduction is sustainable in the long term. And to ensure that the level of debt is reduced to less than 50% of GDP in the long term, the budget must be adjusted.
Real shocks, such as a slowdown in global economic growth and negative trends in international capital markets, would further complicate such negative dynamics.xvii. Since the beginning of the pension reform, there is no reason why this ratio should not improve. According to the regulations, pension funds must invest the majority (50%) of the collected contributions in government bonds.
CONCLUSION
Another common feature of many assessments is the superficiality in the analysis of Croatia's initial position vis-à-vis other applicant countries. For this reason, one of the basic goals of this paper was to more fully analyze the economic importance of the criteria for EU and EMU membership and objectively compare the initial positions of Croatia and other EC countries. For this reason, great attention has been paid to the international comparability of statistical data and the accuracy of economic argumentation.
The purpose of the entire convergence process is to achieve a gradual approximation of the level of income per per capita in the countries of the region to the average of the less developed members of the EU. In the next few years, however, Croatia still has to deal with a significant adjustment in the relative prices of energy, rents, services, healthcare and education. An even greater challenge for macroeconomic policy and the public sector in general will lie in the reduction of the budget deficit and the stabilization of the public debt.
LITERATURE
Available at: [http://europa.eu.int/comm/economyfinance/publications/enlargement_papers/2002/elp08en.pdf]. Available at: [http://europa.eu.int/comm/economyfinance/publications/european_economy/public finances2002_en.htm].