On: 21 May 2015, At: 05:38 Publisher: Routledge
Informa Ltd Registered in England and Wales Registered Number: 1072954 Registered office: Mortimer House, 37-41 Mortimer Street, London W1T 3JH, UK
Click for updates
Post-Communist Economies
Publication details, including instructions for authors and subscription information:
http://www.tandfonline.com/loi/cpce20
Austerity and growth in Central and Eastern Europe: understanding the link through contrasting crisis management in Hungary and Latvia
Dóra Győrffya
a Péter Pázmány Catholic University, Budapest, Hungary Published online: 21 May 2015.
To cite this article: Dóra Győrffy (2015) Austerity and growth in Central and Eastern Europe:
understanding the link through contrasting crisis management in Hungary and Latvia, Post- Communist Economies, 27:2, 129-152, DOI: 10.1080/14631377.2015.1026682
To link to this article: http://dx.doi.org/10.1080/14631377.2015.1026682
PLEASE SCROLL DOWN FOR ARTICLE
Taylor & Francis makes every effort to ensure the accuracy of all the information (the
“Content”) contained in the publications on our platform. However, Taylor & Francis, our agents, and our licensors make no representations or warranties whatsoever as to the accuracy, completeness, or suitability for any purpose of the Content. Any opinions and views expressed in this publication are the opinions and views of the authors, and are not the views of or endorsed by Taylor & Francis. The accuracy of the Content should not be relied upon and should be independently verified with primary sources of information. Taylor and Francis shall not be liable for any losses, actions, claims, proceedings, demands, costs, expenses, damages, and other liabilities whatsoever or howsoever caused arising directly or indirectly in connection with, in relation to or arising out of the use of the Content.
This article may be used for research, teaching, and private study purposes. Any substantial or systematic reproduction, redistribution, reselling, loan, sub-licensing, systematic supply, or distribution in any form to anyone is expressly forbidden. Terms &
and-conditions
Downloaded by [Dóra Gyrffy] at 05:38 21 May 2015
Austerity and growth in Central and Eastern Europe: understanding the link through contrasting crisis management in Hungary and Latvia
Do´ra Gyo˝rffy*
Pe´ter Pa´zma´ny Catholic University, Budapest, Hungary
(Final version received 26 September 2014)
Within the context of international debates on fiscal consolidation this article examines the experience of the 10 Central and Eastern European countries which joined the EU in 2004 and 2007 (CEE-10) and asks how austerity influenced growth in the region.
By looking at the composition of adjustment, the analysis confirms the pre-crisis consensus – from the perspective of economic growth and competitiveness, expenditure-based consolidations are superior to consolidations which are based on raising revenue. The mechanisms behind this outcome are examined by comparing the fiscal consolidations in Latvia and Hungary, which represent two different approaches to fiscal consolidation. While Latvia followed the textbook approach, Hungary aimed to save households from the burden of adjustment and stimulate the economy.
Although both achieved substantial improvements in their fiscal balance, competitive gains and dynamic growth appeared only in the case of Latvia. In explaining this outcome, the article emphasises the consequences of unorthodox measures on expectations – while a shared economic philosophy fostered trust and confidence among the major actors in Latvia, growing state intervention and the deterioration of institutional quality increased uncertainty in Hungary and undermined long-term growth prospects.
The argument concerning self-defeating austerity cycles has become a prominent criticism of crisis management practices in the European Union. The lagging recovery challenged earlier theories about successful fiscal consolidation and called attention to cases when expenditure cuts caused a recession, leading to both lower tax revenue and higher debt rates, and thus necessitated more austerity. Much of the current debate focuses on experience in Western Europe and the US, with the case of Greece attracting particular attention. Post-socialist countries are much less studied in spite of the fact that almost all have implemented substantial fiscal consolidation, so their experience can provide an important contribution to the debate. The major objective of this article is to analyse the influence of fiscal consolidation on growth in the region.
Following a brief summary of the debate on fiscal consolidation the article first provides a general overview of fiscal consolidation and growth in the region following the financial crisis of 2008. Through this overview it shows that there is a strong correlation between the level of expenditure cuts and post-crisis growth performance, supporting the pre-crisis consensus on fiscal consolidation. The second part of the article tries to trace the mechanisms behind this outcome by examining the cases of Latvia and Hungary. While both received international bailout packages, they eventually chose different approaches to consolidation. At the beginning of the crisis both implemented orthodox measures of adjustment but, after a change of government, Hungary rejected this path and tried to
q2015 Taylor & Francis
*Email:gyorffy.dora@btk.ppke.hu
Vol. 27, No. 2, 129–152,http://dx.doi.org/10.1080/14631377.2015.1026682
Downloaded by [Dóra Gyrffy] at 05:38 21 May 2015
consolidate public finances through unorthodox methods. The greater success of the Latvian path underlines the importance of expectations and trust among actors as a pre- condition for success – the consistency of plans and outcomes in Latvia improved confidence among the main actors of the process, while the unintended consequences of unorthodox consolidation measures and the efforts to handle them considerably increased uncertainty in the Hungarian economy and undermined long-term prospects.
The debate over austerity
During the 1990s the idea that austerity policies can have non-Keynesian effects increased the commitment to expenditure-based fiscal consolidation. On the basis of experience from the OECD countries since 1970, a large literature developed on the conditions under which fiscal consolidation might be expansionary (Giavazzi and Pagano1990, Alesina and Perotti1995, Alesinaet al.1998). The main finding was that consolidation based on cuts in spending rather than tax increases is less likely to hurt economic growth for three reasons.
First, cutting expenditure, which is politically difficult, sends a signal about the commitment of the government to address the imbalances, which increases the credibility of the adjustment. Increased credibility leads to lower interest rates, which in itself improves the fiscal balance. Second, lower expenditure leads to expectations of lower future taxes, which increase profit opportunities and thus have a positive effect on investment. Raising taxes has the opposite effect. Third, restraints on government wages make it possible to restrain wages in the private sector, which increases cost-based competitiveness. Decreasing social transfers has a similar effect as it raises the incentives for taking employment. Together these are called non-Keynesian effects, which can counter the Keynesian effects of consolidation on growth coming from falling demand in the economy. Few questioned these results until the global financial crisis, when numerous countries had to go through sharp adjustments.
The recessionary effects of austerity policies led to highly politicised debates regarding the appropriate response to the crisis, and the findings about the possibility for expansionary consolidation also came to be challenged. An IMF paper found that the periods of expansionary consolidation generally took place during an economic boom, when interest rates could fall with increased confidence or devaluation of the currency could raise exports. At the same time, if interest rates are at the zero bound, there is no possibility of devaluation and global demand is low, fiscal consolidation is likely to be contractionary with a fiscal multiplier averaging 0.5. This means that ‘a fiscal consolidation equal to 1% of GDP typically reduces GDP by about 0.5% within two years’
(IMF2010, p. 94).
Perotti (2011) reached similar conclusions by looking closely at the model cases of expansionary fiscal consolidation (Denmark, Finland, Ireland and Sweden). He found that the main drivers of the expansion were the depreciation of the currency, increases in exports, falling interest rates and wage moderation. The usefulness of such measures is highly questionable during a global crisis – if all countries introduce austerity at the same time, global demand contracts and the potential for export-led recovery is reduced for all.
Furthermore, at a time when interest rates are close to zero, they have nowhere to fall even with credible adjustments.
The empirical evidence from the current consolidation seems to support the critics of expansionary fiscal consolidation and shows an even larger short-term trade-off between austerity and growth than previously assumed. On the basis of the GIIPS countries1and Germany, de Grauwe and Ji (2013) find a strong negative correlation between the size of
Downloaded by [Dóra Gyrffy] at 05:38 21 May 2015
fiscal consolidation and growth. They also find that in the Eurozone consolidation does not appear to have effects on market confidence as interest rates are negatively related to consolidation efforts. Furthermore, the size of contraction is also larger than previously thought. On the basis of 26 advanced economies Blanchard and Leigh (2013) found that during the early part of the crisis the size of the multipliers was severely underestimated and in retrospect we can see that they were substantially above the previously calculated 0.5 value.
The importance of counter-cyclical consolidation is also emphasised in several criticisms of austerity (Jayadev and Koczal 2010, Jorda´ and Taylor 2013). Counter- cyclicality is expected by both the neoclassical tax-smoothing model and the Keynesian idea that in periods of liquidity constraints governments should run a deficit to stabilise the cycle (Fatas and Mihov2010, p. 291).
Overall, the pre-crisis and post-crisis literatures reach different results regarding fiscal consolidation. While the possibility for non-Keynesian effects and the importance of the composition of adjustment were emphasised during the 1990s, in a period of global recession concerns over output costs of adjustment became much stronger.
As we can see, most of the debate focuses on developed countries, while emerging economies have received much less attention in spite of the fact that substantial fiscal consolidation took place in many of these countries as well. An important exception to this claim is the paper by Boryset al.(2013), who examine CEE-10 countries between 1995 and 2011 using econometric panel data techniques. They find some support for the better investment and export outcomes of expenditure-based consolidation although they do not find evidence of a confidence effect. In light of the present debate, however, these findings are only partially helpful, since the analysis does not differentiate between the pre- and post-crisis periods, which play a major role in the various arguments.
The post-crisis period of adjustment is most extensively examined through the experiences of the Baltic countries. Here Comite et al. (2012) and Staehr (2013) find visible signs of non-Keynesian effects, while Kattel and Raudla (2013) call attention to the special conditions in these countries, including the prospect of the euro, weak civil society, detached policy elites and high level of integration into global production chains. Such factors, however, to a certain extent characterise most CEE countries (particularly Latvia and Hungary, which will be examined more deeply here), so differences among them on the basis of the composition of consolidation might still carry important lessons for the global debate.
Stylised facts from the CEE-10 countries
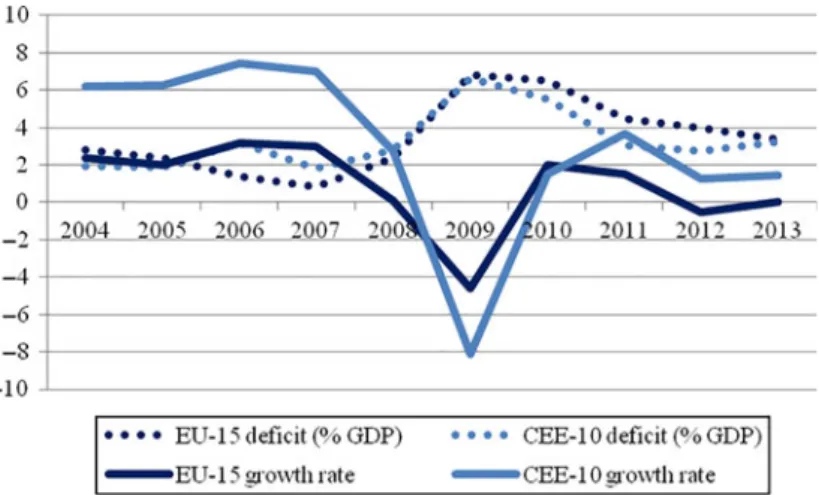
When we look at the CEE-10 performance in comparison to the old member states (EU- 15) we see a number of important trends. First, in line with the literature on greater volatility of emerging economies,2the cyclicality of the CEE-10 countries in terms of growth is much greater. They had a better growth performance prior to the crisis, registered a more pronounced downturn during the crisis and recovered faster than the EU- 15 countries. Second, these differences were certainly not caused by the presence or absence of fiscal consolidation – as we can see, the level of fiscal deficit was only slightly higher prior to the crisis, while consolidation took place faster than in the EU without a comparable impact on the speed of the recovery. The overall performance of the CEE-10 countries, however, hides sharp differences among them, which it is important to examine.
As we can see from Figure 1, fiscal consolidation is a general trend in the CEE10 group – from a peak over 6% in 2009 their combined deficit declined to close to 3% by
Downloaded by [Dóra Gyrffy] at 05:38 21 May 2015
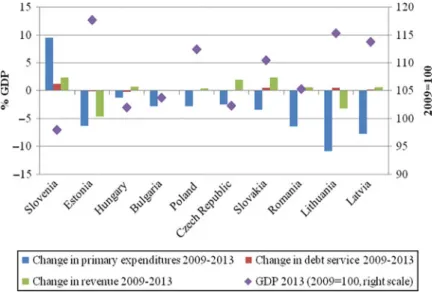
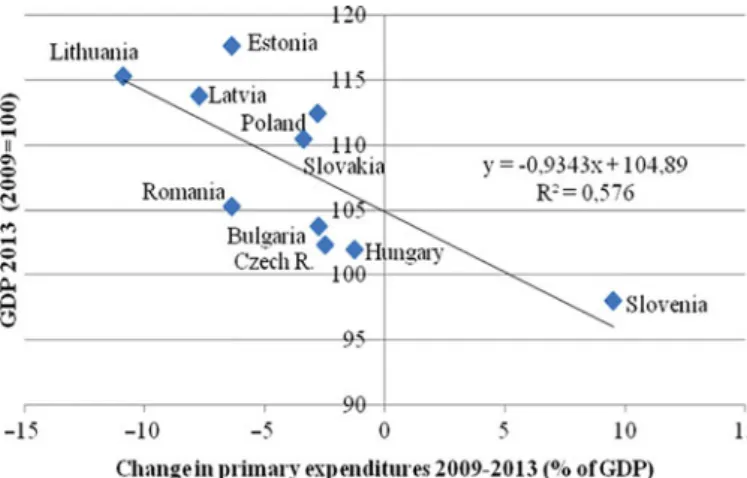
2013.Figure 2shows the composition of this consolidation and the respective growth rates in this group. Countries are placed from left to right according to the total consolidation they implemented between 2009 and 2013. Only Slovenia increased its deficit, which was due to the crisis of its state-owned banks. The other countries implemented substantial consolidation with differing growth outcomes. In 2013 Slovenia was well below its 2009 output level, while the three Baltic countries, Poland and Slovakia surpassed their 2009 level by over 10%. In general, we can see no clear correlation between the extent of consolidation and the speed of recovery. However, if we look at Figure 3, we see considerable correlation between cuts in primary expenditure and the speed of recovery.
These results seem to provide support for the claim that, in line with the earlier findings of Boryset al.(2013), in this group of countries expenditure-based consolidation has been Figure 1. Fiscal deficit and growth in the EU-15 and CEE-10 2004 – 13. Source: Own calculations based on European Commission (2014a, pp. 48 – 49, 180 – 181).
Figure 2. The composition of fiscal consolidation and growth in the CEE-10 countries 2009 – 13.
Source: Ameco database.
Downloaded by [Dóra Gyrffy] at 05:38 21 May 2015
more successful than revenue-based consolidation. It is also important to underline that these results are not driven by the possibility of devaluation – out of the five best- performing countries only Poland had such an option, while the other four countries maintained fixed exchange rate regimes.
In the debate on fiscal consolidations the importance of counter-cyclical adjustment is also regularly underlined. The simplest way to measure the cyclical stance is by combining information on the cyclical stance of the economy with a measure of fiscal effort.3 Following one of the methods used by the European Commission (2013, pp. 118 – 120) Table 1shows data on change in the output gap and the change in the structural primary balance from the previous year. While this measure suffers from a number of shortcomings, especially given the difficulty of estimating the output gap during a non-ordinary business cycle as well as the endogeneity of the output gap to fiscal policy measures, on the basis of these data we can draw some preliminary conclusions.
Prior to the crisis the positive changes in the output gap were accompanied by negative changes in the structural primary balance, implying a pro-cyclical policy stance. This is in line with the already mentioned argument that countries with a weak institutional framework tend to follow pro-cyclical policies (Talvi and Vegh2005, Alesinaet al.2008).
Following the crisis, however, the situation changed – in 2009 the sharp drop in output was accompanied by counter-cyclical loosening of fiscal policy followed by a tightening, which was first counter-cyclical but then became pro-cyclical.
When we look at individual countries we see little relation between the cyclicality of fiscal policy and output recovery. Among the best performers only Lithuania conducted counter-cyclical policies every single year following 2008. However, Bulgaria also followed strictly counter-cyclical policies with much less success. Estonia and Latvia tightened fiscal policy during the deepest recession in 2009 and still experienced fast recovery. Pro-cyclical tightening prevailed in Poland and Slovakia from 2012 with much smaller negative effects than in Slovenia or the Czech Republic. On the other hand, the dangers of conducting pro-cyclical policies are illustrated by Hungary, where fiscal policy was pro-cyclical every year before and after the crisis, contributing to the deep crisis and the slow recovery.4
Figure 3. Correlation between change in primary expenditure and GDP performance. Source:
Ameco database.
Downloaded by [Dóra Gyrffy] at 05:38 21 May 2015
Table1.ThecyclicalityoffiscalpolicyintheCEE-10countries2005–13. 200520062007200820092010201120122013 DOGDSPBDOGDSPBDOGDSPBDOGDSPBDOGDSPBDOGDSPBDOGDSPBDOGDSPBDOGDSPB Bulgaria20.1620.960.70.311.2721.390.9720.127.8522.080.11.271.520.5401.3220.5220.67 CzechRepublic1.8620.532.521.130.911.1721.2221.0725.1821.270.671.120.331.5321.371.4821.381.47 Estonia2.3821.56421.252.6420.3227.6122.87214.343.592.510.17.310.272.320.4921.3220.35 Hungary0.7422.231.3121.6122.016.0320.71.2426.382.730.9721.451.420.7821.633.290.7320.02 Latvia2.6320.363.5821.363.2421.1426.5221.49217.322.380.61.555.141.584.151.12.1320.49 Lithuania1.990.291.7420.552.920.9222.3122.11216.4320.981.432.724.690.242.241.550.630.66 Poland20.361.22.6220.732.80.270.9823.2822.3322.7320.230.080.342.6321.441.8321.610.1 Romania20.670.032.2721.580.6421.592.2623.127.3920.7222.473.50.542.3521.391.481.560.69 Slovakia0.7120.542.5922.044.46.20.470.2820.729.0122.720.760.4720.722.7120.971.0721.352.12 Slovenia0.210.521.7120.823.0720.220.2922.1229.30.141.410.041.210.2221.622.4720.570.41 Average0.93320.4142.30221.0761.9921.14221.35821.5629.55320.1660.5750.942.1761.1290.0291.60820.170.392 Cycle_avPLPLCTCLCLCTCTCTPT Cycle_majorityPLPLPLPLCLCTCTPTPT Notes:DOGmeanschangeinoutputgapasmeasuredbythegapbetweenpotentialandactualoutput.DSPBmeanschangeinstructuralprimarybalance,whichisthecyclicallyadjusted fiscalbalanceexcludinginterestexpenditure.Otherabbreviations:PL:pro-cyclicalloosening,PT:pro-cyclicaltightening,CL:counter-cyclicalloosening,CT:counter-cyclical tightening. Source:DataforthecalculationsarefromtheAmecodatabaseoftheEuropeanCommission.
Downloaded by [Dóra Gyrffy] at 05:38 21 May 2015
While given the already-strong mentioned difficulties in assessing the fiscal stance we should be very careful in drawing strong conclusions from the data, it appears that, alongside the possibility of devaluation, the cyclical stance has a much weaker explanatory power in relation to economic recovery than the extent of expenditure cuts.
In the second part of this article I try to explain what are the mechanisms behind these outcomes by examining the cases of Hungary and Latvia. While the latter is considered as one of the few success stories of European crisis management, Hungary explicitly tried to design its consolidation programme in opposition to the prevailing international consensus so we can treat it as a policy experiment. Both of them are small, open economies so the outcomes of crisis management can be attributed to their different approaches to it rather than to the external environment.
Post-crisis fiscal consolidation in Hungary and Latvia
In order to understand the differences between the crisis management and its outcomes, in this section I provide a brief narrative on the causes and management of the crisis in the two countries. In the following section I conduct a comparative analysis on the basis of consolidation, the effects on confidence of various actors and the outcome of crisis management.
The path to crisis and its management in Hungary
Hungary was the country of goulash communism, where market reforms started as early as 1968 and, in spite of periodic reversals, continued up until the transition.5This implied that a number of inherited features of the previous system survived, most importantly the expectations of the population concerning welfare benefits and the weak culture of the rule of law, which was the result of the extensive second economy under socialism. Such a heritage, however, did not appear to hinder the main tasks of transformation, especially given the widespread consensus among the major political actors over the main tasks of transformation – the establishment of democracy and a market economy that would eventually lead the country into the European Union. The inherited debt from the socialist past, 73% of GDP in 1989, also facilitated adjustment as it made privatisation to foreigners politically feasible and thus paradoxically helped the country to follow the path of export- led growth (Miha´lyi2001).
At the same time the favourable initial conditions and the commitment to market reforms had their costs. The transformational recession lasted from 1989 to 1993 with a loss of output equalling 18% (UN ECE2003, p. 112). Given the strict rules on bankruptcy, over 30,000 companies went through some form of bankruptcy, leading to a drop in employment by 30% and a rise in non-performing loans in the banking sector to 32%
(A´ bel and Szakada´t 1997, p. 643). The loss of employment opportunities and rising popular dissatisfaction placed increasing demands on the welfare system of the country.
In response to these pressures the government considerably eased the regulations regarding disability pensions, early retirement and maternity benefits, which contributed to low employment rates for decades.
The increasing welfare expenditure and the cost of bank consolidation led to enormous deficits, and in March 1995, in the shadow of the Mexican crisis, major fiscal adjustment became unavoidable. By relying on monetary, fiscal and incomes policy the economy was stabilised and Hungary avoided a financial crisis without entering recession or suffering further employment losses. However, the favourable external assessments came with
Downloaded by [Dóra Gyrffy] at 05:38 21 May 2015
enormous political costs. The reduction of entitlements, such as introducing needs-based family allowances or tuition fees in higher education, aimed to signal the importance of individual responsibility in the new regime but their main result was the triggering of serious resistance to the package. The opposition denied that such harsh measures were necessary and the finance minister, Lajos Bokros, soon became the least popular figure in the country. After the crisis was over he was forced to resign from his post in 1996. While the three-pillar pension reform was introduced by his successor in 1997, no major reforms took place for a decade after his departure. The unpopularity of the package and the government’s loss of the election in 1998 made policy makers extremely reluctant to introduce fiscal restrictions. Promising material benefits to buy support became the norm for all parties before the subsequent election.
The period after 2000 can be characterised by permanent election campaigning and the lack of any major reform even in the mid-term of a government. Government debt increased steadily – from 52.7% in 2001 to 73% by 2008 (European Commission2014a, p. 185). Politically motivated spending6was the major reason behind this increase, as was well documented by Ohnsorge-Szabo´ and Romha´nyi (2007).7 Efforts to reduce the imbalance took place during mid-term through sub-optimal revenue-increasing measures, which led to a worsening business environment. The increase in taxes and administrative measures to fight the informal economy substantially increased administrative costs and created an unfavourable environment for investment. Hungary continued to have one of the lowest employment rates in the EU, ranging around 61.2 – 62.6% between 2000 and 2008 for persons aged between 20 and 64.8Low employment implied low contributions to the budget and entrenched demand for welfare services, which in turn had to be financed by high taxes on those in work (seeFigure 5).
The situation was further worsened by rapid credit growth, which took place mostly in foreign currency.9The major reason for foreign indebtedness was the large interest rate differential between loans in domestic currency and in euros. Given the weak credibility of Hungarian economic policy due to the above reasons, domestic interest rates remained steadily high: as a result, between 2004 and 2007 euro loans were 6.5 percentage points cheaper for housing and 15.5 points cheaper for consumer goods (Darvas and Szapa´ry 2008, p. 40). The high domestic interest rate influenced foreign currency lending through the exchange rate channel as well – the forint remained strong and stable in relation to the euro, which contributed to the underestimation of exchange rate risk by borrowers. As the credit boom created the illusion of prosperity it is unsurprising that the sharp increase in foreign currency borrowing was not countered by effective policy measures.10 The growing indebtedness in foreign currency made the country extremely vulnerable to any change in market sentiment and the volatility of the currency.
Given the above circumstances it is unsurprising that, following the collapse of Lehman Brothers in September 2008, the subsequent freezing of global financial markets and the sharp devaluation of its currency Hungary was the first EU country which had to turn to the IMF for help in October 2008 in order to maintain financing for the government and the financial sector.
In return for the EUR20bn bailout package in November 2009, the country had to implement a front-loaded expenditure-based consolidation, which involved a nominal wage freeze and the elimination of the 13th month salary for all public sector employees, the elimination of 13th month pensions, raising the statutory retirement age, and reductions in universal welfare programmes. On the revenue side, the tax cuts already announced were postponed and the authorities committed themselves not to make any tax changes leading to loss of revenue (IMF2008, p. 10). Minor cuts in personal income tax
Downloaded by [Dóra Gyrffy] at 05:38 21 May 2015
and social security contributions took place in parallel to increases in VAT and corporation tax. Following a decade of resistance by the political elite, in the context of the bailout package the parliament also adopted strict fiscal rules constraining the growth of debt and established a fiscal council to provide an independent assessment of budgetary policy and evaluate the budgetary impact of legislative proposals.
Following stabilisation however, a new government, led by Viktor Orba´n, came to power with a different agenda. The mismanagement of the economy and the subsequent pain of adjustment, which coincided with a 6.8% drop in GDP, swept away the Socialist Party government in the 2010 election. The centre-right Fidesz in coalition with the Christian Democrats received a two-third majority in the Parliament on the basis of promises of an alternative economic policy which involved no further restrictive measures but promoted growth instead. In order to increase its discretion over policy, following the expiration of the stand-by agreement programme in October 2010, the government refused further cooperation with the IMF and aimed to finance itself from the markets.
The original plan of the new government was to implement tax cuts to stimulate the economy and allow a higher deficit for 2010. In the context of the Greek crisis however, Brussels was unwilling to allow the 6.8% deficit the new government hoped for (Farkas 2014, pp. 148 – 149). However, this did not lead to reconsideration of its plans for cutting taxes. As one of the first measures of the government a 16% flat-tax system was introduced with substantial benefits to families. Further tax cuts included a 10% corporate tax for small and medium-size enterprises. The total costs of these measures were HUF 444bn or about 1.5% of GDP annually (To´th and Virova´cz2013). Since expenditure was not cut in a parallel manner, counter-measures were necessary to reach the deficit target. Such measures included the raising of VAT to 27% and the levying of special taxes on the financial sector, energy suppliers, telecommunications and retail companies (Government of the Republic of Hungary 2011, pp. 66 – 67). Although these were announced as temporary crisis taxes, they were made permanent once it became evident that the reduction in income taxes had not had the expected impact on growth.11The government also gained substantial revenue by thede factonationalisation of the second pillar of the pension system in November 2010, which amounted to around HUF 3000bn or 10% of GDP, as well as the reorientation of pension contributions to the budget amounting to around 1.5% of GDP (Government of the Republic of Hungary2011, p. 47).
On the expenditure side the government planned substantial cuts in unemployment and family benefits, disability pensions, higher education, public transport and the prescription drug subsidy system.12However, as shown by Romha´nyi (2013), the implementation of these measures was at best uneven, which explains why the level of expenditure remained almost constant. While education expenditure was indeed cut substantially, the cuts in social transfers were offset by a 3.2% real increase in old-age pensions in 2013, the year before the next election.
A common feature of the main measures was the method of implementation – they were mostly implemented in anad hocmanner without consultations or impact studies.
Impromptu decision making became a defining feature of policy (Csaba2012, p. 303). The unconcealed desire of the government for increasing discretion over policy making was signalled by the systematic paring of institutional checks and balances. Steps towards this objective included the nomination of party members to the posts of President and head of the State Audit Office, as well as the elimination of the newly established Fiscal Council.
The power of the Constitutional Court was also curbed following its resistance to a retroactive law on severance payments. While the new Constitution included apparently strict fiscal rules and a powerful fiscal council, the formally strict rules have little
Downloaded by [Dóra Gyrffy] at 05:38 21 May 2015
constraining influence on the present government but might become debilitating for a future government.13
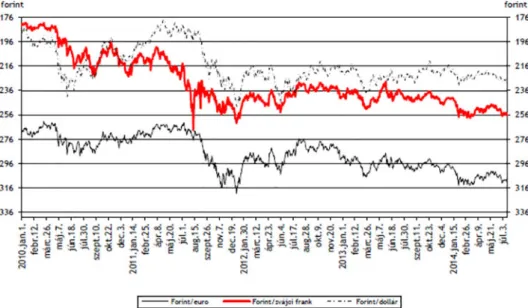
Since these measures were accompanied by substantial weakening of the forint (Figure 4), the problem of foreign currency loans also had to be addressed, which was done through a long moratorium on evictions as well as the possibility to repay foreign currency loans at an exchange rate well below the market rate through an early repayment scheme between September and December 2011. These measures implied substantial costs for the banks, amounting to a net loss of 1% of GDP,14which led to a decline in new loans and a considerable drop in investment.15
Owing to the efforts to consolidate its public finances Hungary was released from the excessive deficit procedure in 2013, the first time since accession. However, as we have seen, the measures used had numerous unintended consequences, most importantly the substantial weakening of the exchange rate. While this contributed to balancing the current account,16given the extent of foreign currency loans it made the process of deleveraging more difficult and led to a rise in non-performing loans in the banking sector.17 The weakening of the forint also undermined the efforts at debt reduction – in spite of using two-thirds of the nationalised private pension funds for debt reduction, public debt remains around 80% (European Commission 2014b, p. 16).18 These developments made devaluation a double-edged sword. Latvia provides a telling contrast to this choice.
Crisis and crisis management in Latvia
Latvia started transition from a very different point than Hungary. Following independence in 1991, it faced the triple task of political and economic transition as well as state building. Between 1991 and 1993 GDP fell by 56% (Aslund and Dombrovskis2011, p. 12). Unlike in Hungary, there was no desire to preserve elements of the old system. The total rejection of the Soviet past was symbolised by the exit from the ruble zone and the subsequent introduction of the new independent currency, the lats.
A currency board was seen as the best way to ensure the credibility of the new currency.
Figure 4. Exchange rate of the forint 2008 – 14. Source: National Bank of Hungary.
Downloaded by [Dóra Gyrffy] at 05:38 21 May 2015
The determination to close the past determined other aspects of economic policy as well.
Following the example of Estonia, Latvia introduced wide-ranging market reforms during the early 1990s including strict fiscal policy, a flat tax, complete trade liberalisation and extensive privatisation (Aslund and Dombrovskis2011, pp. 9 – 10). From the start of the process joining the EU was a major objective.
Following the reforms the country produced a spectacular growth performance:
between 1996 and 2007 – with the exception of the 1998 Russian crisis – output grew by 7.7% on average (Blanchard et al. 2013, p. 329). During this period the budget was roughly balanced, public debt remained below 15% of GDP and up to 2003 inflation remained low (European Commission2014a, p. 195).
The excellent performance, however, had an important dark side. Cutting social expenditure was a major element of fiscal discipline, which contributed to social dissatisfaction (Bohle and Greskovits2012, p. 116). Strengthening EU integration and improving access to credit were the major methods to address dissatisfaction (Bohle2010, pp. 8 – 9). While these were very popular, the subsequent credit boom resulted in the highest rate of inflation in the EU (20.3% in 2007) and enormous current account deficits, reaching 22.5% in 2006 and 2007 (European Commission2014a, p. 195). Between 2000 and 2008 unit labour costs grew by 145%. The overheating of the economy was also signalled by real estate prices – between 2004 and 2007 prices per square metre increased from EUR400 to EUR1700 (Blanchardet al.2013, pp. 332 – 334). In spite of the obvious signs of overheating there were no serious efforts to rein in the credit boom given its enormous popularity (Aslund and Dombrovskis2011, p. 29).
The slowdown of the economy started before the crisis owing to the overvaluation of the currency and the tightening credit conditions due to the reaction of primarily Scandinavian banks to the obvious signs of overheating. After the last quarter of 2007 exports, domestic consumption and investment started falling. By the third quarter of 2009 GDP had fallen by 25% (Blanchard et al. 2013, p. 338). The global financial crisis contributed to the fall, affecting Latvia via two channels: the fall in international demand and the freezing of the global financial markets. While the first resulted in a 5% decline in external demand, the credit crunch led to a fall of 43% in domestic demand (Blanchard et al.2013, p. 339).
The immediate trigger of financial crisis in Latvia was the collapse of the largest domestic bank, Parex, which owned 14% of Latvian bank assets. Its resources were domestic and external deposits in roughly equal share. During the crisis this became problematic given the possibility of a self-fulfilling run by depositors – who would act in the knowledge that there is no lender of last resort in a currency board arrangement. The panic started following the collapse of Lehman Brothers, when international financial markets froze and its loans were not rolled over (Blanchardet al. 2013, pp. 340 – 341).
Parex lost 25% of its deposits and the panic was not mitigated even by government intervention, which included the reduction of reserve requirements.
The collapse of external and domestic demand, the credit crunch and the instability of its banking system raised questions regarding the commitment of Latvia to its fixed exchange rate system. In order to maintain financial stability, the country turned to the IMF and the EU for assistance.
During the negotiations over the Latvian bail-out there were many more actors at the table than usual. Beside the IMF and the EU, representatives of the Scandinavian countries were also there since they had a 60% stake in the country’s banking system. Out of the EUR7.5bn package the IMF contributed EUR1.7bn, the EU EUR3.1bn and EUR1.8bn
Downloaded by [Dóra Gyrffy] at 05:38 21 May 2015
came from the Scandinavian countries. Furthermore, Latvia received bilateral loans from the Czech Republic, Estonia and Poland (Aslund and Dombrovskis2011, pp. 45 – 46).
The critical question of the package was whether to give up the currency board. The Latvians insisted on the peg because over 90% of their loans were in euros, and they considered accession to the Eurozone as the exit from this situation (Bakker and Klingen 2012, p. 115). They were aware of the need for internal devaluation and severe fiscal consolidation in order to maintain the peg.
During the negotiations the European participants supported the Latvian strategy given the fear of losses from the banking system as well as the possible regional spillover effects.
The IMF, on the other hand, was not convinced that Latvia could implement the tough measures needed to maintain the peg. Seeing the support of the Europeans the IMF was finally willing to agree to the Latvian strategy and signed the package without devaluation.19
Fiscal consolidation was an important condition for the programme, meaning reduction of the fiscal deficit below 3% of GDP by 2011. On the revenue side this meant a substantial increase in taxes, especially consumption taxes,20although, as noted by Comite et al.(2012, p. 82), compliance dropped sharply following the increase so that overall taxes as a share of GDP did not increase. These measures were partially offset by a 2% cut in personal income taxes. On the expenditure side the major savings came from cuts in public sector wages as well as reforms in health care, education and public administration.
The measures included the closure of half of the 75 state agencies, reduction of the number of territorial units from 548 to 119 and cuts in the health and education budgets by 26%
and 27% respectively. In discussing these steps Comiteet al.(2012, pp. 82 – 83) emphasise that in these sectors reforms had long been overdue, plans were available and the financial crisis provided the window of opportunity to implement them. It is also important that social protection and social assistance programmes were enhanced during the crisis, including extending the duration of unemployment insurance benefits, expansion of the Guaranteed Minimum Income Programme and introduction of a public works programme (Harroldet al.2012, pp. 123 – 126). During the negotiations abandonment of the flat tax and the low corporate tax also came up but the Latvians refused these requests (Aslund and Dombrovskis2011, p. 44).
In the original package 5% loss of GDP was forecast for 2009, which soon proved far too optimistic and the actual output loss was close to 18%. The conditions of the package needed to be renegotiated and the idea of devaluation came up again from the IMF (Aslund and Dombrovskis2011, p. 85). However, the European Commission continued to support the Latvian strategy and sent the next tranche of the package. In July 2009 the other creditors also agreed to prolong the deadline for the 3% deficit by one year. The time was used by the Latvian government to implement further austerity measures, which included a further 20% wage cut in the public sector and cuts in pensions. The scale of adjustment reached 8% of GDP in 2009, a further 5.4% in 2010 and 2.3% in 2011 (Blanchardet al.
2013, p. 345).
The bail-out programme proved to be very successful. Internal devaluation worked, and unit labour costs declined by 25% in 2009 from their pre-crisis level, reflecting both wage cuts and productivity improvements (Blanchardet al.2013, p. 350). The adjustment also contributed to sharp improvements in the current account balance, which rose from its nadir of222.6% to20.8% by 2013 (European Commission2014a, p. 116). This way the currency board system could be maintained and Latvia averted the problem of a debt explosion, which would have occurred in the case of devaluation given the level of
Downloaded by [Dóra Gyrffy] at 05:38 21 May 2015
foreign currency loans. This problem was handled through the introduction of the Euro in January 2014.
Fiscal consolidation, confidence effects and outcomes in Hungary and Latvia Fiscal consolidation in Latvia and Hungary
As we have seen, both countries implemented substantial fiscal consolidation following the crisis. This is shown by the overall levels of revenue and expenditure (Figure 5). When we look at the trends from 2004 we can see that Hungary closed the large pre-crisis gap between revenue and expenditure through a steady increase in revenue (with a peak in 2011 attributable to the nationalisation of private pensions), while expenditure remained roughly stable at around 50% of GDP. In contrast, Latvia had roughly stable government revenue at around 35% of GDP, while the large deficit accumulated during 2009 was managed through the harsh cuts in expenditure detailed above.
In spite of the very different starting levels the fiscal consolidation in the two countries shows remarkable similarities – at least at the level of abstract theory. On the revenue side both countries aimed to reduce taxes on labour and move towards consumption-based taxes.
However, while in Latvia this meant an effort in 2009 to reduce the PIT by 2% from 26%, which was later reversed, in the case of Hungary, in spite of its much greater redistribution, the rate was set at 16%, which led to an enormous gap in the budget.21This had to be filled by other revenue, which necessitated the weakening of the institutional framework.
We can also observe remarkable parallels regarding the major channels of expenditure although Hungary has higher rates of spending on every major item (Figure 6).
Administrative costs, health care and education spending (social transfers in kind) were cut in both countries (some lines run almost parallel). This implies that in spite of the pre- election promises Hungarians were not saved from austerity – although the politically most sensitive expenditure, social transfers in cash, is still above the 2004 level and shows the greatest gap vis-a`-vis Latvia, while compensation of employees and social spending in kind are steadily decreasing.22
Overall the figures on consolidation show that both countries achieved considerable fiscal consolidation, and we can see that there are remarkable similarities between the two
Figure 5. Government expenditure and revenue in Hungary and Latvia 2004 – 14. Source:
European Commission (2014a, pp. 172 – 173, 178 – 179).
Downloaded by [Dóra Gyrffy] at 05:38 21 May 2015
countries. The task was however much greater for Hungary, and here we cannot take 2009 as a starting point. The need for consolidation was present from the accession to the EU, and by taking a long-term perspective we can also see that this consolidation took place primarily on the revenue side, while expenditure remained roughly stable – primarily due to the high levels of social transfers in cash, which were still higher in 2013 than in 2004.
In contrast, public finance imbalances played a much smaller role in the Latvian crisis, and most of the fiscal measures essentially took back the increase from the boom years. From Figure 5we can observe a relatively steady rate of revenue and expenditure if we compare 2004 and 2013 data.
Based on the above analysis, from the perspective of this study we see a revenue-based consolidation in Hungary between 2004 and 2013 and an expenditure-based one in Latvia between 2009 and 2013. The next part discusses the effects on confidence of these processes.
Confidence effects
When looking at confidence effects of consolidation most studies consider consumer confidence and interest rates. However there are many other actors in the process and it is worth looking at them when drawing conclusions. In the following I compare the confidence of various actors including international institutions, market actors and the public.
In the case of Latvia we have already seen the evolution of the bail-out package during the negotiations with the international lenders. The negotiations can be characterised by a high level of cooperation, with open discussion and persuasion the main methods which shaped the outcome (Dahan2012).
When we look at Hungary we see a very fast signing of the bail-out package in autumn 2008. The authorities asked for assistance on 9 October and the stand-by-agreement was Figure 6. Selected government expenditure in Hungary and Latvia 2004 – 14. Source: European Commission (2014a, pp. 150 – 153, 156 – 157, 160 – 161).
Downloaded by [Dóra Gyrffy] at 05:38 21 May 2015
signed on 6 November. Such rapid agreement signals a shared understanding of the sources of crisis as well as the remedies. As it became clear that the 2009 recession would be greater than expected, the lenders showed flexibility in adjusting the deficit target from 2.6% to 3.9% in May 2009.23
The situation differed sharply during the second round of negotiations. Following the unorthodox adjustment and subsequent weakening of the exchange rate, the country had to turn to the IMF again in November 2011 as the exchange rate was deteriorating sharply following the early-repayment scheme (Figure 4). However,ex postit appears that the government had no serious intention to enter into a stand-by agreement as the negotiations in themselves were sufficient to stop speculation against the forint. As the financial markets calmed and the current account was in surplus, by the end of 2012 it became clear that there would be no new agreement. During the extended negotiations the government was able to conduct a public campaign listing all the measures, presumably sought by the IMF, which it was not willing to introduce, from the introduction of a property tax to the cutting of pensions. Although the IMF continuously denied the presence of such a list of mandatory conditions, the government could sustain its image of fighting against austerity (Farkas2014, pp. 255 – 259). Naturally, such techniques were not conducive to fruitful exchange of views for a new programme.
The sharp difference between the two countries can be partly explained by public attitudes. The two countries do not differ in the fact that crisis management had to be implemented under considerable political uncertainty.
In Latvia the crisis started already at the end of 2007, when the slowdown of the economy coincided with the fall of the prime minister, Aigar Kalvitis, after dismissing the head of the Anti-corruption bureau. His successor, Ivars Godmanis, had a considerable reputation as the first prime minister of Latvia. However, even during autumn 2008 there was considerable opposition to the plans for fiscal stabilisation. Support for radical measures started increasing as the collapse of the economy became evident and the maintenance of the peg came to be questioned (Aslund and Dombrovskis2011, pp. 33 – 34). The budget for 2009 was harshly criticised by the opposition for not being radical enough and trying to protect certain interest groups from the effect of cuts (Aslund and Dombrovskis2011, pp. 38 – 40). In response to widespread protests, Godmanis resigned in February 2009 and the president nominated the former minister of finance, Valdis Dombrovskis, as the new prime minister. He implemented the radical consolidation which was described above. The measures, however, did not lead to a collapse of his popularity and in October 2010 he was re-elected with an even greater majority. The anti-austerity campaign of the opposition failed.
In Hungary growth also slowed down way before the crisis: following its re-election in 2006 the centre-left government was forced to implement substantial consolidation (Figure 5). This became especially difficult after the so-called O˝ szo¨d speech, when prime minister Ferenc Gyurcsa´ny admitted following irresponsible policies and lying day and night in order to win the election. After this admission protests against the government became widespread and its efforts to consolidate aroused widespread resistance. The level of dissatisfaction even increased following the crisis and the collapse of the coalition was almost inevitable regardless of the successful crisis management of the Bajnai government. The new government built itself up in opposition to its predecessor and attempted a radically different approach to consolidation, trying to place the burden on banks and multinational companies. While it did succeed in preserving old-age pensions, it could not avoid expenditure cuts in other areas. These were somewhat offset by cuts in utilities prices from the second half of 2012, which were used as a pre-election measure
Downloaded by [Dóra Gyrffy] at 05:38 21 May 2015
instead of direct budgetary spending. As a result of these steps the government was successful in presenting itself as the lesser evil during the 2014 election and again defeated the opposition, which included exactly the same leaders who were held responsible for the crisis.
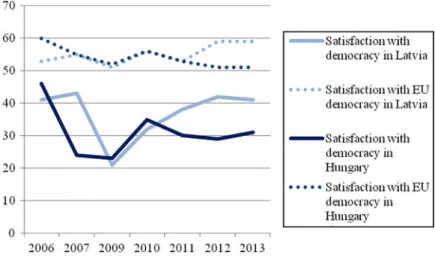
When analysing public support, satisfaction with democracy is a widely used indicator. It is somewhat surprising that the two countries share substantial similarities.
In spite of the radically different approach of the government to the European Union, there is only a slight difference between satisfaction with EU democracy between the two countries – in both of them the majority is much more satisfied than with national democracy. Up until 2010 they also followed a similar path regarding satisfaction with national democracy – there was a sharp drop prior to the crisis, followed by a recovery.
In Latvia the recovery continued, which illustrates support for the orthodox measures of crisis management – as the results are materialising, satisfaction with democracy is growing. In contrast, satisfaction rates in Hungary hover around 30% – which was enough for the re-election of the government but compares unfavourably to the Latvian numbers.
It also indicates that for the majority of Hungarians the fight against the EU and the multinational companies cannot substitute for tangible economic results.
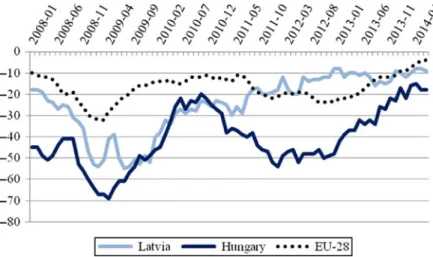
A slightly different and widely used measure of confidence is consumer confidence, which shows similar trends to satisfaction with democracy (Figure 8). Following crisis management we see a strong recovery in Latvia and a weakening in Hungary due to the unorthodox measures. Confidence started improving following the calming of financial markets and the preparation measures for the 2014 election, which included the utilities price cuts.
For the purpose of economic recovery the reactions of market actors are extremely important.Figure 9shows long-term interest rates for Latvia and Hungary between 2008 and 2014. As we can see interest rates rose sharply for both countries from autumn 2008, with Latvia reaching even higher rates than Hungary during 2009. However, as it became evident to market actors that Latvia was able to preserve its currency board and implement the consolidation measures, interest rates fell steadily. With the introduction of the euro, by 2014 rates were well below their pre-crisis level. Interest rates fell even faster in
Figure 7. Satisfaction with democracy in Latvia and Hungary 2006 – 13. Note: Numbers indicate % of respondents who are satisfied or very satisfied with the way democracy functions. Source:
Eurobarometer surveys (Nos. 65, 68, 72, 73, 76, 78).
Downloaded by [Dóra Gyrffy] at 05:38 21 May 2015
Hungary following the 2009 agreement, and they were below Latvian rates up until autumn 2010 but following the unorthodox measures they rose again and approached 10%
by 2012. From this peak they slowly decreased parallel to Latvian rates, but we can see from Figure 9 that even in 2014 a steady 2 – 3% difference persisted between the two countries even as markets calmed down. Furthermore, while Latvia is in the Eurozone, the decline in interest rates has led to the substantial weakening of the forint (Figure 4), which completely undermined efforts at debt reduction and contributed to the increase of non- performing loans in the financial sector.
A different measure of market confidence can be found in the various reports on competitiveness. According to the Global Competitiveness Report of the World Economic Forum,24during the post-crisis period Latvia steadily improved its overall competitive- ness from a rank of 68 in 2009 – 10 to 52 by 2013 – 14. Hungary went in a different direction – while a strong improvement could be observed from a rank of 58 to 48 between Figure 8. Consumer confidence in Hungary, Latvia and the EU 2008 – 14. Source: O¨ NB online data, available fromhttp://www.oenb.at/isaweb/report.do?report¼10.11.
Figure 9. Long-term interest rates 2008 – 14. Source: ECB Statistical warehouse.
Downloaded by [Dóra Gyrffy] at 05:38 21 May 2015
2009 – 10 and 2011 – 12, the different approach to consolidation reversed this trend and led to a of rank 63 by 2013 – 14.
Behind the overall ranking the worsening of the institutional environment is particularly acute. During the second crisis management period, Hungary’s overall institutional ranking went from 76 to 84 between 2009 – 10 and 2013 – 14, with particular worsening regarding property rights (from 57 to 103), burden of government regulation (from 130 to 140) and transparency of government policy making (from 113 to 132) reflecting the uncertainties surrounding various policies. In contrast, Latvian institutions improved their rank from 65 to 57 with a large improvement in transparency of government policy making (from 78 to 45) and wastefulness of government spending (from 105 to 85).
Overall, from the various measures of confidence, we can see that the orthodox approach of Latvia to fiscal consolidation bred confidence among all the major actors, while the unorthodox measures in Hungary led to an increase in uncertainty and a deterioration in confidence. At an abstract level this means that the orthodox consolidation efforts emphasising expenditure essentially mean self-restraint of the state in interfering in the economy. Increasing state interference involves worsening institutional conditions, which undermines confidence. It is also very interesting to observe that this difference is not due to cultural factors: the orthodox consolidation in Hungary had very similar confidence effects to the orthodox consolidation in Latvia for all the major actors. This means that the actors matter – those who were blamed for causing the crisis could not be given credit for managing it.
Outcomes
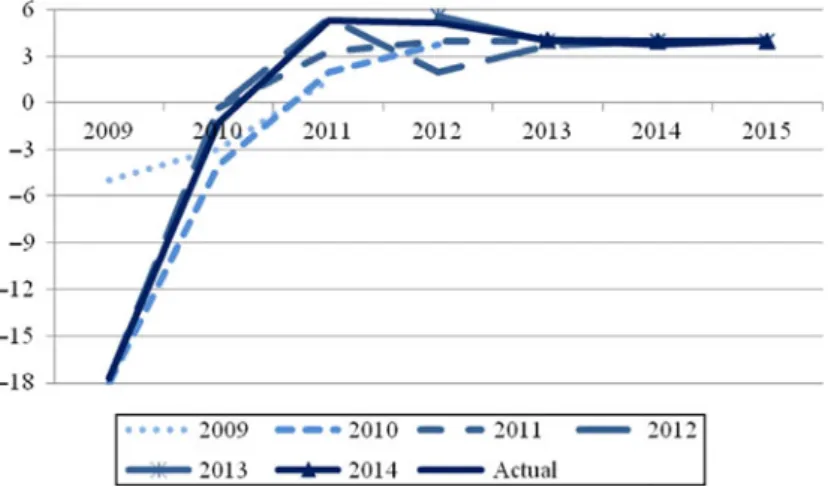
Figures 10and11show the growth outcomes of crisis management in the two countries by comparing forecasts in the convergence programmes and actual outcomes. We can see that in Latvia actual outcomes regularly surpassed forecasts, which is probably not independent from the confidence effects discussed above. By 2012 growth stabilised at around 4%, the highest rate in the EU. In contrast, actual outcomes in Hungary were
Figure 10. Forecast and actual growth in Latvia 2009 – 15. Source: Forecasts are from annual convergence reports, available from:http://ec.europa.eu/economy_finance/economic_governance/
sgp/convergence/index_en.htm. Actual growth figures come from European Commission (2014a, p. 48) with 2015 data as a forecast.
Downloaded by [Dóra Gyrffy] at 05:38 21 May 2015
consistently lower than the forecasts, showing the unintended consequences of adjustment.
While it recovered from 2013, it is unlikely to surpass 3% for GDP in the near future – according to the IMF (2014, pp. 16 – 17) the potential pontetial growth rate fell to 1.5 – 1.75% in the medium term, which is not only insufficient for convergence to the EU average but would also result in divergence from regional peers.
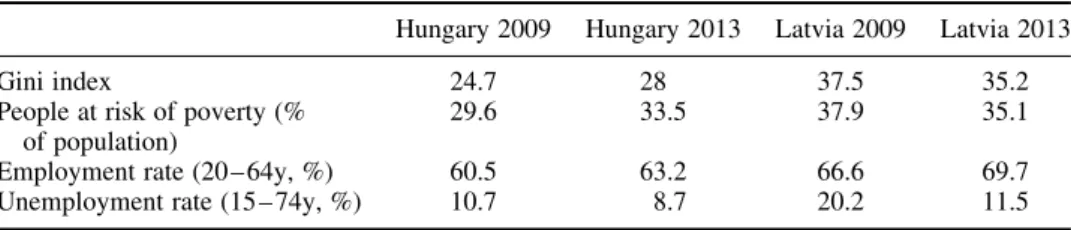
Critiques of the Latvian consolidation often mention the social consequences of the crisis, which include large-scale unemployment and a high level of inequality and poverty rates. Given the very low social spending, these criticisms are not without some basis.
However, when we look atTable 2and compare outcomes with Hungary, we can see that the unorthodox approach to adjustment was not much more favourable to social conditions. While inequality is still much higher in Latvia, since 2009 it shows a declining trend, while it is increasing in Hungary. The same is true regarding the ratio of people at risk of poverty – the two countries almost converge, which is rather surprising given the large difference between the rates of redistribution. Following a deep fall during the crisis, employment rates are increasing in both countries while the unemployment rate went down in both – in Latvia the fall has been especially sharp. Furthermore, in the case of Hungary we also have to note that most of the improvement on the labour market comes from public works programmes, which reached almost 10% of total employment by the end of 2013 (IMF2014, p. 21).
Figure 11. Forecast and actual growth in Hungary 2009 – 15. Source: Forecasts are from annual convergence reports, available from http://ec.europa.eu/economy_finance/economic_governance/
sgp/convergence/index_en.htm. Actual growth figures come from European Commission (2014a, p. 49) with 2015 data as a forecast.
Table 2. The social consequences of crisis management.
Hungary 2009 Hungary 2013 Latvia 2009 Latvia 2013
Gini index 24.7 28 37.5 35.2
People at risk of poverty (%
of population)
29.6 33.5 37.9 35.1
Employment rate (20 – 64y, %) 60.5 63.2 66.6 69.7
Unemployment rate (15 – 74y, %) 10.7 8.7 20.2 11.5
Source: Eurostat.
Downloaded by [Dóra Gyrffy] at 05:38 21 May 2015
Migration is often mentioned as the source of improvement in unemployment statistics in Latvia. While this factor certainly cannot be dismissed, from the perspective of the comparison it probably does not account fully for the better performance of Latvia for two reasons. First, while emigration increased sharply during the outbreak of the crisis, the data show a steadily declining trend of outward migration from Latvia since 2010.25 Second, migration has been increasing steadily in Hungary since the crisis – according to Go¨dri (2014), while prior to the crisis the number of emigrants was below 30,000 annually, their number reached 60,000 in 2011 and 80,000 in 2012. Even more striking is the fact that in 2013 33% of the 18 – 40 year-old population considered migration, and 47% of those aged 18 – 24. This implies that migration was probably as important for the Hungarian labour market improvement as in Latvia.
Overall we can see that the Latvian approach to adjustment was clearly superior to the unorthodox approach in Hungary. Although Latvia lags behind Hungary in a number of social indicators, most of these improved in Latvia while they worsened in Hungary. This implies that the Hungarian adjustment compares unfavourably on the basis of both growth and social outcomes.
Conclusions
Following the global financial crisis debates have revolved around matters of fiscal consolidation with a focus on the US, UK and the Eurozone countries. Given the extent of fiscal consolidation, the experiences of CEE-10 countries can also add to the discussion.
As we saw in the first part of this article, experience in the CEE-10 countries supports proponents of expenditure-based consolidation – those countries which cut expenditure more achieved better growth performance. On the basis of stylised facts this effect appears much stronger than the possibility of devaluation or the cyclicality of adjustment.
The cases of Hungary and Latvia were used to understand why expenditure-based consolidation worked better. The objective of the comparison was to tease out the differences between an adjustment guided by the principles of the pre-crisis consensus and an adjustment which was designed in opposition to this consensus (at least at the level of rhetoric). While both achieved substantial consolidation according to the main macroeconomic indicators, dynamic growth appeared only in the case of Latvia in spite of their relatively similar level of development. Although their consolidation showed some surprising similarities in philosophy, the non-cooperative and voluntaristic nature of the adjustment in Hungary had serious unintended effects. The undermining of the institutional structure in the name of adjustment increased uncertainty and resulted in a collapse of confidence among the major actors, which showed up in the level of interest rates and the weakening exchange rate. These factors undermined the effects of consolidation and led to the need for continuous further adjustment, resulting in an austerity spiral. The Latvian commitment to the orthodox approach worked in an opposite manner and succeeded in avoiding the problems created by the collapse of confidence in Hungary.
The comparison between the two countries leads to the conclusion that expenditure- based consolidation works because it can be considered as a sign of self-restraint by the state as well as a signal of shared understanding of the economy with market actors. This shows up in confidence measures, which are crucial for economic outcomes. Naturally we cannot easily generalise the experience of two countries, and we should be especially careful in generalising to developed countries with unlimited access to international financing. However, for emerging economies it appears that orthodox measures work better given the real possibility of abuse of power by the state.
Downloaded by [Dóra Gyrffy] at 05:38 21 May 2015
Acknowledgements
I am grateful for helpful comments on an earlier draft from La´szlo´ Csaba, Matteo Migheli and Urmas Varblane.
Disclosure statement
No potential conflict of interest was reported by the author.
Funding
The work was supported by a Bolyai Grant from the Hungarian Academy of Sciences.
Notes
1. Greece, Ireland, Italy, Portugal and Spain.
2. See for example Brender and Drazen (2005), Kaminskyet al.(2005), Talvi and Vegh (2005) and Alesinaet al.(2008).
3. Given the difficulties in separating the cyclical and structural components of fiscal policy, Fatas and Mihov (2010, p. 297) consider the calculation of the fiscal stance as one of the most controversial issues in the academic literature. The point is to differentiate between automatic stabilisers and discretionary fiscal policy, which can be related or unrelated to the economic cycle.
4. The pro-cyclicality of fiscal policy is mentioned by Oblath (2014) as a major factor in Hungarian divergence from its regional peers.
5. The following discussion on the path to crisis relies on Gyo˝rffy (2013, pp. 128 – 137).
6. This includes subsidised credit for housing, increases in the public sector wage bill, increases in pensions and other social security benefits.
7. Writing in 2007 they showed that in the absence of politically motivated spending since 2000 public debt would have been 36.9% of GDP 2006 instead of 66%.
8. Data from Eurostat.
9. By 2008 the share of foreign currency lending approached 70% of total household loans. For a detailed overview of the build-up of these loans see Hudecz (2012, pp. 381 – 386). I rely primarily on his assessment in the following discussion of the main causes of foreign currency lending in Hungary.
10. The complete lack of response to the growth of foreign currency lending is unique in the CEE region as shown by Bethlendi (2011, p. 211). Based on interviews with the participants, the reluctance of the government to constrain the credit boom is documented by Szentkira´lyi (2011). This was especially important, since financial supervision in Hungary is separate from the independent central bank, and the supervisory body (PSZAF) is under the authority of the Ministry of Finance.
11. As Erdo˝s (2012, pp. 121 – 122) explains, the absence of a stimulation effect of the tax cut was due to the fact that it favoured primarily those with high incomes, who are most likely either to increase their saving or to spend the money on imported goods, which means that there is no demand growth in the domestic economy.
12. For the detailed measures see Government of the Republic of Hungary (2011, pp. 74 – 76).
13. Under the debt rule public debt cannot be higher than 50% of GDP, and above this threshold the Parliament has to adopt a budget which contributes to reduction of the debt rate. The task of the new fiscal council is to evaluate the conformity of the proposed budget to this rule, with veto power over its adoption if it does not conform to the rule. However, the council has noex post power over the budget and there are also no rules about financing the debt reduction, which made the nationalisation of private pension funds an acceptable method. Even more importantly, the debt rule was postponed to 2016 by the Law on Financial Stability in 2011.
It is also important that, out of the three members of the fiscal council, two are clearly political appointees as the Head of the National Bank of Hungary and the Head of the State Audit Office.
For a critique of the debt rule see Baksay and Kiss (2013). For a comparison between the old and the new fiscal council see Curristineet al.(2013, pp. 20 – 23).
14. See European Commission (2014b, p. 32).
Downloaded by [Dóra Gyrffy] at 05:38 21 May 2015