REV. 0
a
ADE7756*
Active Energy Metering IC with Serial Interface
FUNCTIONAL BLOCK DIAGRAM
MULTIPLIER
DVDD
HPF1 LPF2
DGND
CLKOUT V1P
V1N
V2P V2N
2.4V REFERENCE
ADC AVDD
PGA
CLKIN REFIN/OUT
CF RESET
AGND 4k
PHCAL[5:0]
MULTIPLIER
APOS[11:0]
DFC
DIN DOUT SCLK CS
SAG ZX
IRQ ADE7756 REGISTERS
AND SERIAL INTERFACE
ADE7756
TEMP SENSOR
APGAIN[11:0]
CFDIV[11:0]
LPF1 ADC
FEATURES
High Accuracy, Supports IEC 687/1036
Less than 0.1% Error over a Dynamic Range of 1000 to 1 An On-Chip User Programmable Threshold for Line
Voltage SAG Detection and PSU Supervisory The ADE7756 Supplies Sampled Waveform Data
(20 Bits) and Active Energy (40 Bits)
Digital Power, Phase and Input Offset Calibration An On-Chip Temperature Sensor (3C Typical after
Calibration)
An SPI-Compatible Serial Interface
A Pulse Output with Programmable Frequency An Interrupt Request Pin (IRQ) and Status Register
Provide Early Warning of Register Overflow and Other Conditions
Proprietary ADCs and DSP Provide High Accuracy over Large Variations in Environmental Conditions and Time
Reference 2.4 V 8% (20 ppm/C Typical) with External Overdrive Capability
Single 5 V Supply, Low Power (25 mW Typical)
*U.S. Patents 5,745,323; 5,760,617; 5,862,069; 5,872,469; other pending.
GENERAL DESCRIPTION
The ADE7756 is a high-accuracy electrical power measurement IC with a serial interface and a pulse output. The ADE7756 incorporates two second-order sigma-delta ADCs, reference circuitry, temperature sensor, and all the signal processing required to perform active power and energy measurement.
The ADE7756 contains a sampled Waveform register and an Active Energy register capable of holding at least five seconds of accumulated power at full load. Data is read from the ADE7756 via the serial interface. The ADE7756 also provides a pulse output (CF) with a frequency that is proportional to the active power.
In addition to real power information, the ADE7756 also provides system calibration features, i.e., channel offset correction, phase calibration, and power calibration. The part also incorporates a detection circuit for short duration low voltage variations or sags.
The voltage threshold level and the duration (in number of half- line cycles) of the variation are user programmable. An open drain logic output (SAG) goes active low when a sag event occurs.
A zero crossing output (ZX) produces an output that is synchro- nized to the zero crossing point of the line voltage. This output can be used to extract timing or frequency information from the line.
The signal is also used internally to the chip in the calibration mode. This permits faster and more accurate calibration of the real power calculation. This signal is also useful for synchronization of relay switching with a voltage zero crossing, thus improving the relay life by reducing the risk of arcing.
The interrupt request output is an open drain, active low logic output. The IRQ output will become active when the accumu- lated real power register is half-full and also when the register overflows. A status register indicates the nature of the interrupt.
The ADE7756 is available in 20-lead DIP and 20-lead SSOP packages.
FEATURES . . . 1
GENERAL DESCRIPTION . . . 1
FUNCTIONAL BLOCK DIAGRAM . . . 1
ADE7756–SPECIFICATIONS . . . 3
TIMING CHARACTERISTICS . . . 5
ABSOLUTE MAXIMUM RATINGS . . . 6
ORDERING GUIDE . . . 6
PIN CONFIGURATION . . . 6
PIN FUNCTION DESCRIPTIONS . . . 6
TERMINOLOGY . . . 8
MEASUREMENT ERROR . . . 8
PHASE ERROR BETWEEN CHANNELS . . . 8
POWER SUPPLY REJECTION . . . 8
ADC OFFSET ERROR . . . 8
GAIN ERROR . . . 8
GAIN ERROR MATCH . . . 8
ANALOG INPUTS . . . 12
ZERO CROSSING DETECTION . . . 13
LINE VOLTAGE SAG DETECTION . . . 14
Sag Level Set . . . 14
POWER SUPPLY MONITOR . . . 14
INTERRUPTS . . . 15
Using the ADE7756 Interrupts with an MCU . . . 15
Interrupt Timing . . . 15
TEMPERATURE MEASUREMENT . . . 16
ANALOG-TO-DIGITAL CONVERSION . . . 16
Antialias Filter . . . 17
ADC Transfer Function . . . 17
Reference Circuit . . . 17
CHANNEL 1 ADC . . . 18
Channel 1 ADC Gain Adjust . . . 18
Channel 1 Sampling . . . 18
CHANNEL 2 ADC . . . 19
Channel 2 Sampling . . . 19
PHASE COMPENSATION . . . 20
ACTIVE POWER CALCULATION . . . 21
ENERGY CALCULATION . . . 22
Integration Times under Steady Load . . . 23
POWER OFFSET CALIBRATION . . . 23
ENERGY-TO-FREQUENCY CONVERSION . . . 23
ENERGY CALIBRATION . . . 24
CALIBRATING THE ENERGY METER . . . 24
Calculating the Average Active Power . . . 24
Calibrating the Frequency at CF . . . 24
Energy Meter Display . . . 25
CLKIN FREQUENCY . . . 25
APPLICATION INFORMATION . . . 25
SUSPENDING THE ADE7756 FUNCTIONALITY . . . . 26
SERIAL INTERFACE . . . 26
Serial Write Operation . . . 27
Serial Read Operation . . . 27
REGISTER DESCRIPTIONS . . . 29
Communications Register . . . 29
Mode Register (06H) . . . 30
Interrupt Status Register (04H)/Reset Interrupt Status Register (05H) . . . 31
OUTLINE DIMENSIONS . . . 32 TABLE OF CONTENTS
ADE7756
SPECIFICATIONS 1
Parameter A Version B Version Unit Test Conditions/Comments ENERGY MEASUREMENT ACCURACY
Measurement Bandwidth 14 14 kHz CLKIN = 3.579545 MHz
Measurement Error1 on Channel 1 Channel 2 = 300 mV rms/60 Hz, Gain = 2
Channel 1 Range = 1 V Full Scale
Gain = 1 0.1 0.1 % typ Over a Dynamic Range 1000 to 1
Gain = 2 0.1 0.1 % typ Over a Dynamic Range 1000 to 1
Gain = 4 0.1 0.1 % typ Over a Dynamic Range 1000 to 1
Gain = 8 0.1 0.1 % typ Over a Dynamic Range 1000 to 1
Gain = 16 0.1 0.1 % typ Over a Dynamic Range 1000 to 1
Channel 1 Range = 0.5 V Full Scale
Gain = 1 0.1 0.1 % typ Over a Dynamic Range 1000 to 1
Gain = 2 0.1 0.1 % typ Over a Dynamic Range 1000 to 1
Gain = 4 0.1 0.1 % typ Over a Dynamic Range 1000 to 1
Gain = 8 0.1 0.1 % typ Over a Dynamic Range 1000 to 1
Gain = 16 0.2 0.2 % typ Over a Dynamic Range 1000 to 1
Channel 1 Range = 0.25 V Full Scale
Gain = 1 0.1 0.1 % typ Over a Dynamic Range 1000 to 1
Gain = 2 0.1 0.1 % typ Over a Dynamic Range 1000 to 1
Gain = 4 0.1 0.1 % typ Over a Dynamic Range 1000 to 1
Gain = 8 0.2 0.2 % typ Over a Dynamic Range 1000 to 1
Gain = 16 0.2 0.2 % typ Over a Dynamic Range 1000 to 1
Phase Error1 Between Channels ±0.05 ±0.05 ° max Line Frequency = 45 Hz to 65 Hz, HPF On
AC Power Supply Rejection1 AVDD = DVDD = 5 V + 175 mV rms/120 Hz
Output Frequency Variation (CF) 0.2 0.2 % typ Channel 1 = 20 mV rms/60 Hz, Gain = 16, Range = 0.5 V
Channel 2 = 175 mV rms/60 Hz, Gain = 4
DC Power Supply Rejection1 AVDD = DVDD = 5 V ± 250 mV dc
Output Frequency Variation (CF) ±0.3 ±0.3 % typ Channel 1 = 20 mV rms/60 Hz, Gain = 16, Range = 0.5 V
Channel 2 = 175 mV rms/60 Hz, Gain = 4
ANALOG INPUTS See Analog Inputs Section
Maximum Signal Levels ±1 ±1 V max V1P, V1N, V2N and V2P to AGND
Input Impedance (dc) 390 390 kΩ min
Bandwidth 14 14 kHz CLKIN/256, CLKIN = 3.579545 MHz
Gain Error1, 2 External 2.5 V Reference, Gain = 1 on
Channel 1 and 2 Channel 1
Range = 1 V Full Scale ±4 ±4 % typ V1 = 1 V dc
Range = 0.5 V Full Scale ±4 ±4 % typ V1 = 0.5 V dc
Range = 0.25 V Full Scale ±4 ±4 % typ V1 = 0.25 V dc
Channel 2 ±4 ±4 % typ V2 = 1 V dc
Gain Error Match1 External 2.5 V Reference
Channel 1
Range = 1 V Full Scale ±0.3 ±0.3 % typ Gain = 1, 2, 4, 8, 16 Range = 0.5 V Full Scale ±0.3 ±0.3 % typ Gain = 1, 2, 4, 8, 16 Range = 0.25 V Full Scale ±0.3 ±0.3 % typ Gain = 1, 2, 4, 8, 16
Channel 2 ±0.3 ±0.3 % typ Gain = 1, 2, 4, 8, 16
Offset Error1
Channel 1 ±20 ±20 mV max Range = 1 V, Gain = 1
Channel 2 ±20 ±20 mV max Gain = 1
WAVEFORM SAMPLING Sampling CLKIN/128, 3.579545 MHz/128 =
27.9 kSPS
Channel 1 See Channel 1 Sampling
Signal-to-Noise Plus Distortion 62 62 dB typ 700 mV rms/60 Hz, Range = 1 V, Gain = 1
Bandwidth (–3 dB) 14 14 kHz CLKIN = 3.579545 MHz
Channel 2 See Channel 2 Sampling
(AVDD = DVDD = 5 V 5%, AGND = DGND = 0 V, On-Chip Reference, CLKIN = 3.579545 MHz XTAL, TMIN to TMAX = –40C to +85C, unless otherwise noted.)
ADE7756–SPECIFICATIONS
Parameter A Version B Version Unit Test Conditions/Comments REFERENCE INPUT
REFIN/OUT Input Voltage Range 2.6 2.6 V max 2.4 V + 8%
2.2 2.2 V min 2.4 V – 8%
Input Capacitance 10 10 pF max
ON-CHIP REFERENCE Nominal 2.4 V at REFIN/OUT Pin
Reference Error ±200 ±200 mV max
Load Current 10 10 µA max
Output Impedance 4 4 kΩ min
Temperature Coefficient ±20 ±20 ppm/°C typ
±80 ppm/°C max
CLKIN Note All Specifications CLKIN of 3.579545 MHz
Input Clock Frequency 10 10 MHz max
1 1 MHz min
LOGIC INPUTS
RESET, DIN, SCLK, CLKIN and CS
Input High Voltage, VINH 2.4 2.4 V min DVDD = 5 V ± 5%
Input Low Voltage, VINL 0.8 0.8 V max DVDD = 5 V ± 5%
Input Current, IIN ±3 ±3 µA max Typically 10 nA, VIN = 0 V to DVDD
Input Capacitance, CIN 10 10 pF max
LOGIC OUTPUTS
SAG and IRQ Open Drain Outputs, 10 kΩ Pull-Up Resistor
Output High Voltage, VOH 4 4 V min ISOURCE = 5 mA
Output Low Voltage, VOL 0.4 0.4 V max ISINK = 0.8 mA
ZX and DOUT
Output High Voltage, VOH 4 4 V min ISOURCE = 5 mA
Output Low Voltage, VOL 0.4 0.4 V max ISINK = 0.8 mA
CF
Output High Voltage, VOH 4 4 V min ISOURCE = 5 mA
Output Low Voltage, VOL 0.4 0.4 V max ISINK = 7 mA
POWER SUPPLY For Specified Performance
AVDD 4.75 4.75 V min 5 V – 5%
5.25 5.25 V max 5 V + 5%
DVDD 4.75 4.75 V min 5 V – 5%
5.25 5.25 V max 5 V + 5%
AIDD 3 3 mA max Typically 2.0 mA
DIDD 4 4 mA max Typically 3.0 mA
NOTES
1See Terminology section for explanation of specifications.
2See plots in Typical Performance Characteristic curves.
3See Analog Inputs section.
Specifications subject to change without notice
ADE7756
TIMING CHARACTERISTICS 1, 2
Parameter A, B Versions Unit Test Conditions/Comments Write Timing
t1 20 ns (min) CS falling edge to first SCLK falling edge.
t2 150 ns (min) SCLK logic high pulsewidth.
t3 150 ns (min) SCLK logic low pulsewidth.
t4 10 ns (min) Valid Data Setup time before falling edge of SCLK.
t5 5 ns (min) Data Hold time after SCLK falling edge.
t6 6.4 µs (min) Minimum time between the end of data byte transfers.
t7 4 µs (min) Minimum time between byte transfers during a serial write.
t8 100 ns (min) CS Hold time after SCLK falling edge.
Read Timing
t9 4 µs (min) Minimum time between read command (i.e., a write to Communication Register) and data read.
t10 4 µs (min) Minimum time between data byte transfers during a multibyte read.
t113 30 ns (min) Data access time after SCLK rising edge following a write to the Communications Register.
t124 100 ns (max) Bus relinquish time after falling edge of SCLK.
10 ns (min)
t134 100 ns (max) Bus relinquish time after rising edge of CS.
10 ns (min)
NOTES
1Sample tested during initial release and after any redesign or process change that may affect this parameter. All input signals are specified with tr = tf = 5 ns (10% to 90%) and timed from a voltage level of 1.6 V.
2See timing diagram below and Serial Interface section of this data sheet.
3Measured with the load circuit in Load Circuit for Timing Specifications and defined as the time required for the output to cross 0.8 V or 2.4 V.
4Derived from the measured time taken by the data outputs to change 0.5 V when loaded with the circuit in Load Circuit for Timing Specifications. The measured number is then extrapolated back to remove the effects of charging or discharging the 50 pF capacitor. This means that the time quoted in the timing characteristics is the true bus relinquish time of the part and is independent of the bus loading.
Specifications subject to change without notice.
200A
1.6mA IOL
CL 50pF TO OUTPUT PIN
2.1V
IOH
Figure 1. Load Circuit for Timing Specifications
t5
t4 CS
SCLK
DIN A4 A3 A2 A1 A0 DB7
MOST SIGNIFICANT BYTE
1 DB0 DB7 DB0
LEAST SIGNIFICANT BYTE 0 0
COMMAND BYTE
t1 t2 t3 t6
t7
t8
Figure 2. Serial Write Timing
CS
SCLK
DIN 0 0 0 A4 A3 A2 A1 A0
t1
t10
t13
t12
t9
t11 t11
(AVDD = DVDD = 5 V 5%, AGND = DGND = 0 V, On-Chip Reference, CLKIN = 3.579545 MHz XTAL, TMIN to TMAX = –40C to +85C, unless otherwise noted.)
CAUTION
ESD (electrostatic discharge) sensitive device. Electrostatic charges as high as 4000 V readily accumulate on the human body and test equipment and can discharge without detection. Although the ADE7756 features proprietary ESD protection circuitry, permanent damage may occur on devices subjected to high-energy electrostatic discharges. Therefore, proper ESD precautions are recommended to avoid performance degradation or loss of functionality.
WARNING!
ESD SENSITIVE DEVICE
ABSOLUTE MAXIMUM RATINGS*
(TA = 25°C unless otherwise noted)
AVDD to AGND . . . –0.3 V to +7 V DVDD to DGND . . . –0.3 V to +7 V DVDD to AVDD . . . –0.3 V to +0.3 V Analog Input Voltage to AGND
V1P, V1N, V2P and V2N . . . –6 V to +6 V Reference Input Voltage to AGND . . . –0.3 V to AVDD + 0.3 V Digital Input Voltage to DGND . . . –0.3 V to DVDD + 0.3 V Digital Output Voltage to DGND . . . –0.3 V to DVDD + 0.3 V Operating Temperature Range
Industrial (A, B Versions) . . . –40°C to +85°C Storage Temperature Range . . . –65°C to +150°C
Junction Temperature . . . 150°C 20-Lead Plastic DIP, Power Dissipation . . . 450 mW θJA Thermal Impedance . . . 105°C/W Lead Temperature, (Soldering 10 sec) . . . 260°C 20-Lead SSOP, Power Dissipation . . . 450 mW θJA Thermal Impedance . . . 112°C/W Lead Temperature, Soldering
Vapor Phase (60 sec) . . . 215°C Infrared (15 sec) . . . 220°C
*Stresses above those listed under Absolute Maximum Ratings may cause perma- nent damage to the device. This is a stress rating only; functional operation of the device at these or any other conditions above those listed in the operational sections of this specification is not implied. Exposure to absolute maximum rating conditions for extended periods may affect device reliability.
ORDERING GUIDE
Model Package Description Package Option
ADE7756AN Plastic DIP N-20
ADE7756BN Plastic DIP N-20
ADE7756ARS Shrink Small Outline Package in Tubes RS-20
ADE7756ARSRL Shrink Small Outline Package in Tubes RS-20
ADE7756BRS Shrink Small Outline Package in Tubes RS-20
ADE7756BRSRL Shrink Small Outline Package in Reel RS-20
EVAL-ADE7756EB ADE7756 Evaluation Board
ADE7756AN-REF ADE7756 Reference Design
PIN CONFIGURATION DIP and SSOP Packages
TOP VIEW (Not to Scale)
20 19 18 17 16 15 14 13 12 11 1
2 3 4 5 6 7 8 9 10
ADE7756
DGND REFIN/OUT AGND DVDD AVDD V1P
V2P V2N V1N
CF ZX SAG DOUT SCLK CS
IRQ CLKIN CLKOUT
RESET DIN
ADE7756
PIN FUNCTION DESCRIPTIONS Pin No. Mnemonic Description
1 RESET Reset Pin for the ADE7756. A logic low on this pin will hold the ADCs and digital circuitry (including the Serial Interface) in a reset condition.
2 DVDD Digital Power Supply. This pin provides the supply voltage for the digital circuitry in the ADE7756.
The supply voltage should be maintained at 5 V ± 5% for specified operation. This pin should be decoupled to DGND with a 10 µF capacitor in parallel with a ceramic 100 nF capacitor.
3 AVDD Analog Power Supply. This pin provides the supply voltage for the analog circuitry in the ADE7756.
The supply should be maintained at 5 V ± 5% for specified operation. Every effort should be made to minimize power supply ripple and noise at this pin by the use of proper decoupling. The typical per- formance graphs in this data sheet show the power supply rejection performance. This pin should be decoupled to AGND with a 10 µF capacitor in parallel with a ceramic 100 nF capacitor.
4, 5 V1P, V1N Analog Inputs for Channel 1. This channel is intended for use with the current transducer. These inputs are fully differential voltage inputs with maximum differential input signal levels of ±1 V, ±0.5 V and ±0.25 V, depending on the full-scale selection. See Analog Inputs section. Channel 1 also has a PGA with gain selections of 1, 2, 4, 8, or 16. The maximum signal level at these pins with respect to AGND is ±1 V. Both inputs have internal ESD protection circuitry and in addition an overvoltage of
±6 V can be sustained on these inputs without risk of permanent damage.
6, 7 V2N, V2P Analog Inputs for Channel 2. This channel is intended for use with the voltage transducer. These inputs are fully differential voltage inputs with a maximum differential signal level of ±1 V. Channel 2 also has a PGA with gain selections of 1, 2, 4, 8, or 16. The maximum signal level at these pins with respect to AGND is ±1 V. Both inputs have internal ESD protection circuitry, and an overvoltage of
±6 V can be sustained on these inputs without risk of permanent damage.
8 AGND This pin provides the ground reference for the analog circuitry in the ADE7756, i.e., ADCs and refer- ence. This pin should be tied to the analog ground plane or the quietest ground reference in the system.
This quiet ground reference should be used for all analog circuitry, e.g., antialiasing filters, current and voltage transducers, etc. In order to keep ground noise around the ADE7756 to a minimum, the quiet ground plane should only be connected to the digital ground plane at one point. It is acceptable to place the entire device on the analog ground plane—see Applications Information section.
9 REFIN/OUT This pin provides access to the on-chip voltage reference. The on-chip reference has a nominal value of 2.4 V ± 8% and a typical temperature coefficient of 20 ppm/°C. An external reference source may also be connected at this pin. In either case this pin should be decoupled to AGND with a 1 µF ceramic capacitor.
10 DGND This provides the ground reference for the digital circuitry in the ADE7756, i.e., multiplier, filters, and digital-to-frequency converter. Because the digital return currents in the ADE7756 are small, it is acceptable to connect this pin to the analog ground plane of the system—see Applications Information section. However, high bus capacitance on the DOUT pin may result in noisy digital current which could affect performance.
11 CF Calibration Frequency Logic Output. The CF logic output gives Active Power information. This out- put is intended to be used for operational and calibration purposes. The full-scale output frequency can be adjusted by writing to the CFDIV Register—see Energy To Frequency Conversion section.
12 ZX Voltage Waveform (Channel 2) Zero Crossing Output. This output toggles logic high and low at the zero crossing of the differential signal on Channel 2—see Zero Crossing Detection section.
13 SAG This open drain logic output goes active low when either no zero crossings are detected or a low volt- age threshold (Channel 2) is crossed for a specified duration. See Line Voltage Sag Detection section.
14 IRQ Interrupt Request Output. This is an active low open drain logic output. Maskable interrupts include:
Active Energy Register roll-over, Active Energy Register at half level, and arrivals of new waveform samples—see Interrupts section.
15 CLKIN Master clock for ADCs and digital signal processing. An external clock can be provided at this logic input. Alternatively, a parallel resonant AT crystal can be connected across CLKIN and CLKOUT to provide a clock source for the ADE7756. The clock frequency for specified operation is 3.579545 MHz.
Ceramic load capacitors of between 22 pF and 33 pF should be used with the gate oscillator circuit.
Refer to crystal manufacturers data sheet for load capacitance requirements.
16 CLKOUT A crystal can be connected across this pin and CLKIN as described above to provide a clock source for the ADE7756. The CLKOUT pin can drive one CMOS load when either an external clock is
Pin No. Mnemonic Description
17 CS Chip Select. Part of the 4-Wire SPI Serial Interface. This active low logic input allows the ADE7756 to share the serial bus with several other devices—see Serial Interface section.
18 SCLK Serial Clock Input for the Synchronous Serial Interface. All Serial data transfers are synchronized to this clock. See Serial Interface section. The SCLK has a Schmitt-trigger input for use with a clock source that has a slow edge transition time, e.g., opto-isolator outputs.
19 DOUT Data Output for the Serial Interface. Data is shifted out at this pin on the rising edge of SCLK. This logic output is normally in a high impedance state unless it is driving data onto the serial data bus—
see Serial Interface section.
20 DIN Data Input for the Serial Interface. Data is shifted in at this pin on the falling edge of SCLK—see Serial Interface section.
TERMINOLOGY MEASUREMENT ERROR
The error associated with the energy measurement made by the ADE7756 is defined by the following formula:
Percentage Error =
Energy by ADE True Energy True Energy
Registered 7756 – 100
%
×
PHASE ERROR BETWEEN CHANNELS
The HPF (High-Pass Filter) in Channel 1 has a phase lead response. To offset this phase response and equalize the phase response between channels, a phase correction network is also placed in Channel 1. The phase correction network ensures a phase match between Channel 1 (current) and Channel 2 (volt- age) to within ±0.1° over a range of 45 Hz to 65 Hz and ±0.2° over a range 40 Hz to 1 kHz.
POWER SUPPLY REJECTION
This quantifies the ADE7756 measurement error as a percent- age of reading when the power supplies are varied. For the ac PSR measurement, a reading at nominal supplies (5 V) is taken.
A second reading is obtained with the same input signal levels when an ac (175 mV rms/120 Hz) signal is introduced onto the supplies. Any error introduced by this ac signal is expressed as a percentage of reading—see Measurement Error definition above.
For the dc PSR measurement, a reading at nominal supplies (5 V) is taken. A second reading is obtained with the same input signal levels when the supplies are varied ±5%. Any error intro- duced is again expressed as a percentage of reading.
ADC OFFSET ERROR
This refers to the dc offset associated with the analog inputs to the ADCs. It means that with the analog inputs connected to AGND the ADCs still see a dc analog input signal. The magni- tude of the offset depends on the gain and input range selection
—see Typical Performance Characteristics. However, when HPF1 is switched on the offset is removed from Channel 1 (current) and the power calculation is not affected by this offset. The offsets may be removed by performing an offset calibration—see Analog Inputs section.
GAIN ERROR
The gain error in the ADE7756 ADCs is defined as the differ- ence between the measured ADC output code (minus the offset) and the ideal output code—see Channel 1 ADC and Channel 2 ADC section. It is measured for each of the input ranges on Channel 1 (1 V, 0.5 V and 0.25 V ). The difference is expressed as a percentage of the ideal code.
GAIN ERROR MATCH
The Gain Error Match is defined as the gain error (minus the offset) obtained when switching between a gain of 1 (for each of the input ranges) and a gain of 2, 4, 8, or 16. It is expressed as a percentage of the output ADC code obtained under a gain of 1.
This gives the gain error observed when the gain selection is changed from 1 to 2, 4, 8, or 16.
Typical Performance Characteristics–ADE7756
AMPS 0.01
% ERROR
–0.50 –0.40 –0.30 –0.20 –0.10 0 0.10 0.20 0.30 0.40 0.50
0.10 1.0 10.0 100.0
PF = 1 GAIN = 1
ON-CHIP REFERENCE
–40C
+25C +85C
TPC 1. Error as a % of Reading (Power Factor = 1, Internal Reference, Gain = 1)
AMPS 0.01
% ERROR
–0.50 –0.40 –0.30 –0.20 –0.10 0 0.10 0.20 0.30 0.40 0.50
0.10 1.0 10.0 100.0
PF = 1 GAIN = 2
ON-CHIP REFERENCE
–40C
+25C +85C
TPC 2. Error as a % of Reading (Power Factor = 1, Internal Reference, Gain = 2)
AMPS 0.01
% ERROR
–0.50 –0.40 –0.30 –0.20 –0.10 0 0.10 0.20 0.30 0.40 0.50
0.10 1.0 10.0 100.0
PF = 1 GAIN = 4
ON-CHIP REFERENCE –40C
+25C +85C
TPC 3. Error as a % of Reading (Power Factor = 1, Internal Reference, Gain = 4)
AMPS 0.01
% ERROR
–0.50 –0.40 –0.30 –0.20 –0.10 0 0.10 0.20 0.30 0.40 0.50
0.10 1.0 10.0 100.0
PF = 0.5 GAIN = 1
ON-CHIP REFERENCE
–40C, PF = 0.5
+25C, PF = 0.5 +85C, PF = 0.5
+25C, PF = 1.0
TPC 4. Error as a % of Reading (Power Factor = 0.5, Internal Reference, Gain = 1)
AMPS 0.01
% ERROR
–0.50 –0.40 –0.30 –0.20 –0.10 0 0.10 0.20 0.30 0.40 0.50
0.10 1.0 10.0 100.0
PF = 0.5 GAIN = 2
ON-CHIP REFERENCE
–40C, PF = 0.5
+25C, PF = 0.5 +85C, PF = 0.5
+25C, PF = 1.0
TPC 5. Error as a % of Reading (Power Factor = 0.5, Internal Reference, Gain = 2)
AMPS 0.01
% ERROR
–0.50 –0.40 –0.30 –0.20 –0.10 0 0.10 0.20 0.30 0.40 0.50
0.10 1.0 10.0 100.0
PF = 0.5 GAIN = 4
ON-CHIP REFERENCE
–40C, PF = 0.5
+25C, PF = 0.5 +85C, PF = 0.5
+25C, PF = 1.0
TPC 6. Error as a % of Reading (Power Factor = 0.5, Internal Reference, Gain = 4)
AMPS 0.01
% ERROR
–0.50 –0.40 –0.30 –0.20 –0.10 0 0.10 0.20 0.30 0.40 0.50
0.10 1.0 10.0 100.0
PF = 1 GAIN = 8
ON-CHIP REFERENCE
–40C +25C +85C
TPC 7. Error as a % of Reading (Power Factor = 1, Internal Reference, Gain = 8)
AMPS 0.01
% ERROR
–0.50 –0.40 –0.30 –0.20 –0.10 0 0.10 0.20 0.30 0.40 0.50
0.10 1.0 10.0 100.0
PF = 1 GAIN = 16
ON-CHIP REFERENCE
–40C +25C +85C
TPC 8. Error as a % of Reading (Power Factor = 1, Internal Reference, Gain = 16)
AMPS 0.01
% ERROR
–0.50 –0.40 –0.30 –0.20 –0.10 0 0.10 0.20 0.30 0.40 0.50
0.10 1.0 10.0 100.0
PF = 1 GAIN = 1
EXTERNAL REFERENCE
–40C +25C
+85C
TPC 9. Error as a % of Reading (Power Factor = 1, External Reference, Gain = 1)
AMPS 0.01
% ERROR
–0.50 –0.40 –0.30 –0.20 –0.10 0 0.10 0.20 0.30 0.40 0.50
0.10 1.0 10.0 100.0
PF = 0.5 GAIN = 8
ON-CHIP REFERENCE
–40C, PF = 0.5 +25C, PF = 0.5 +85C, PF = 0.5
+25C, PF = 1.0
TPC 10. Error as a % of Reading (Power Factor = 0.5, Internal Reference, Gain = 8)
AMPS 0.01
% ERROR
–0.50 –0.40 –0.30 –0.20 –0.10 0 0.10 0.20 0.30 0.40 0.50
0.10 1.0 10.0 100.0
PF = 0.5 GAIN = 16
ON-CHIP REFERENCE
–40C, PF = 0.5
+25C, PF = 0.5 +85C, PF = 0.5
+25C, PF = 1.0
TPC 11. Error as a % of Reading (Power Factor = 0.5, Internal Reference, Gain = 16)
AMPS 0.01
% ERROR
–0.50 –0.40 –0.30 –0.20 –0.10 0 0.10 0.20 0.30 0.40 0.50
0.10 1.0 10.0 100.0
PF = 1 GAIN = 2
EXTERNAL REFERENCE
–40C +85C
+25C
TPC 12. Error as a % of Reading (Power Factor = 1, External Reference, Gain = 2)
ADE7756
33nF 1k RB
RB 1k
33nF
1k 33nF
1k 33nF 1M
100nF 10F
AVDD DVDD RESET 10F
40A TO 40mA
VDD
100nF 10F
V1P
V1N
V2N
V2P
REFIN/OUT
DOUT SCLK CS
CLKOUT CLKIN IRQ DIN
SAG ZX CF AGND DGND
22pF
TO FREQUENCY COUNTER U3
NOT CONNECTED TO
SPI BUS (USED ONLY FOR CALIBRATION)
110V
1 2 4 8 16
15.8 7.5 4.0 2.0 1.0 GAIN(CH1)
CT TURN RATIO = 1800:1 CHANNEL 2 GAIN = 4
RB
U1
ADE7756
100nF
Y1 3.58MHz
22pF
PS2501-1
TPC 13. Test Circuit for Performance Curves
AMPS 0.01
% ERROR
–0.50 –0.40 –0.30 –0.20 –0.10 0 0.10 0.20 0.30 0.40 0.50
0.10 1.0 10.0 100.0
5.25V
4.75V 5.0V
TPC 14. PSR with Internal Reference
FREQUENCY – Hz 45
% ERROR
–0.6
50 55 60
PF = 1
–0.4 –0.2 0 0.2 0.4 0.6 0.8
65 70 75
PF = 0.5
TPC 15. Error as a % of Reading over Frequency
AMPS 0.01
% ERROR
–0.50 –0.40 –0.30 –0.20 –0.10 0 0.10 0.20 0.30 0.40 0.50
0.10 1.0 10.0 100.0
5.25V
4.75V 5.0V
TPC 16. PSR with External Reference
ANALOG INPUTS
The ADE7756 has two fully differential voltage input channels.
The maximum differential input voltage for each input pair (V1P/V1N and V2P/V2N) is ±1 V. In addition, the maximum signal level on each analog input (V1P, V1N, V2P, and V2N) is also ±1 V with respect to AGND.
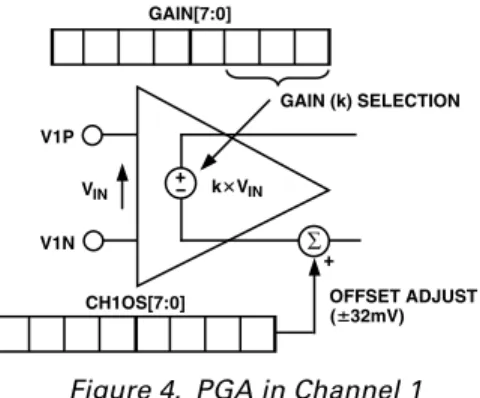
Each analog input channel has a PGA (Programmable Gain Amplifier) with possible gain selections of 1, 2, 4, 8, and 16.
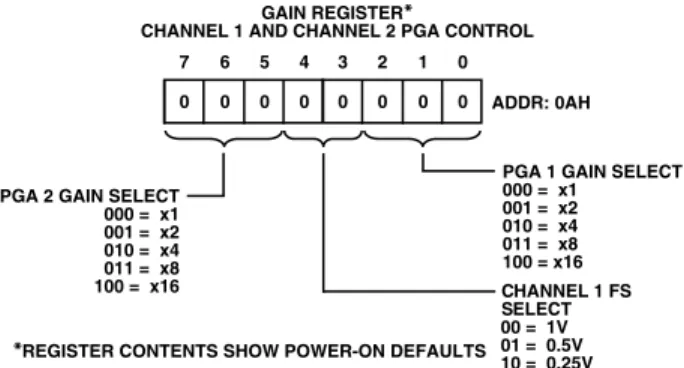
The gain selections are made by writing to the Gain regis- ter—see Figure 5. Bits 0 to 2 select the gain for the PGA in Channel 1 and the gain selection for the PGA in Channel 2 is made via bits 5 to 7. Figure 4 shows how a gain selection for Channel 1 is made using the Gain register.
V1P
V1N VIN
GAIN[7:0]
CH1OS[7:0]
GAIN (k) SELECTION
OFFSET ADJUST (32mV) kVIN
Figure 4. PGA in Channel 1
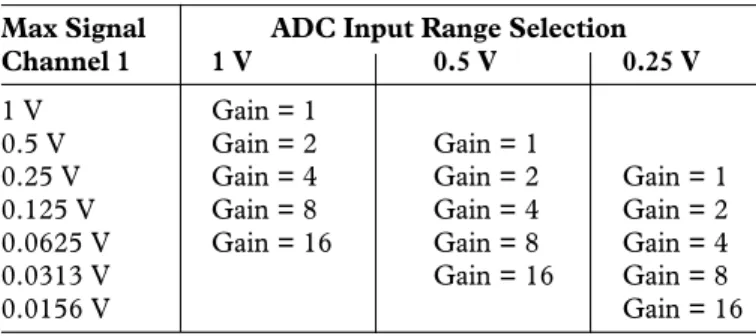
In addition to the PGA, Channel 1 also has a full-scale input range selection for the ADC. The ADC analog input range selec- tion is also made using the Gain register—see Figure 5. As mentioned previously, the maximum differential input voltage is
±1 V However, by using Bits 3 and 4 in the Gain register, the maximum ADC input voltage can be set to 1 V, 0.5 V, or 0.25 V.
This is achieved by adjusting the ADC reference—see Reference Circuit section. Table I summarizes the maximum differential input signal level on Channel 1 for the various ADC range and gain selections.
Table I. Maximum Input Signal Levels for Channel 1 Max Signal ADC Input Range Selection
Channel 1 1 V 0.5 V 0.25 V
1 V Gain = 1
0.5 V Gain = 2 Gain = 1
0.25 V Gain = 4 Gain = 2 Gain = 1
0.125 V Gain = 8 Gain = 4 Gain = 2
0.0625 V Gain = 16 Gain = 8 Gain = 4
0.0313 V Gain = 16 Gain = 8
0.0156 V Gain = 16
GAIN REGISTER*
CHANNEL 1 AND CHANNEL 2 PGA CONTROL
ADDR: 0AH
PGA 2 GAIN SELECT 000 = x1 001 = x2 010 = x4 011 = x8 100 = x16
*REGISTER CONTENTS SHOW POWER-ON DEFAULTS
PGA 1 GAIN SELECT 000 = x1
001 = x2 010 = x4 011 = x8 100 = x16 CHANNEL 1 FS SELECT 00 = 1V 01 = 0.5V 10 = 0.25V
0 0 0 0 0 0 0 0
7 6 5 4 3 2 1 0
Figure 5. Analog Gain Register
It is also possible to adjust offset errors on Channel 1 and Channel 2 by writing to the Offset Correction Registers (CH1OS and CH2OS respectively). These registers allow channel offsets in the range ±20 mV to ±60 mV (depending on the gain setting) to be removed. Note that it is not necessary to perform an offset correc- tion in an Energy measurement application if HPF1 in Channel 1 is switched on. Figure 6 shows the effect of offsets on the real power calculation. As can be seen from Figure 6, an offset on Channel 1 and Channel 2 will contribute a dc component after multiplication. Since this dc component is extracted by LPF2 to generate the Active (Real) Power information, the offsets will have contributed an error to the Active Power calculation. This problem is easily avoided by enabling HPF1 in Channel 1. By removing the offset from at least one channel, no error compo- nent can be generated at dc by the multiplication. Error terms at Cos(ωt) are removed by LPF2 and by integration of the Active Power signal in the Active Energy register (AENERGY[39:0]).
See Energy Calculation section.
VI 2
FREQUENCY – RADS/Sec 2
0 VOSIOS
VOSI IOSV
DC COMPONENT (INCLUDING ERROR TERM) IS EXTRACTED BY THE LPF FOR REAL POWER CALCULATION
Figure 6. Effect of Channel Offsets on the Real Power Calculation
ADE7756
The contents of the Offset Correction registers are 6-bit, sign and magnitude coded. The weighting of the LSB size depends on the gain setting, i.e., 1, 2, 4, 8, or 16. Table II below shows the correctable offset span for each of the gain settings and the LSB weight (mV) for the Offset Correction registers. The maximum value that can be written to the Offset Correction registers is ±31 decimal—see Figure 7.
Table II. Offset Correction Range
Gain Correctable Span LSB Size
1 ±60 mV 1.88 mV/LSB
2 ±40 mV 1.25 mV/LSB
4 ±25 mV 0.78 mV/LSB
8 ±23 mV 0.72 mV/LSB
16 ±20 mV 0.63 mV/LSB
Figure 7 shows the relationship between the Offset Correction register contents and the offset (mV) on the analog inputs for a gain setting of one. In order to perform an offset adjustment, The analog inputs should be first connected to AGND. There should be no signal on either Channel 1 or Channel 2. A read from Channel 1 or Channel 2 using the waveform register will give an indication of the offset in the channel. This offset can be canceled by writing an equal and opposite offset value to the relevant offset register. The offset correction can be confirmed by performing another read. Note when adjusting the offset of Channel 1, one needs to ensure the HPF has been disabled in the Mode Register.
CH1OS[7:0]
00h 1Fh
3Fh
+60mV
–60mV 0mV
OFFSET ADJUST
00 11, 1111B
SIGN + 5 BITS
SIGN + 5 BITS 00 01, 1111B
Figure 7. Channel Offset Correction Range (Gain = 1) ZERO CROSSING DETECTION
The ADE7756 has a zero crossing detection circuit on Channel 2. This zero crossing is used to produce an external zero cross signal (ZX) and it is also used in the calibration mode—see Energy Calibration section. The zero crossing signal is also used to initiate a temperature measurement on the ADE7756—see Temperature Measurement section.
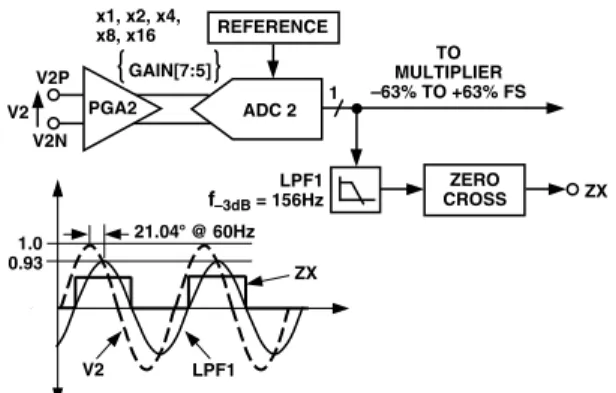
Figure 8 shows how the zero cross signal is generated from the output of LPF1.
V2 LPF1
ZX 21.04 @ 60Hz 0.93
1.0 V2P
V2N
ADC 2 1 x1, x2, x4,
x8, x16 REFERENCE GAIN[7:5]
V2
TO MULTIPLIER –63% TO +63% FS
LPF1
f–3dB = 156Hz ZERO ZX
CROSS PGA2
Figure 8. Zero Cross Detection on Channel 2 The ZX signal will go logic high on a positive going zero crossing and logic low on a negative going zero crossing on Channel 2.
The zero crossing signal ZX is generated from the output of LPF1.
LPF1 has a single pole at 156 Hz (at CLKIN = 3.579545 MHz).
As a result there will be a phase lag between the analog input signal V2 and the output of LPF1. The phase response of this filter is shown in the Channel 2 Sampling section of this data sheet. The phase lag response of LPF1 results in a time delay of approximately 0.97 ms (@ 60 Hz) between the zero crossing on the analog inputs of Channel 2 and the rising or falling edge of ZX.
The zero crossing detection also has an associated time-out register ZXTOUT. This unsigned, 12-bit register is decre- mented (1 LSB) every 128/CLKIN seconds. The register is reset to its user-programmed full-scale value every time a zero crossing on Channel 2 is detected. The default power-on value in this register is FFFh. If the register decrements to zero before a zero crossing is detected, and the DISSAG bit in the Mode register is Logic 0, the SAG pin will go active low. The absence of a zero crossing is also indicated on the IRQ output if the SAG enable bit in the Interrupt Enable register is set to Logic 1.
Irrespective of the enable bit setting, the SAG flag in the Inter- rupt Status register is always set when the ZXTOUT register is decremented to zero—see ADE7756 Interrupts section.
The Zero-Cross Time-Out register can be written/read by the user and has an address of 0Eh—see Serial Interface section.
The resolution of the register is 128/CLKIN seconds per LSB.
Thus the maximum delay for an interrupt is 0.15 second (128/
CLKIN × 212).
LINE VOLTAGE SAG DETECTION
In addition to the detection of the loss of the line voltage signal (zero crossing), the ADE7756 can also be programmed to detect when the absolute value of the line voltage drops below a certain peak value, for a number of half-cycles. This condition is illus- trated in Figure 9.
SAGCYC[7:0] = 06H 6 HALF-CYCLES SAGLVL[7:0]
FULL SCALE
CHANNEL 2
SAG
SAG RESET HIGH WHEN CHANNEL 2 EXCEEDS SAGLVL[7:0]
Figure 9. ADE7756 Sag Detection
Figure 9 shows the line voltage fall below a threshold that is set in the Sag Level register (SAGLVL[7:0]) for nine half-cycles.
Since the Sag Cycle register (SAGCYC[7:0]) contains 06h, the SAG pin will go active low at the end of the sixth half-cycle for which the line voltage falls below the threshold, if the DISSAG bit in the Mode register is Logic 0. As is the case when zero- crossings are no longer detected, the sag event is also recorded by setting the SAG flag in the Interrupt Status register. If the SAG enable bit is set to Logic 1, the IRQ logic output will go active low—see ADE7756 Interrupts section.
The SAG pin will go logic high again when the absolute value of the signal on Channel 2 exceeds the sag level set in the Sag Level register. This is shown in Figure 9 when the SAG pin goes high during the tenth half-cycle from the time when the signal on Channel 2 first dropped below the threshold level.
Sag Level Set
The contents of the Sag Level register (1 byte) are compared to the absolute value of the most significant byte output from LPF1, after it is shifted left by one bit. Thus for example the nominal maximum code from LPF1 with a full scale signal on Channel 2 is 1C396h or (0001, 1100, 0011, 1001, 0110b)—see Channel 2 Sampling section. Shifting one bit left will give 0011,
1000, 0111, 0010, 1100b or 3872Ch. Therefore writing 38h to the Sag Level register will put the sag detection level at full scale. Writing 00h will put the sag detection level at zero. The Sag Level register is compared to the most significant byte of a waveform sample after the shift left and detection is made when the contents of the sag level register are greater.
POWER SUPPLY MONITOR
The ADE7756 also contains an on-chip power supply monitor.
The Analog Supply (AVDD) is continuously monitored by the ADE7756. If the supply is less than 4 V ± 5%, the ADE7756 will be inactive, i.e., no energy will accumulate regardless of the input signals at Channel 1 and Channel 2. This is useful to ensure correct device operation at power-up and during power-down.
The power supply monitor has built-in hysteresis and filtering.
This gives a high degree of immunity to false triggering due to noisy supplies.
TIME AVDD
0V 4V 5V
ADE7756 POWER-ON RESET
INACTIVE ACTIVE
SAG
INACTIVE
Figure 10. On-Chip Power Supply Monitor As can be seen from Figure 10, the trigger level is nominally set at 4 V. The tolerance on this trigger level is about ±5%. The SAG pin can also be used as a power supply monitor input to the MCU. The SAG pin will go logic low when the ADE7756 is reset. The power supply and decoupling for the part should be such that the ripple at AVDD does not exceed 5 V ± 5% as specified for normal operation.
ADE7756
INTERRUPTS
Interrupts are managed through the Interrupt Status register (STATUS[7:0]) and the Interrupt Enable register (IRQEN[7:0]).
When an interrupt event occurs in the ADE7756, the corre- sponding flag in the Status register is set to a Logic 1—see Interrupt Status register. If the enable bit for this interrupt in the Interrupt Enable register is Logic 1, the IRQ logic output goes active low. The flag bits in the Status register are set irre- spective of the state of the enable bits.
In order to determine the source of the interrupt, the system mas- ter (MCU) should perform a read from the Status register with reset (RSTATUS[7:0]). This is achieved by carrying out a read from address 05h. The IRQ output will go logic high on comple- tion of the Interrupt Status register read command—see Interrupt Timing section. When carrying out a read with reset the ADE7756 is designed to ensure that no interrupt events are missed. If an interrupt event occurs just as the Status register is being read, the event will not be lost and the IRQ logic output is guaranteed to go high for the duration of the Interrupt Status register data transfer before going logic low again to indicate the pending interrupt. See the next section for a more detailed description.
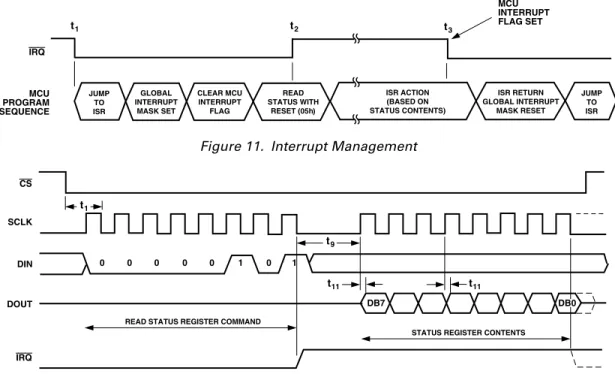
Using the ADE7756 Interrupts with an MCU
Shown in Figure 11 is a timing diagram that shows a sug- gested implementation of ADE7756 interrupt management using an MCU. At time t1 the IRQ line will go active low indi- cating that one or more interrupt events have occurred in the ADE7756. The IRQ logic output should be tied to a negative edge-triggered external interrupt on the MCU. On detection of
the negative edge, the MCU should be configured to start execut- ing its Interrupt Service Routine (ISR). On entering the ISR, all interrupts should be disabled using the global interrupt enable bit. At this point the MCU external interrupt flag can be cleared in order to capture interrupt events that occur during the current ISR. When the MCU interrupt flag is cleared a read from the Status register with reset is carried out. This will cause the IRQ line to be reset logic high (t2)—see Interrupt timing section. The Status register contents are used to determine the source of the interrupt(s) and hence the appropriate action to be taken. If a subsequent interrupt event occurs during the ISR, that event will be recorded by the MCU external interrupt flag being set again (t3). On returning from the ISR, the global interrupt mask will be cleared (same instruction cycle) and the external interrupt flag will cause the MCU to jump to its ISR once again. This will ensure that the MCU does not miss any external interrupts.
Interrupt Timing
The Serial Interface section should be reviewed first, before reviewing the interrupt timing. As previously described, when the IRQ output goes low the MCU ISR must read the Interrupt Status register in order to determine the source of the interrupt.
When reading the Status register contents, the IRQ output is set high on the last falling edge of SCLK of the first byte transfer (read Interrupt Status register command). The IRQ output is held high until the last bit of the next 8-bit transfer is shifted out (Interrupt Status register contents). See Figure 12. If an inter- rupt is pending at this time, the IRQ output will go low again. If no interrupt is pending the IRQ output will stay high.
IRQ
JUMP TO ISR
GLOBAL INTERRUPT
MASK SET
CLEAR MCU INTERRUPT
FLAG
READ STATUS WITH
RESET (05h)
ISR ACTION (BASED ON STATUS CONTENTS)
ISR RETURN GLOBAL INTERRUPT
MASK RESET MCU INTERRUPT FLAG SET
JUMP TO ISR MCU
PROGRAM SEQUENCE
t3 t2
t1
Figure 11. Interrupt Management
SCLK
DIN
DOUT
IRQ
t9 t1
t11 t11
READ STATUS REGISTER COMMAND
STATUS REGISTER CONTENTS DB7
CS
0 0 0 0 0 1 0 1
DB0
Figure 12. Interrupt Timing
TEMPERATURE MEASUREMENT
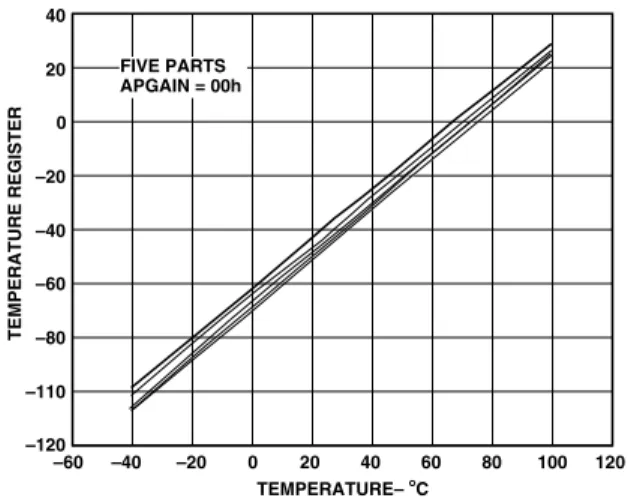
ADE7756 also includes an on-chip temperature sensor. A tem- perature measurement can be made by setting Bit 5 in the Mode register. When Bit 5 is set logic high in the Mode register, the ADE7756 will initiate a temperature measurement on the next zero crossing. When the zero crossing on Channel 2 is detected, the voltage output from the temperature sensing circuit is con- nected to ADC1 (Channel 1) for digitizing. The resultant code is processed and placed in the Temperature register (TEMP[7:0]) approximately 26 µs later (24 CLKIN cycles). If enabled in the Interrupt Enable register (Bit 5), the IRQ output will go active low when the temperature conversion is finished. Please note that temperature conversion will introduce a small amount of noise in the energy calculation. If temperature conversion is performed frequently (e.g., multiple times per second), a noticeable error will accumulate in the resulting energy calcu- lation over time.
The contents of the Temperature register are signed (two’s complement) with a resolution of approximately 1 LSB/°C. The temperature register will produce a code of 00h when the ambi- ent temperature is approximately 70°C—see Figure 13. The temperature measurement is uncalibrated in the ADE7756 and has an offset tolerance that could be as high as ±20°C.
TEMPERATURE– C –60
–120
TEMPERATURE REGISTER
–20 0 20 40 60 80 100 120
–40 –110
–80 –60 –40 –20 0 20 40
FIVE PARTS APGAIN = 00h
Figure 13. Temperature Register ANALOG-TO-DIGITAL CONVERSION
The analog-to-digital conversion in the ADE7756 is carried out using two second-order sigma-delta ADCs. The block diagram in Figure 14 shows a first-order (for simplicity) sigma-delta ADC. The converter is made up of two parts, first the sigma- delta modulator and second the digital low-pass filter.
A sigma-delta modulator converts the input signal into a con- tinuous serial stream of 1s and 0s at a rate determined by the sampling clock. In the ADE7756 the sampling clock is equal to CLKIN/4. The 1-bit DAC in the feedback loop is driven by the serial data stream. The DAC output is subtracted from the input signal. If the loop gain is high enough, the average value of the DAC output (and therefore the bit stream) will approach that of the input signal level. For any given input value in a single
sampling interval, the data from the 1-bit ADC is virtually mean- ingless. Only when a large number of samples are averaged, will a meaningful result be obtained. This averaging is carried out in the second part of the ADC, the digital low-pass filter. By aver- aging a large number of bits from the modulator the low-pass filter can produce 20-bit data words that are proportional to the input signal level.
The sigma-delta converter uses two techniques to achieve high resolution from what is essentially a 1-bit conversion technique.
The first is oversampling. By oversampling we mean that the signal is sampled at a rate (frequency) that is many times higher than the bandwidth of interest. For example, the sampling rate in the ADE7756 is CLKIN/4 (894 kHz) and the band of interest is 40 Hz to 2 kHz. Oversampling has the effect of spreading the quantization noise (noise due to sampling) over a wider bandwidth. With the noise spread more thinly over a wider bandwidth, the quantization noise in the band of interest is lowered—see Figure 15. However oversampling alone is not an efficient enough method to improve the signal to noise ratio (SNR) in the band of interest. For example, an oversampling ratio of 4 is required just to increase the SNR by only 6 dB (1 bit). To keep the oversampling ratio at a reasonable level, it is possible to shape the quantization noise so that the majority of the noise lies at the higher frequencies. This is what happens in the sigma-delta modulator, the noise is shaped by the integrator which has a high-pass-type response for the quantization noise.
The result is that most of the noise is at the higher frequencies where it can be removed by the digital low-pass filter. This noise shaping is also shown in Figure 15.
VREF
10100101
DIGITAL LOW- PASS FILTER MCLK/4
INTEGRATOR
1-BIT DAC LATCHED COMPARATOR
R C
ANALOG LOW- PASS FILTER
1 20
Figure 14. First Order Sigma-Delta (Σ-∆) ADC
SIGNAL
FREQUENCY – kHz
0 2 447 894
SAMPLING FREQUENCY SHAPED
NOISE ANTIALIAS FILTER (RC) DIGITAL
FILTER
NOISE SIGNAL
0 2 447 894
HIGH RESOLUTION OUTPUT FROM
DIGITAL LPF
NOISE
FREQUENCY – kHz


![Figure 9 shows the line voltage fall below a threshold that is set in the Sag Level register (SAGLVL[7:0]) for nine half-cycles.](https://thumb-eu.123doks.com/thumbv2/9dokorg/19439112.0/14.918.486.812.408.621/figure-shows-voltage-threshold-level-register-saglvl-cycles.webp)