First, as formally shown in Besley and Prat (2006) and Gentzkow et al. 2006), if advertising pro…tability is high, then it is costly for the media to skew their news coverage in the direction desired by a subsidizing group. Empirically, I test whether there is a positive relationship between the growth of the advertising market and the growth of independent media. As discussed in the background section, the main difference between partisan newspapers (newspapers affiliated with the Democratic or Republican party) and independent newspapers was not the size of the bias, but the extent of control a party had over the newspaper's news. coverage.
First, it presents empirical evidence of the link between the development of advertising markets and the growth of independent newspapers. I... found that new newspapers were likely to be more independent in the markets with higher advertising rates per reader and therefore higher advertising profitability. In this article I use data on the growth of independent newspapers in the United States in the 19th century.
The theoretical foundations of the relationship between advertising profitability and media independence depend on the assumptions of the relevant models. Therefore, the question of the relative importance of advertising revenue for media independence is largely empirical.
Data description
In the aforementioned theoretical models, the mechanism of advertising effects is mainly based on the assumption that audiences prefer less biased media. Although of course it depends on market structure, on average independent newspapers, especially in single-newspaper markets, are expected to have a larger audience because this is assumed to be the main reason for their independence. 22. I also use data on advertising rates (in dollars per 10 lines for a month), circulation (in copies distributed), year of creation, and periodicity (weekly, daily, bi-weekly, tri-weekly, etc.).
Because the demand for independent versus partisan newspapers may depend on the population's political preferences, it is important to take this into account in the analysis. To control for changing political preferences, I use data on county-level election results in presidential and congressional elections from the Clubb et al. 2006) dataset provided by the Interuniversity Consortium for Political and Social Research (ICPSR). For each state and year, I have the percentage of votes for Republican, Democratic, and other party candidates, as well as turnout from the most recent presidential and congressional elections.
Finally, I rely on Census data on population as reconstructed by Haines (2005): total county population (registered); share of the urban population (calculated as the population in cities larger than 25,000, divided by the total population); average wage in production (recorded); and average agricultural income per household (recorded and calculated as total income in the agricultural sector divided by the number of households in agriculture). My city population data comes from Ayer's catalog and is reported based on detailed Census data or population estimates.
Market structure
Political affiliations of newspapers can be broken down into entries (i.e. new newspapers entering the market), exits (old newspapers leaving the market), changes (newspapers changing their political affiliation) and mergers and acquisitions. . Note that the data does not reflect the fact that some of the entries and exits were the result of mergers and acquisitions, so the number of entries and exits in the sample may be slightly overstated.27 Two hundred and eighty newspapers switched from partisan to independent and two hundred...fifty nine from independent into party ones.
Thirty-two newspapers even switched from being democrat to republican and twenty from being republican to democrat. Not all of these newspapers were located in the South, thus changing their political affiliation due to party reorganization after the end of Reconstruction (in the South the number of switchers was 7 and 6, respectively). Newspapers that changed their political affiliations did so mainly because of a bad … financial situation.
Regressions with the affiliation switching dummy as the dependent variable show that the main determinant of switching was low newspaper circulation in previous years. Additionally, newspapers were more likely to switch if they were in lower-wage counties, were not in county seats, and were more in more populated cities.
Methodology and empirical results
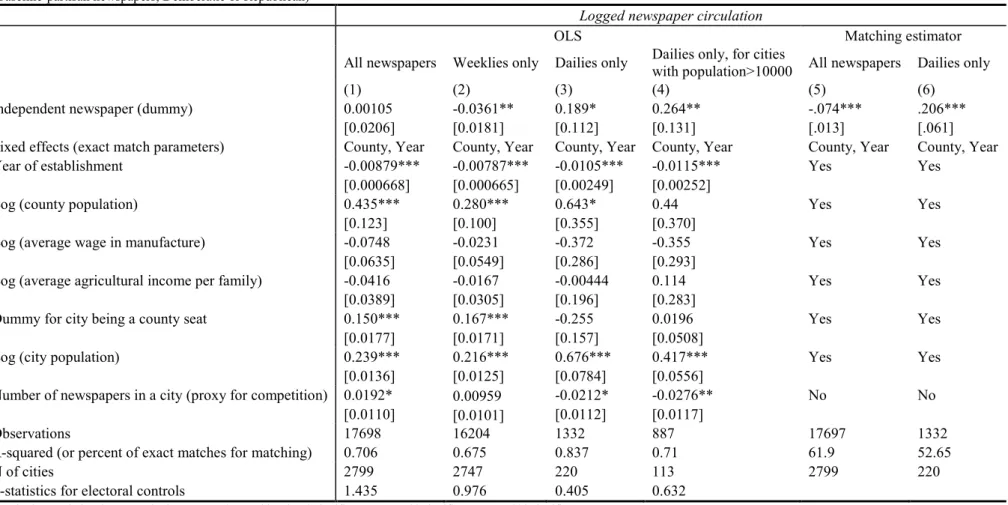
The main disadvantage of the specifications discussed so far is potential endogeneity, because independent newspapers may on average have higher advertising revenue per read than party-political newspapers.31 Even in the same market (city), newspapers' advertising frequencies can be the best response to each other's advertising price. The size of the effect is quite large compared to all the previous estimates. The results of the corresponding OLS regression for the same sample are shown in column 5.
In both column 5 and column 7, the effect in the OLS estimate is almost half that of the corresponding IV.34 estimate. Therefore, it is unlikely that the collinearity of advertising rates and average income variables is driving all the results. Most likely, the income variables are negative and insignificant in this context because we control for county ... fixed effects, which capture most of the differences in income between counties.
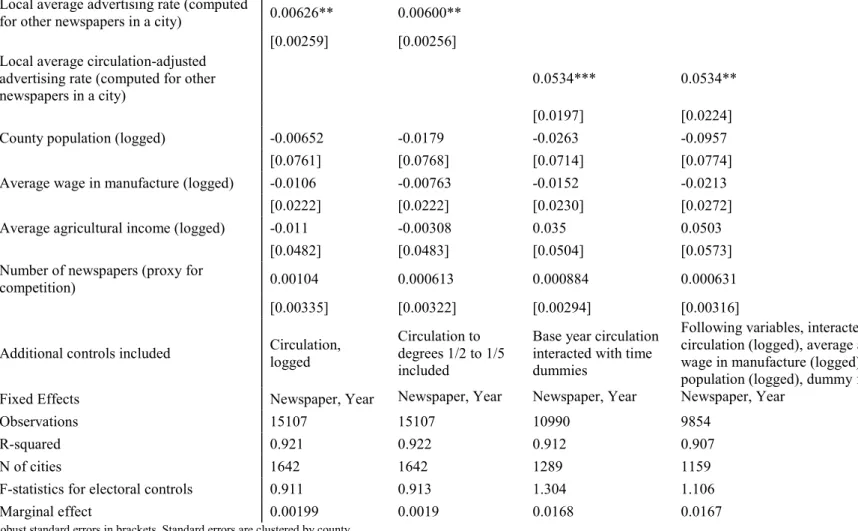
The effect size is similar to those obtained previously: a 2.7 p.p. the increase in the probability of starting as an independent newspaper after a one standard deviation increase in the local circulation adjusted advertising rate. One potential drawback of the results in Table 3 is that newspaper independence may be driven by some time-varying unobserved heterogeneity at the county or city level, e.g. an unnoticed change in the political preferences of people who were getting wealthier. For this part of the analysis, I collected data on local ordinances that regulate outdoor advertising and the distribution of newspapers and flyers.
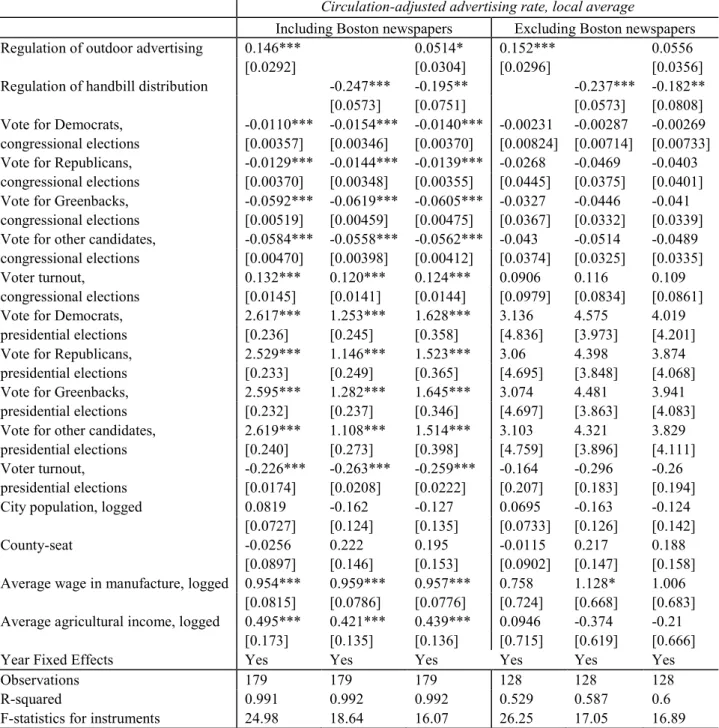
3 6I mainly use the Widener Library and the rare manuscript collection of the Harvard Law School Library. The results of Hansen's over-identification test for two-instrument specifications (reported in the last row of Table 7) suggest that the instruments used are valid. 3 9 The absolute value of the score for the bill distribution adjustment is greater than the score for the outdoor advertising adjustment.
This is probably due to the smaller sample (128 data points without Boston newspapers vs. 179 data points with Boston newspapers). To save space, most of the tables in the paper do not show the effects of the year ...xed, but they are presented in Table 8. Overall, this evidence can explain why the growth of the advertising market should not guarantee the growth of.
Alternative explanations and robustness checks
This should not necessarily be reflected in the election returns, which are included as controls. If we assume that the preferences of parties and special interest groups have remained relatively constant over these 6 years and, more importantly, geographically, then changes in the pattern of roll call votes correspond to changes in the preferences of their constituency, plus some noise . The faction of Republican newspapers was larger in places with more immigrants, consistent with the fact that the Republican party represented the interests of a foreign-born constituency during that period.51 Similarly, there is no indication that the changes in the faction of.
The coefficients for the African American population in the models with advertising figures or independent newspapers as dependent variables (columns 1-3 in Table 14) have different signs and are insignificant. I also checked the results of Table 3 for robustness to the inclusion of the fraction of immigrants or the fraction of African Americans in the regressions (results not reported). In the ICPSR dataset, census data for literacy are only available at the state level for 1880 and 1900.
However, if only the Southern states are included in the sample, only the coefficients in newspaper fixed effects specifications remain positive and significant. Independent newspapers in the South could in fact be sponsored by a non-dominant party and therefore be comparable to partisan newspapers in the North. In the mid-19th century, most American newspapers were partisan, as were many media outlets around the world in the early 21st century.
In areas with a faster growing advertising market, newspapers were more likely to be independent. The effect of advertising worked both through the arrival of new newspapers and through changes in the connection of existing newspapers. Another direction for future research is to see whether newspapers are becoming more partisan in their content during this crisis, both in the United States and in other countries.
Note: Election controls include the percentage of votes for Republicans, Democrats, Dollars, and other parties in the most recent presidential and congressional elections, and turnout in these elections. Note: The average circulation-adjusted advertising rate, a measure of A, is the calculated circulation-adjusted advertising rate for all newspapers in the city. One explanation is that the city population is insignificant due to the collinearity of the city population and the fact that it is a provincial capital, while another explanation suggests that publishing local ordinances in provincial capitals reduced the space available in the newspaper for advertisements, causing advertising rates to increase used to go.
Data on county seats are from ICPSR 8159 dataset, compiled by R. Only Republican, Democratic, or independent newspapers are included in the sample. Note: newspaper controls include a dummy variable for a daily newspaper and number of pages in the newspaper. County controls include the county's population, fraction of urban population, and 10 election control variables, including percentage votes for Republicans, Democrats, Greenbacks, and other parties in the most recent presidential and congressional elections, and voter turnout in these elections.
County controls include county population, log average manufacturing wages, log average farm income, and 10 election control variables, including percentage of votes for Republicans, Democrats, Greenbacks, and other parties in recent presidential and congressional elections and voter turnout in those elections.


